Regional Sustainability ›› 2026, Vol. 7 ›› Issue (2): 100328.doi: 10.1016/j.regsus.2026.100328
• Research article • Next Articles
CHEN Xuanhaoa, LI Chaob,*( ), ZHANG Shiqianga
Received:2025-03-24
Revised:2025-09-17
Accepted:2026-01-28
Published:2026-04-30
Online:2026-03-17
Contact:
* E-mail address: lichaomic@chd.edu.cn (LI Chao).
CHEN Xuanhao, LI Chao, ZHANG Shiqiang. Nonlinear carbon-water coupling in terrestrial ecosystems: Insights from China’s Three-North Shelterbelt Forest region[J]. Regional Sustainability, 2026, 7(2): 100328.
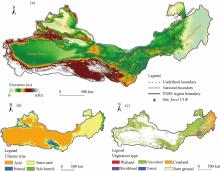
Fig. 1.
Topography (a), climatic types (b), and vegetation types (c) of the Three-North Shelterbelt Forest (TNSF) region. CUE, carbon use efficiency. Note that the figure is based on the standard map (GS(2020)3187) from the Map Service System (http://bzdt.ch.mnr.gov.cn/download.html) issued by the Ministry of Natural Resources of the People’s Republic of China, and the boundary of the standard map has not been modified."
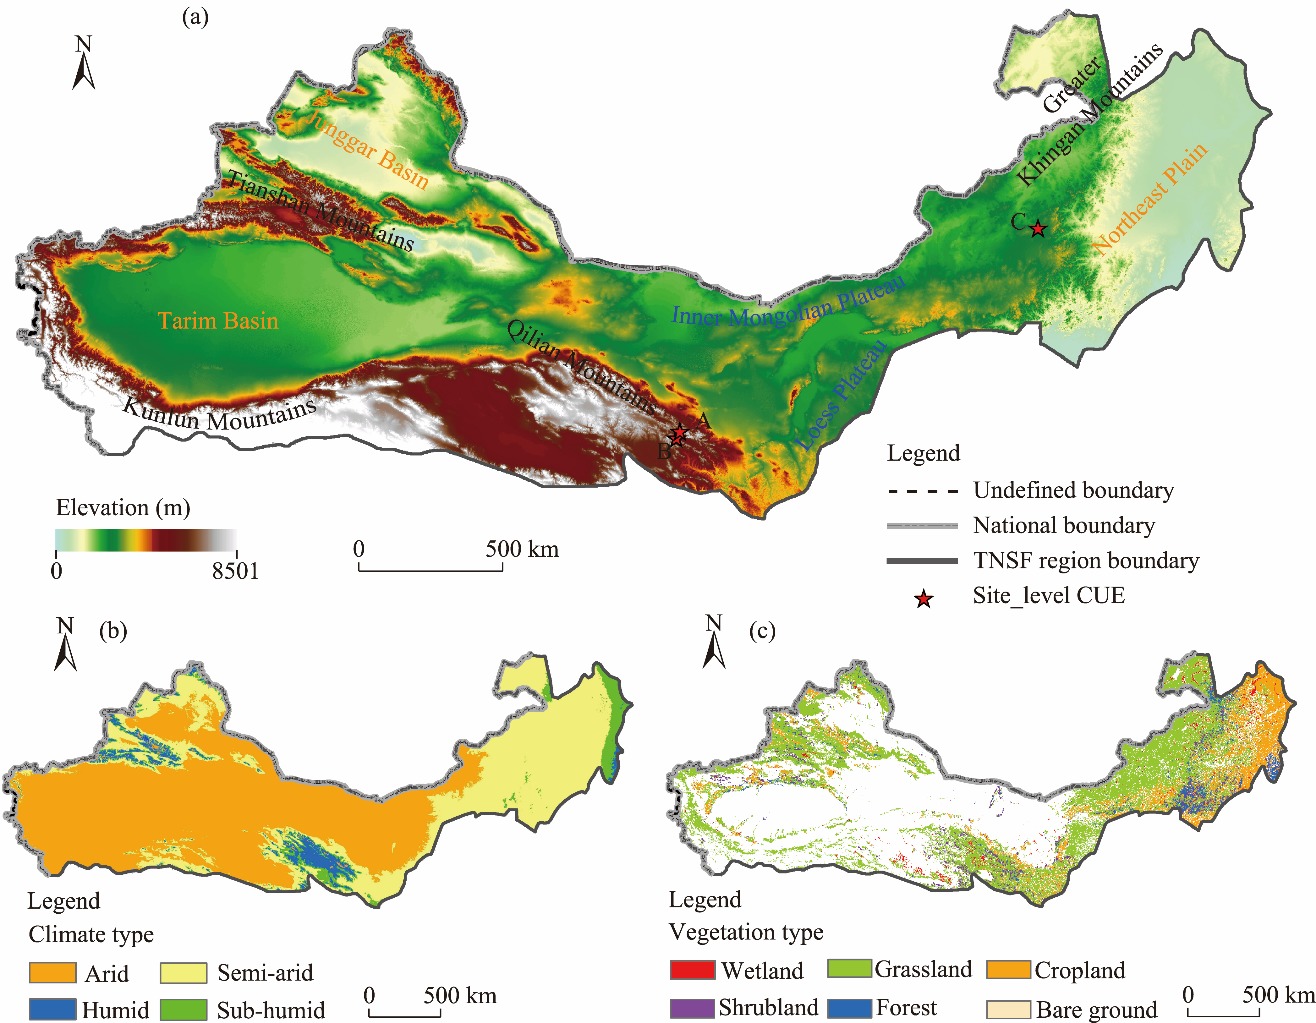
Table 1
Information and sources of data used in this study."
| Variable | Data product | Spatial resolution | Temporal resolution | Source |
|---|---|---|---|---|
| LST | MOD11A2 | 1.0 km | 8 d | https://search.earthdata.nasa.gov |
| NDVI | MOD13A1 | 0.5 km | 16 d | https://search.earthdata.nasa.gov |
| LAI | MOD15A2H | 0.5 km | 8 d | https://search.earthdata.nasa.gov |
| ET | MOD16A2 | 0.5 km | 8 d | https://search.earthdata.nasa.gov |
| GPP | MOD17A2H | 0.5 km | 8 d | https://search.earthdata.nasa.gov |
| MOD17A3HGF | 0.5 km | 1 a | https://search.earthdata.nasa.gov | |
| NPP | MOD17A3HGF | 0.5 km | 1 a | https://search.earthdata.nasa.gov |
| VCT | MCD12Q1 | 0.5 km | 1 a | https://search.earthdata.nasa.gov |
| TEM | Climatic data | 0.0083o | 1 month | http://data.tpdc.ac.cn/ |
| PRE | Climatic data | 0.0083o | 1 month | http://data.tpdc.ac.cn/ |
| PET | Climatic data | 0.0083o | 1 month | http://data.tpdc.ac.cn/ |
| SNR | ERA5 | 0.1000o | 1 month | https://cds.climate.copernicus.eu/ |
| VPD | Terra climatology | 4.0 km | 1 month | https://www.climatologylab.org/ |
| CO2 | Mauna Loa CO2 | 1.0000o | 1 a | https://www.esrl.noaa.gov/gmd/ccgg/trends/data.html |
| HF | Human footprint | 1.0 km | 1 a | https://figshare.com/articles/figure/An_annual_global_terrestrial_Human_Footprint_dataset_from_2000_to_2018/16571064 |
Table 2
Maximum light use efficiency (εmax) and maximum solar net radiation (SNRmax) for each vegetation type."
| Vegetation type | εmax (g C/MJ) | SNRmax (MJ/m2) | Vegetation type | εmax (g C/MJ) | SNRmax (MJ/m2) |
|---|---|---|---|---|---|
| Forest | 0.485 | 5.170 | Grassland | 0.542 | 4.460 |
| Cropland | 0.542 | 4.460 | Wetland | 0.542 | 4.460 |
| Shrubland | 0.429 | 4.490 | Bare ground | 0.542 | 4.460 |
Fig. 2.
Accuracy validation of net primary productivity (NPP) derived from the improved Carnegie-Ames-Stanford Approach (CASA) model with Moderate-resolution Imaging Spectroradiometer (MODIS) NPP in different years (a-c), as well as relationship between simulated carbon use efficiency (CUE) derived from MODIS data and site-level CUE observations from Tang et al. (2019). R², coefficient of determination; MAE, mean absolute error; RMSE, root mean square error. The gray area in Figure 2d is the 95.00% confidence band of the fitted line (uncertainty of the mean response)."
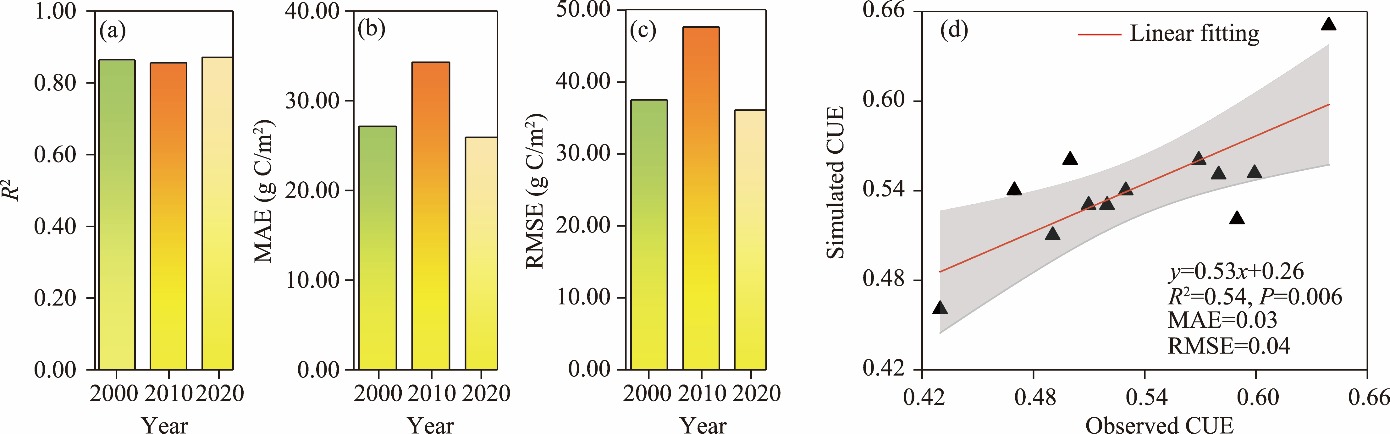
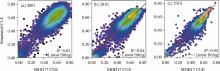
Fig. 3.
Accuracy validation of simulated CUE derived from MODIS data with MOD17 CUE values in 2001 (a), 2010 (b), and 2018 (c). The MOD17 CUE was calculated as the ratio of MOD17A3HGF NPP to gross primary productivity (GPP). Points are colored by point density from low (purple) to high (yellow/green)."
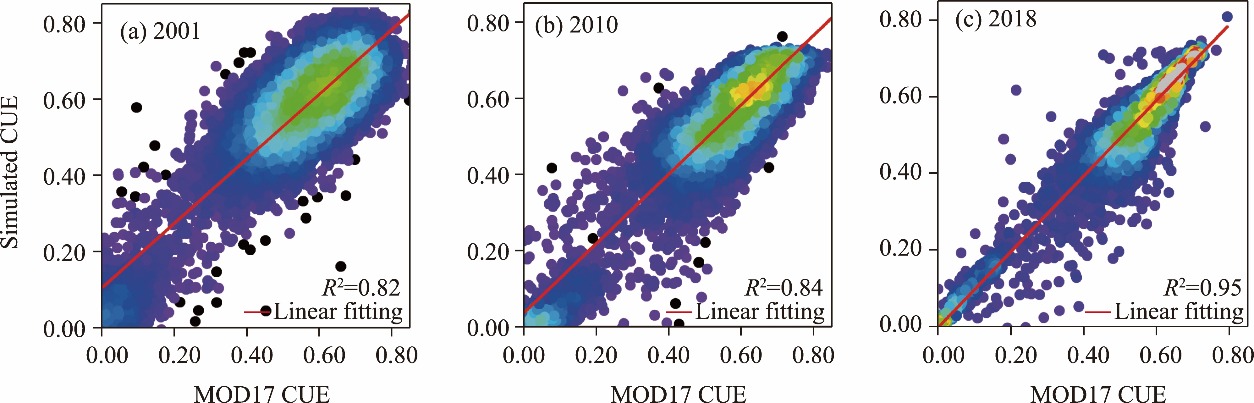
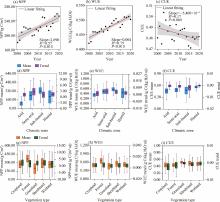
Fig. 4.
Trend characteristics of NPP, water use efficiency (WUE), and CUE. (a), overall trend of NPP across the TNSF region; (b), overall trend of WUE across the TNSF region; (c), overall trend of CUE across the TNSF region; (d), trends of NPP across different climatic zones; (e), trends of WUE across different climatic zones; (f), trends of CUE across different climatic zones; (g), trends of NPP across various vegetation types; (h), trends of WUE across various vegetation types; (i), trends of CUE across various vegetation types. The gray area (a-c) is the confidence band of the fitted line. In all boxplots (d-i), the central line is the median; the box spans the interquartile range (IQR); the whiskers extend to 1.5×IQR; and the circle is the arithmetic mean."
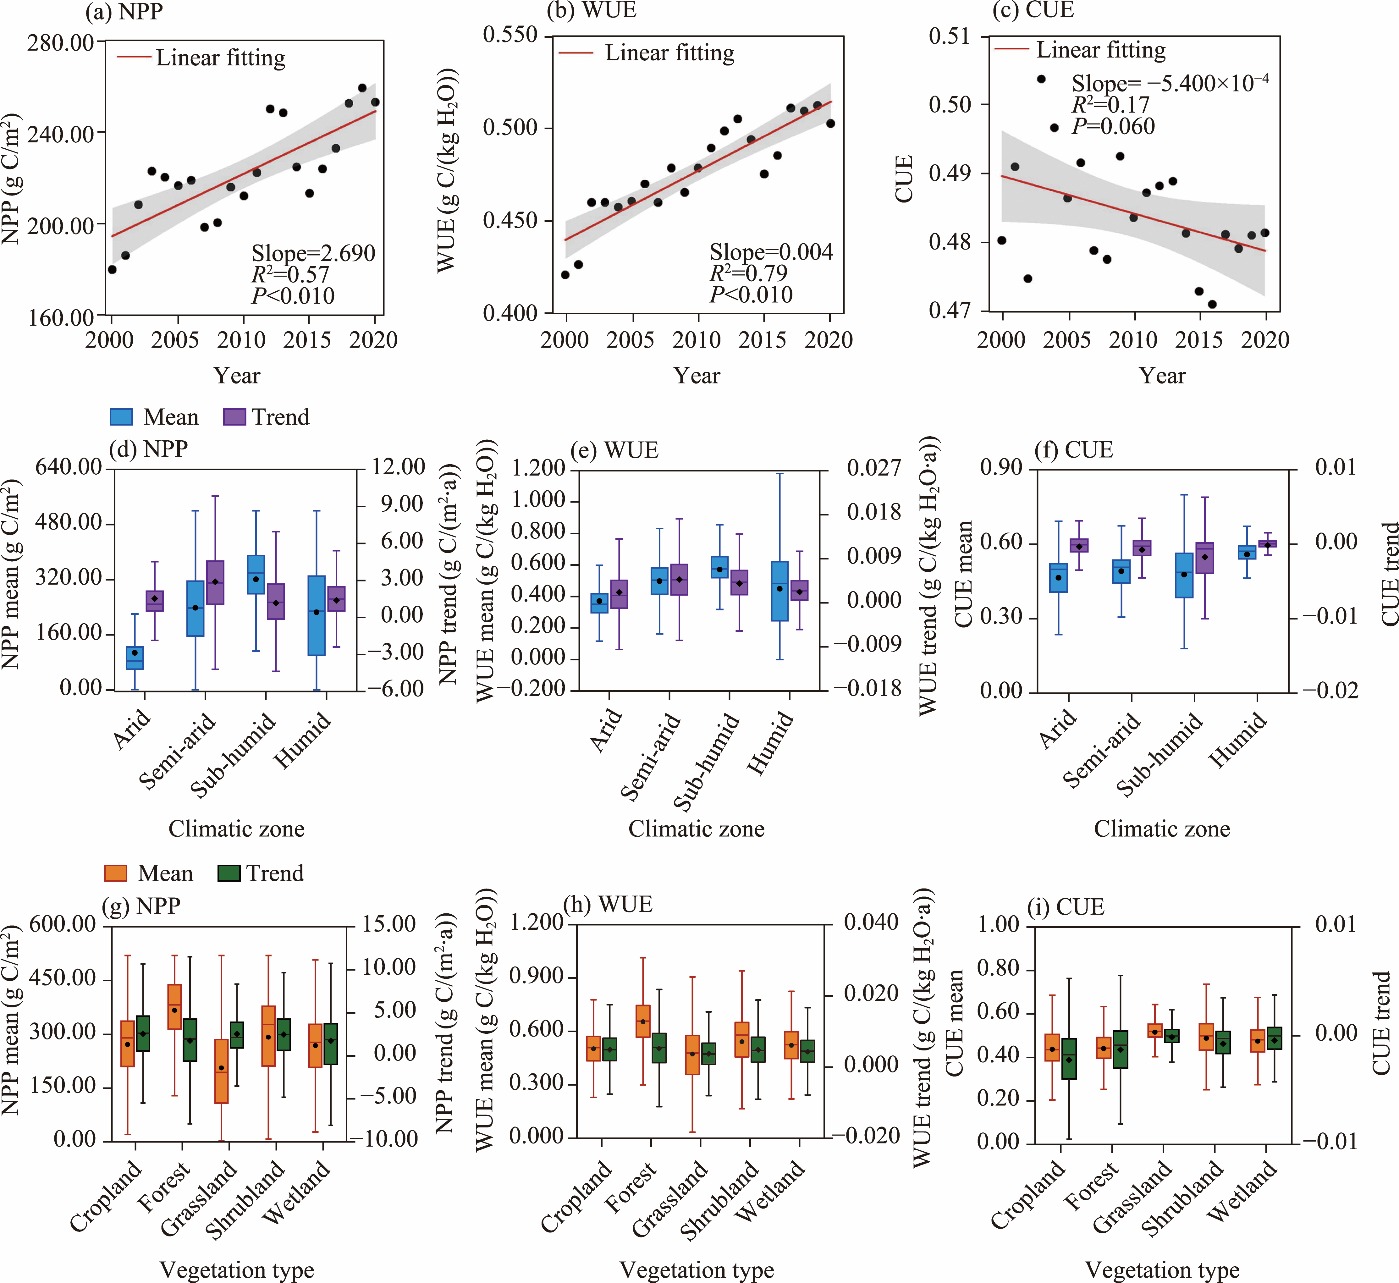
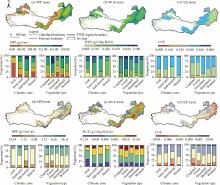
Fig. 5.
Spatial distribution and temporal trends of NPP, WUE, and CUE. (a), spatial distribution of NPP; (b), spatial distribution of WUE; (c), spatial distribution of CUE; (d), temporal trend of NPP; (e), temporal trend of WUE; (f), temporal trend of CUE. In panels (d-f), bright-red points mark locations that pass the significance test at the 95.00% level (P<0.050), while unmarked locations are not significant. Note that the figure is based on the standard map (GS(2020)3187) from the Map Service System (http://bzdt.ch.mnr.gov.cn/download.html) issued by the Ministry of Natural Resources of the People’s Republic of China, and the boundary of the standard map has not been modified."
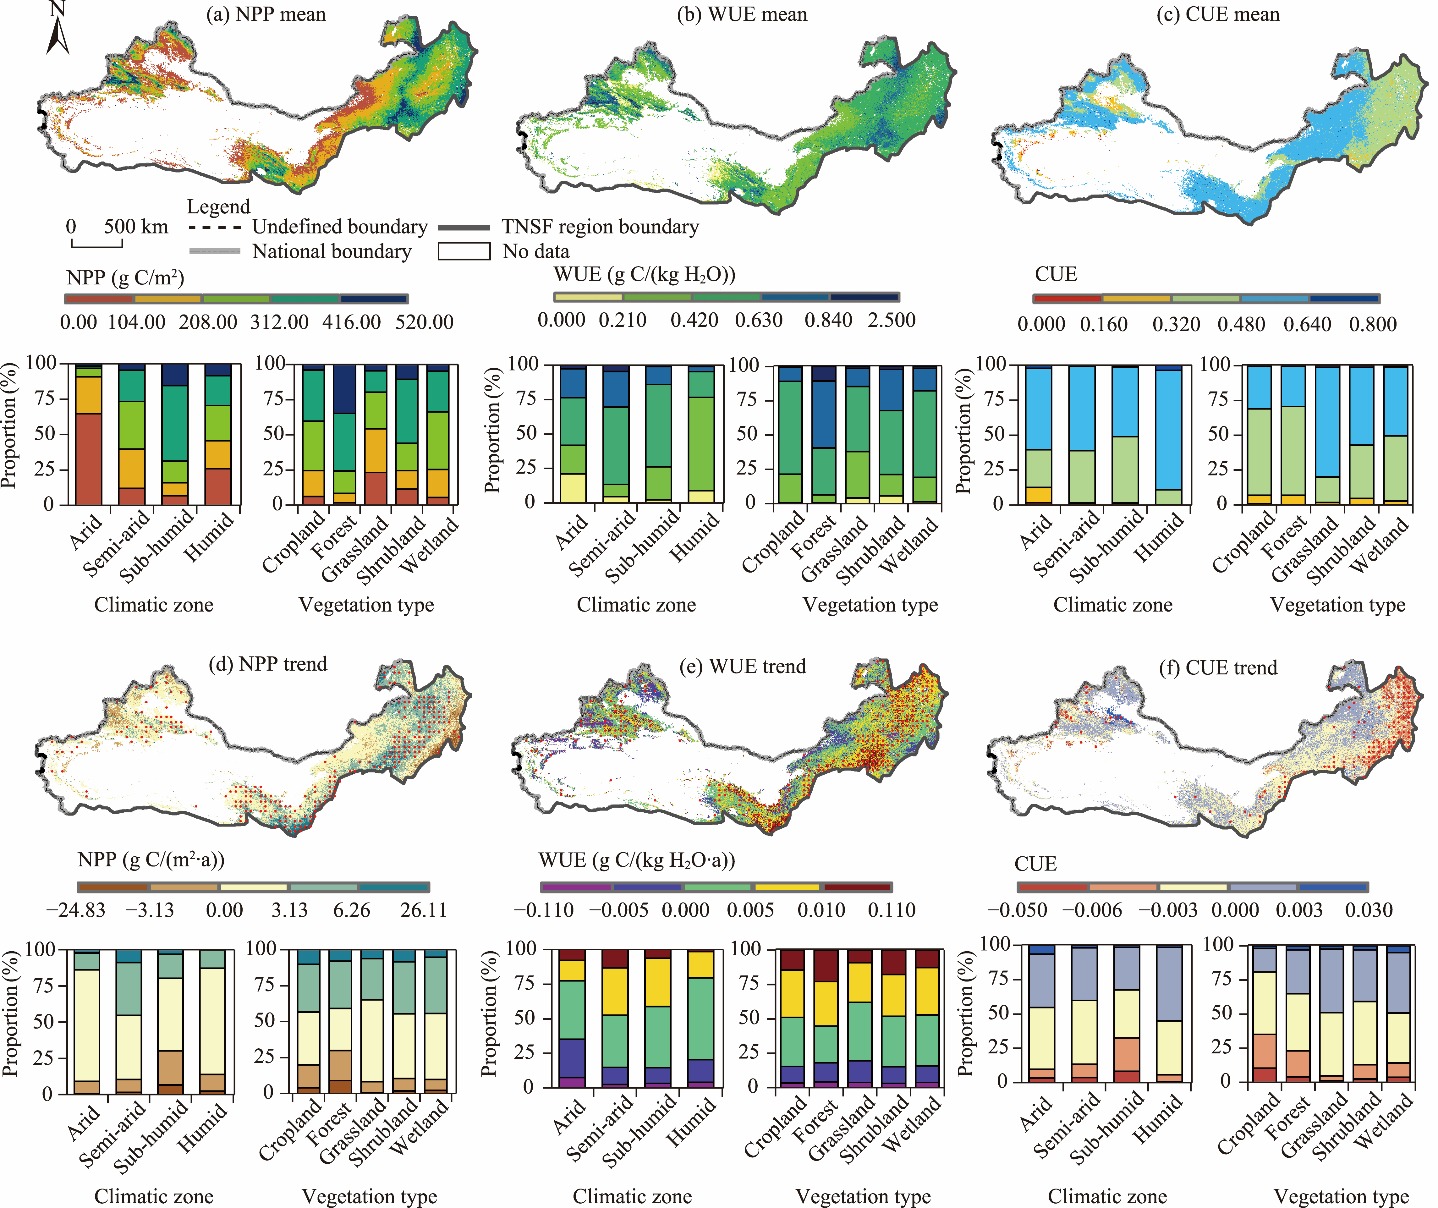
Fig. 6.
Spatial correlations and local clustering patterns between WUE and NPP, as well as between CUE and NPP. (a), spatial correlation between WUE and NPP; (b), spatial correlation between CUE and NPP; (c), local clustering pattern of WUE and NPP; (d), local clustering pattern of CUE and NPP. In panels (a) and (b), black points mark locations that pass the significance test at the 95.00% level (P<0.050), while unmarked locations are not significant. Note that the figure is based on the standard map (GS(2020)3187) from the Map Service System (http://bzdt.ch.mnr.gov.cn/download.html), issued by the Ministry of Natural Resources of the People’s Republic of China, and the boundary of the standard map has not been modified."
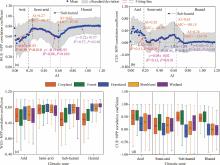
Fig. 7.
Correlation trends of (a) WUE-NPP and (b) CUE-NPP with increasing aridity index (AI), and correlation patterns of (c) WUE-NPP and (d) CUE-NPP across different vegetation types within various climatic zones. ΔAIC, Akaike Information Criterion. A difference in AIC values (ΔAIC=AIC2-AIC1) less than -2 (ΔAIC< -2) was considered indicative of significant differences in trend variation between segmented models. The gray shading area in panels (a) and (b) denotes ±1 standard deviation. In all boxplots (c and d), the central line is the median; the box spans the IQR; the whiskers extend to 1.5×IQR; and the square is the arithmetic mean."
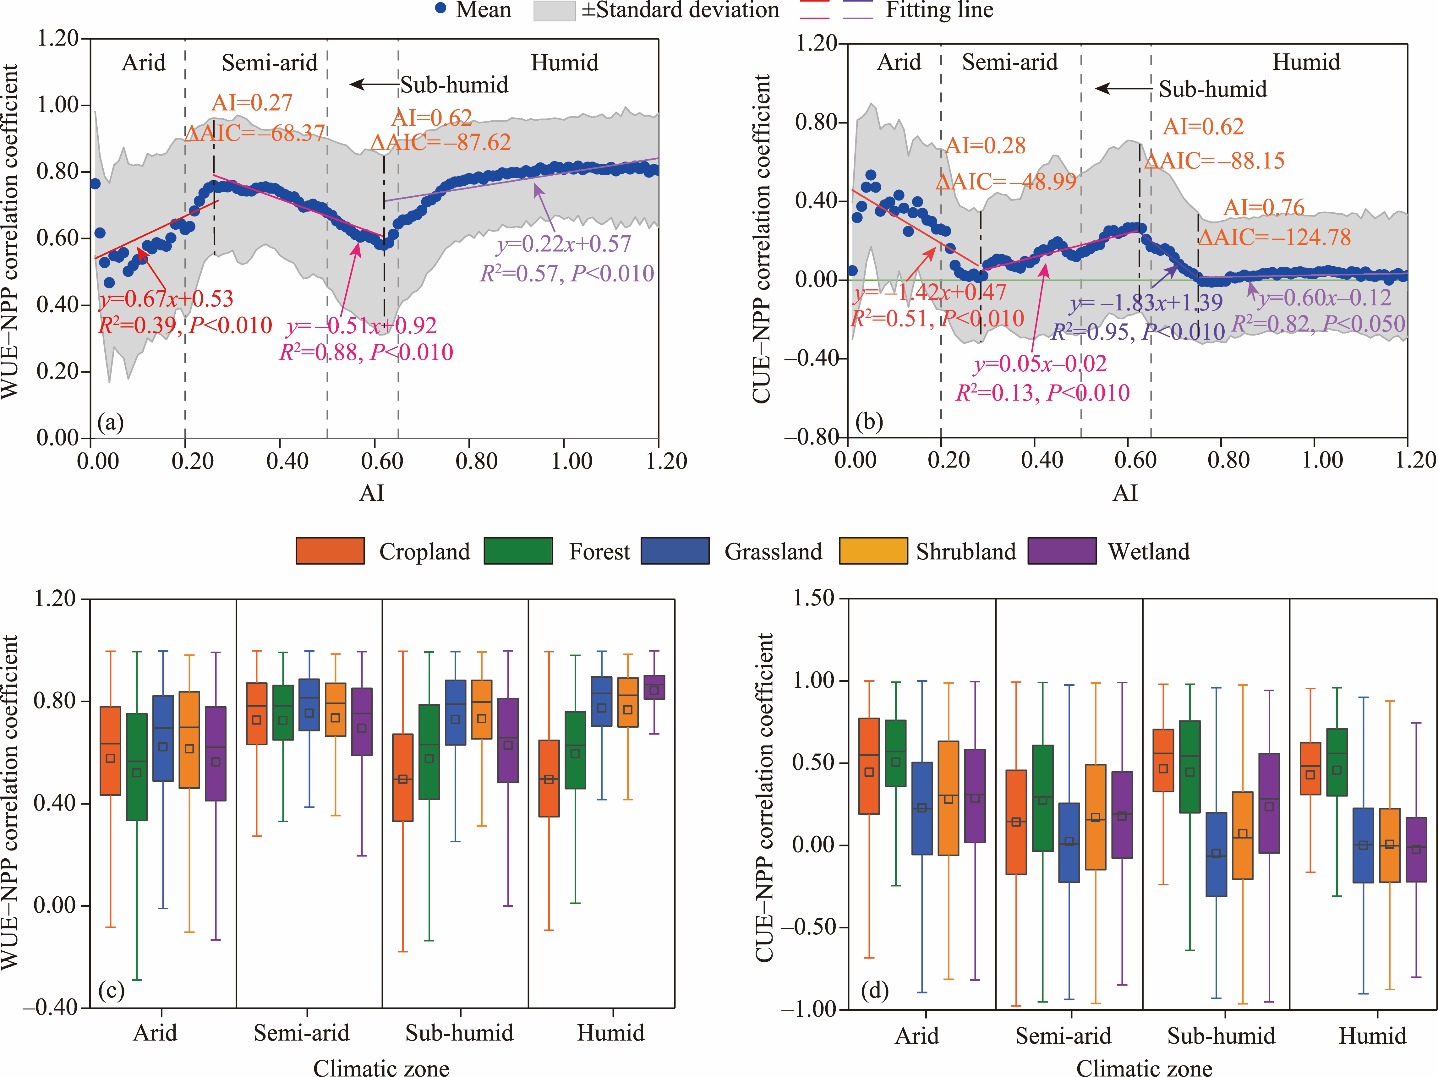
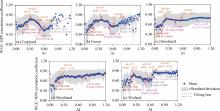
Fig. 8.
Correlation trends of WUE-NPP with increasing AI across different vegetation types: cropland (a), forest (b), grassland (c), shrubland (d), and wetland (e). The gray shading area denotes ±1 standard deviation."
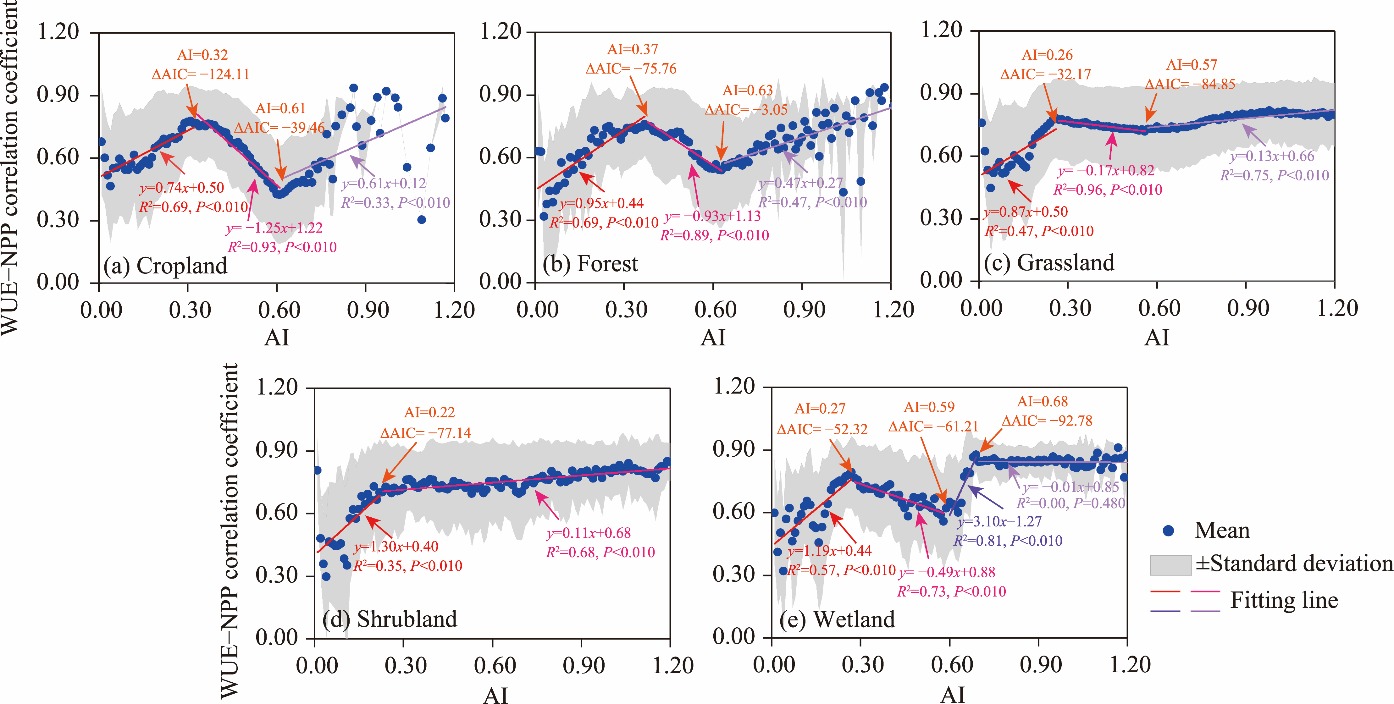
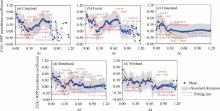
Fig. 9.
Correlation trends of CUE-NPP with increasing AI across different vegetation types: cropland (a), forest (b), grassland (c), shrubland (d), and wetland (e). The gray shading area denotes ±1 standard deviation."
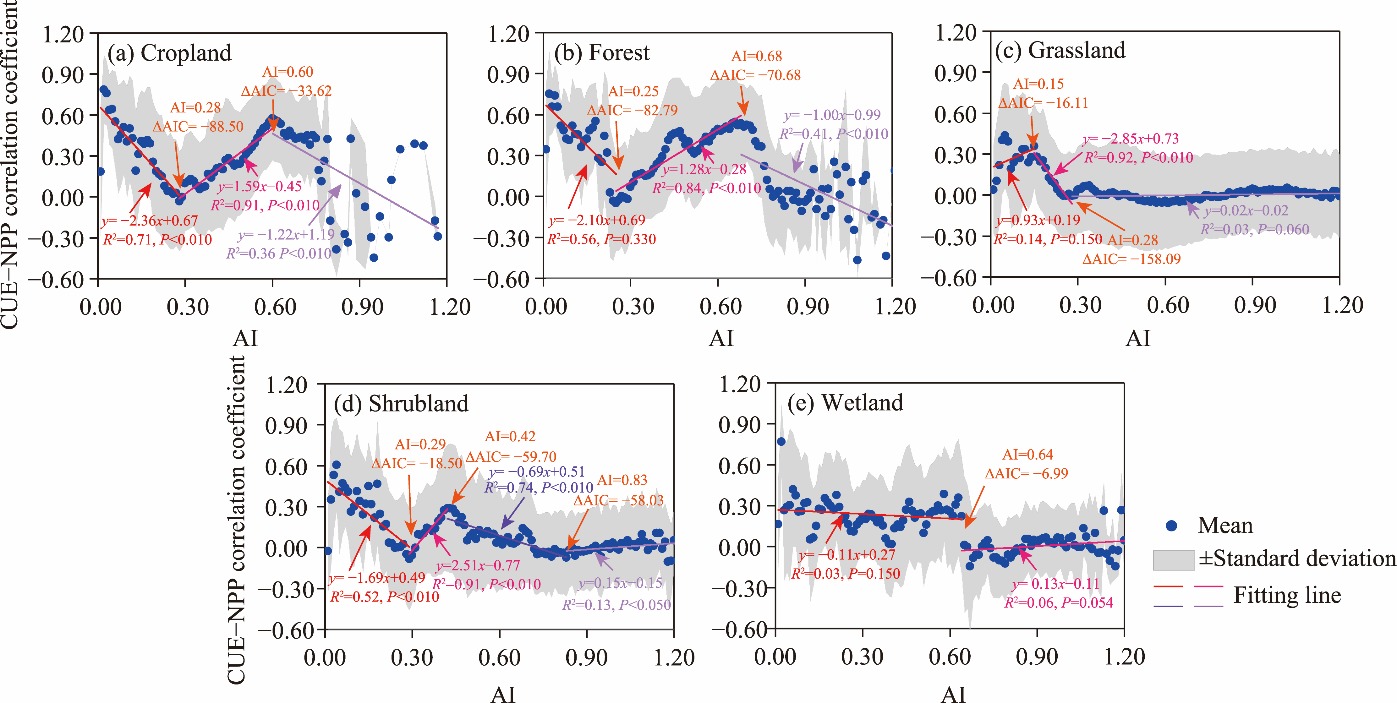
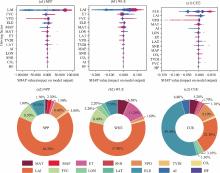
Fig. 10.
Contributions of driving factors to NPP (a1 and a2), WUE (b1 and b2), and CUE (c1 and c2), along with their respective contribution percentages. Panels (a1)-(c1) show factor contributions in descending order from top to bottom, with colors ranging from blue to red indicating low to high eigenvalues. In panels (a2-c2), only data with a contribution rate ≥1.0% are labeled. SHAP, SHapley additive exPlanations; LAI, leaf area index; FVC, fractional vegetation cover; VPD, vapor pressure deficit; ELE, elevation; MAP, mean annual precipitation; MAT, mean annual temperature; ET, evapotranspiration; TVDI, temperature vegetation dryness index; LAT, latitude; LON, longitude; SNR, solar net radiation; CO2, carbon dioxide; HF, human footprint. The abbreviations are the same in the following figures."
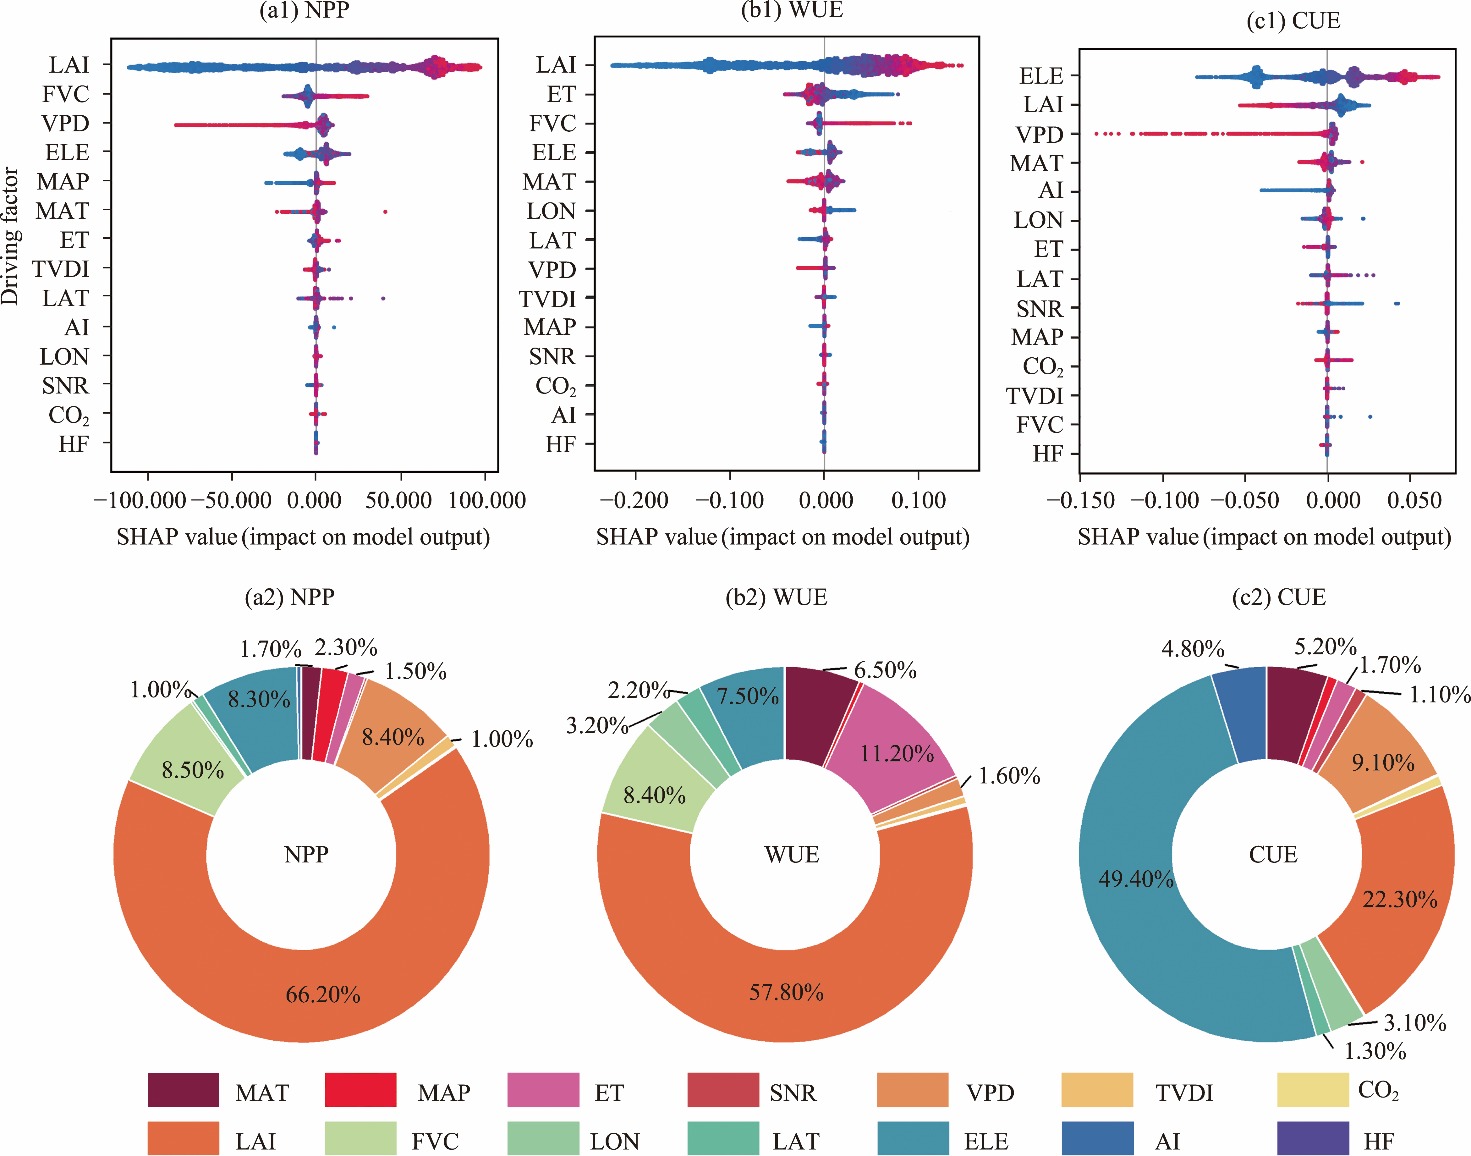
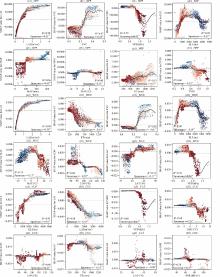
Fig. 11.
Nonlinear effects of key driving factors on NPP, WUE, and CUE. (a1-h1), nonlinear effects of LAI, FVC, VPD, ELE, MAP, MAT, ET, and TVDI on NPP; (a2-h2), nonlinear effects of LAI, ET, FVC, ELE, MAT, LON, LAT, VPD on WUE; (a3-h3), nonlinear effects of ELE, LAI, VPD, MAT, LON, ET, LAT, SNR on CUE. The rug plot below each scatterplot represents the density of data distribution. The color gradient in the scatterplots, ranging from dark red to dark blue, indicates AI values from low to high. Spearman r denotes the nonlinear correlation coefficient between the SHAP value of each explanatory variable and AI. The black curve represents the fitted relationship derived from neural network fitting. **, P<0.010 level."

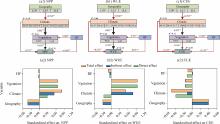
Fig. 12.
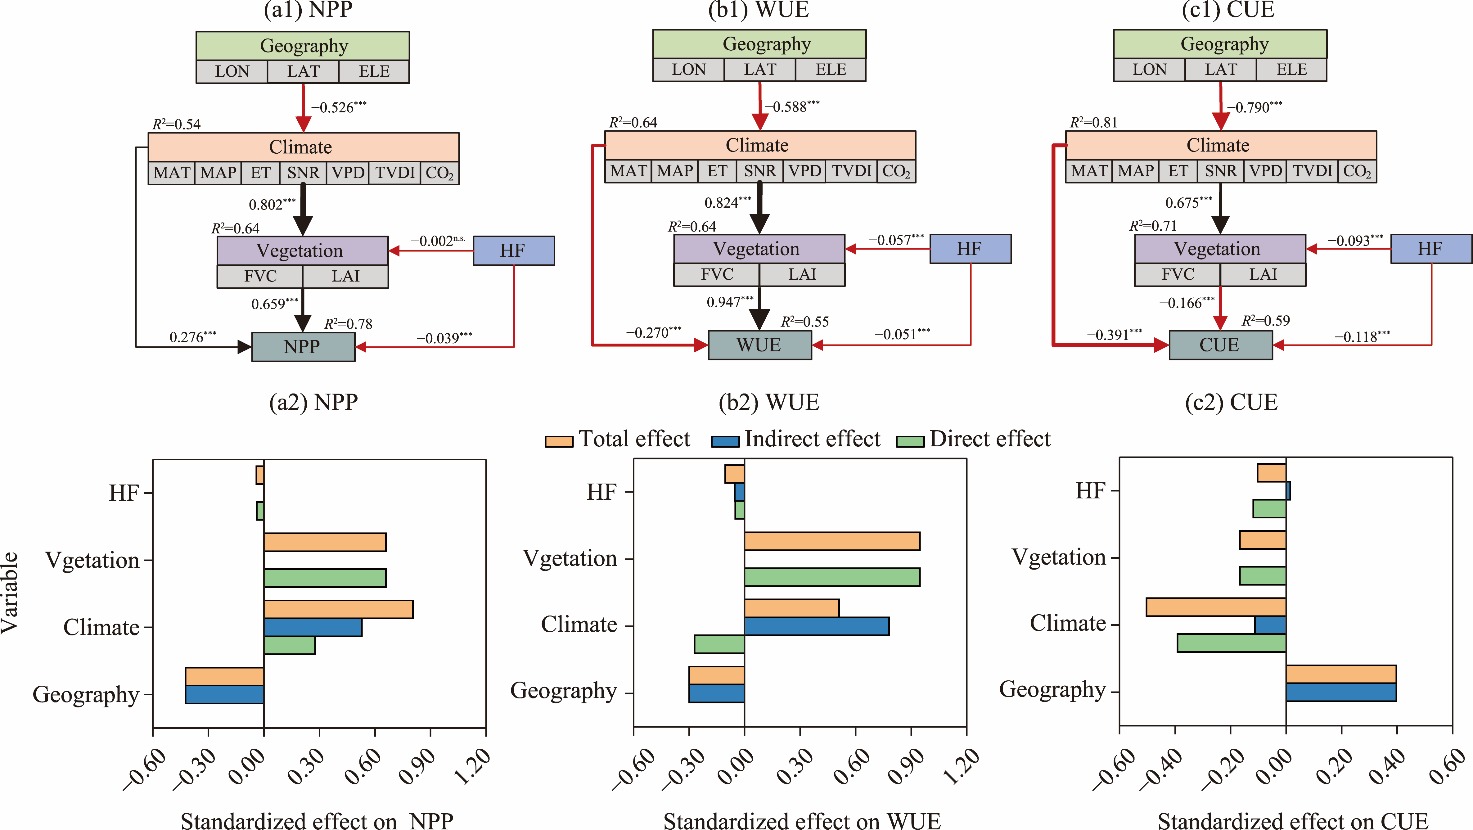
Path analyses of geographical, climatic, vegetation, and anthropogenic effects on NPP (a1 and a2), WUE (b1 and b2), and CUE (c1 and c2). In panels (a1)-(c1), arrows denote causal paths: black arrows indicate positive effects, and red arrows indicate negative effects. Line thickness is proportional to the absolute standardized path coefficient (the thicker the line, the stronger the effect). Numbers next to each arrow are standardized path coefficients. *** indicates significance at the 99.00% confidence level; n.s. denotes not statistically significant."
| [1] |
Akaike H., 1974. A new look at the statistical model identification. IEEE Transactions on Automatic Control. 19(6), 716-723.
doi: 10.1109/TAC.1974.1100705 |
| [2] | Alsafadi K., Bashir B., Mohammed S., et al., 2024. Response of ecosystem carbon-water fluxes to extreme drought in West Asia. Remote Sensing. 16(7), 1179, doi: 10.3390/rs16071179. |
| [3] | An X., 2022. Responses of water use efficiency to climate change in evapotranspiration and transpiration ecosystems. Ecological Indicators. 141, 109157, doi: 10.1016/j.ecolind.2022.109157. |
| [4] | Bian Z.J., Roujean J.F., Fan T.Y., et al., 2023. An angular normalization method for temperature vegetation dryness index (TVDI) in monitoring agricultural drought. Remote Sensing of Environment. 284, 113330, doi: 10.1016/j.rse.2022.113330. |
| [5] | Chen J.K., Pu J.B., Li J.H., et al., 2024. Response of carbon- and water-use efficiency to climate change and human activities in China. Ecological Indicators. 160, 111829, doi: 10.1016/j.ecolind.2024.111829. |
| [6] | Chen T.Q., Guestrin C., 2016. XGBoost:A scalable tree boosting system. In: KrishnapuramB., ShahM., SmolaA.J., (Proceedings of the 22nd ACM SIGKDD International Conference on Knowledge Discovery and Data Mining.eds.). New York: Association for Computing Machinery, 785-794. |
| [7] | Cloern J.E., Safran S.M., Smith Vaughn L., et al., 2021. On the human appropriation of wetland primary production. Science of The Total Environment. 785, 147097, doi: 10.1016/j.scitotenv.2021.147097. |
| [8] | Cui P., Xv D.W., Tang J.N., et al., 2024. Assessing the effects of urban green spaces metrics and spatial structure on LST and carbon sinks in Harbin, a cold region city in China. Sustainable Cities and Society. 113, 105659, doi: 10.1016/j.scs.2024.105659. |
| [9] | Deng C.L., Zhang B.Q., Cheng L.Y., et al., 2019. Vegetation dynamics and their effects on surface water-energy balance over the Three-North Region of China. Agricultural and Forest Meteorology. 275, 79-90. |
| [10] | Ding H., Shi X.L., Yuan Z., et al., 2024. Does vegetation greening have a positive effect on global vegetation carbon and water use efficiency? Science of The Total Environment. 951, 175589, doi: 10.1016/j.scitotenv.2024.175589. |
| [11] | Du L.T., Gong F., Zeng Y.J., et al., 2021. Carbon use efficiency of terrestrial ecosystems in desert/grassland biome transition zone: A case in Ningxia Province, Northwest China. Ecological Indicators. 120, 106971, doi: 10.1016/j.ecolind.2020.106971. |
| [12] | Du X.Z., Zhao X., Zhou T., et al., 2019. Effects of climate factors and human activities on the ecosystem water use efficiency throughout northern China. Remote Sensing. 11(23), 2766, doi: 10.3390/rs11232766. |
| [13] | Feng X.M., Fu B.J., Piao S.L., et al., 2016. Revegetation in China’s Loess Plateau is approaching sustainable water resource limits. Nature Climate Change. 6, 1019-1022. |
| [14] |
Fu C.L., Xu M., 2023. Achieving carbon neutrality through ecological carbon sinks: A systems perspective. Green Carbon. 1(1), 43-46.
doi: 10.1016/j.greenca.2023.08.005 |
| [15] | Gang C.C., Wang Z.N., You Y.F., et al., 2022. Divergent responses of terrestrial carbon use efficiency to climate variation from 2000 to 2018. Global and Planetary Change. 208, 103709, doi: 10.1016/j.gloplacha.2021.103709. |
| [16] | Gentine P., Green J.K., Guérin M., et al., 2019. Coupling between the terrestrial carbon and water cycles-a review. Environmental Research Letters. 14(8), 083003, doi: 10.1088/1748-9326/ab22d6. |
| [17] | Gong H.B., Cao L., Duan Y.F., et al., 2023. Multiple effects of climate changes and human activities on NPP increase in the Three-north Shelter Forest Program area. Forest Ecology and Management. 529, 120732, doi: 10.1016/j.foreco.2022.120732. |
| [18] |
Hair J.F., Matthews L.M., Matthews R.L., et al., 2017. PLS-SEM or CB-SEM: updated guidelines on which method to use. International Journal of Multivariate Data Analysis. 1(2), 107-123.
doi: 10.1504/IJMDA.2017.087624 |
| [19] | Hair J.F., Risher J.J., Sarstedt M., et al., 2019. When to use and how to report the results of PLS-SEM. European Business Review. 31(1), 2-24. |
| [20] | Hou Q.Q., Ji Z.X., Yang H., et al., 2022. Impacts of climate change and human activities on different degraded grassland based on NDVI. Scientific Reports. 12, 15918, doi: 10.1038/s41598-022-19943-6. |
| [21] | Hou X., Zhang B., He Q.Q., et al., 2024. Spatial-temporal variations in the climate, net ecosystem productivity, and efficiency of water and carbon use in the middle reaches of the Yellow River. Remote Sensing. 16(17), 3312, doi: 10.3390/rs16173312. |
| [22] | Khalifa M., Elagib N.A., Ribbe L., et al., 2018. Spatio-temporal variations in climate, primary productivity and efficiency of water and carbon use of the land cover types in Sudan and Ethiopia. Science of The Total Environment. 624, 790-806. |
| [23] | Lam K.L., Liu G., Motelica-Wagenaar A.M., et al., 2022. Toward carbon-neutral water systems: insights from global cities. Engineering. 14, 77-85. |
| [24] | Lei S., Zhou P., Lin J.Y., et al., 2025. Spatiotemporal variation in carbon and water use efficiency and their influencing variables based on remote sensing data in the Nanling Mountains region. Remote Sensing. 17(4), 648, doi: 10.3390/rs17040648. |
| [25] | Li B., Huang F., Chang S., et al., 2019a. The variations of satellite-based ecosystem water use and carbon use efficiency and their linkages with climate and human drivers in the Songnen Plain, China. Advances in Meteorology. 1, e8659138, doi: 10.1155/2019/8659138. |
| [26] | Li B., Huang F., Qin L.J., et al., 2019b. Spatio-temporal variations of carbon use efficiency in natural terrestrial ecosystems and the relationship with climatic factors in the Songnen Plain, China. Remote Sensing. 11(21), 2513, doi: 10.3390/rs11212513. |
| [27] | Li C., Li X.M., Luo D.L., et al., 2021a. Spatiotemporal pattern of vegetation ecology quality and its response to climate change between 2000-2017 in China. Sustainability. 13(3), 1419, doi: 10.3390/su13031419. |
| [28] | Li H., Xu F., Li Z.C., et al., 2021b. Forest changes by precipitation zones in northern China after the Three-North Shelterbelt Forest Program in China. Remote Sensing. 13(4), 543, doi: 10.3390/rs13040543. |
| [29] | Liu C.L., Li W.L., Wang W.Y., et al., 2021. Quantitative spatial analysis of vegetation dynamics and potential driving factors in a typical alpine region on the northeastern Tibetan Plateau using the google earth engine. CATENA. 206, 105500, doi: 10.1016/j.catena.2021.105500. |
| [30] | Liu X.Y., Liu C., Fan B.H., et al., 2022. Spatial responses of ecosystem water-use efficiency to hydrothermal and vegetative gradients in alpine grassland ecosystem in drylands. Ecological Indicators. 141, 109064, doi: 10.1016/j.ecolind.2022.109064. |
| [31] | Liu X.Y., Lai Q., Yin S., et al., 2024. Spatio-temporal patterns and control mechanism of the ecosystem carbon use efficiency across the Mongolian Plateau. Science of The Total Environment. 907, 167883, doi: 10.1016/j.scitotenv.2023.167883. |
| [32] | Lu F., Hu H.F., Sun W.J., et al., 2018. Effects of national ecological restoration projects on carbon sequestration in China from 2001 to 2010. Proceedings of the National Academy of Sciences of the United States of America. 115(16), 4039-4044. |
| [33] | Lundberg S.M., Lee S.I., 2017. A unified approach to interpreting model predictions. In: GuyonI., LuxburgU.V., BengioS., (Advances in Neural Information Processing Systems 30 (eds.). NIPS 2017). California: NeurIPS Proceedings. |
| [34] | Luo X.Z., Zhao R.Y., Chu H.S., et al., 2025. Global variation in vegetation carbon use efficiency inferred from eddy covariance observations. Nature Ecology & Evolution. 9, 1414-1425. |
| [35] | Mu H.W., Li X.C., Wen Y.N., et al., 2022. A global record of annual terrestrial Human Footprint dataset from 2000 to 2018. Scientific Data. 9, 176, doi: 10.1038/s41597-022-01284-8. |
| [36] | Peng D.L., Wu C.Y., Zhang B., et al., 2016. The influences of drought and land-cover conversion on inter-annual variation of NPP in the three-north shelterbelt program zone of China based on MODIS Data. PLoS ONE. 11(6), e0158173, doi: 10.1371/journal.pone.0158173. |
| [37] |
Potter C.S., Randerson J.T., Field C.B., et al., 1993. Terrestrial ecosystem production: A process model based on global satellite and surface data. Global Biogeochemical Cycles. 7(4), 811-841.
doi: 10.1029/93GB02725 |
| [38] | Qin G.X., Meng Z.Y., Fu Y., 2022. Drought and water-use efficiency are dominant environmental factors affecting greenness in the Yellow River Basin, China. Science of The Total Environment. 834, 155479, doi: 10.1016/j.scitotenv.2022.155479. |
| [39] | Sa R.L., Hua Y.C., Zhai K.T., et al., 2023. Assessing ecological services in the three-north shelter forest area of china using remote sensing. Applied Ecology & Environmental Research. 21(1), 261-285. |
| [40] | Sanchez G., Trinchera L., Russolillo G., 2013. Plspm: Tools for Partial Least Squares Path Modeling (PLS-PM). [2025-01-26]. https://cran.r-project.org/package=plspm. |
| [41] |
Shao H.B., Chu L.Y., Jaleel C.A., et al., 2009. Understanding water deficit stress-induced changes in the basic metabolism of higher plants - biotechnologically and sustainably improving agriculture and the ecoenvironment in arid regions of the globe. Critical Reviews in Biotechnology. 29(2), 131-151.
doi: 10.1080/07388550902869792 |
| [42] |
Shao R., Zhang B.Q., Su T.X., et al., 2019. Estimating the increase in regional evaporative water consumption as a result of vegetation restoration over the Loess Plateau, China. Journal of Geophysical Research-Atmospheres. 124(22), 11783-11802.
doi: 10.1029/2019JD031295 |
| [43] | Sippel S., Reichstein M., Ma X., et al., 2018. Drought, heat, and the carbon cycle: a review. Current Climate Change Reports. 4, 266-286. |
| [44] | Tang X.L., Carvalhais N., Moura C., et al., 2019. Global variability of carbon use efficiency in terrestrial ecosystems. Biogeosciences Discussions. doi: 10.5194/bg-2019-37. |
| [45] | Tarin T., Nolan R.H., Eamus D., et al., 2020. Carbon and water fluxes in two adjacent Australian semi-arid ecosystems. Agricultural and Forest Meteorology. 281, 107853, doi: 10.1016/j.agrformet.2019.107853. |
| [46] |
Tian H.Q., Chen G.S., Liu M.L., et al., 2010. Model estimates of net primary productivity, evapotranspiration, and water use efficiency in the terrestrial ecosystems of the southern United States during 1895-2007. Forest Ecology and Management. 259(7), 1311-1327.
doi: 10.1016/j.foreco.2009.10.009 |
| [47] | Wang L.X., Gao J.X., Zhang W.G., et al., 2022. Carbon Sequestration in Vegetation and its Change in the Three-North Shelter Forest Region of China in 2000-2021. [2025-02-22]. https://www.researchsquare.com/article/rs-1710152/v1. |
| [48] | Wang Y., Lü Y.H., Lü D., et al., 2024a. Carbon and water relationships change nonlinearly along elevation gradient in the Qinghai Tibet Plateau. Journal of Hydrology. 628, 130529, doi: 10.1016/j.jhydrol.2023.130529. |
| [49] | Wang Y.P., Zhang L., Liang X., et al., 2024b. Coupled models of water and carbon cycles from leaf to global: A retrospective and a prospective. Agricultural and Forest Meteorology. 358, 110229, doi: 10.1016/j.agrformet.2024.110229. |
| [50] | Wang Z.Y., Zhou Y.F., Sun X.Y., et al., 2024c. Estimation of NPP in Huangshan District based on deep learning and CASA model. Forests. 15(8), 1467, doi: 10.3390/f15081467. |
| [51] | Wu X.M., Zhou T., Zeng J.Y., et al., 2025. Application of a Random Forest method to estimate the water use efficiency on the Qinghai Tibetan Plateau during the 1982-2018 growing season. Remote Sensing. 17(3), 527, doi: 10.3390/rs17030527. |
| [52] |
Xia L., Wang F., Mu X.M., et al., 2015. Water use efficiency of net primary production in global terrestrial ecosystems. Journal of Earth System Science. 124(5), 921-931.
doi: 10.1007/s12040-015-0587-4 |
| [53] | Xiao B.Q., Bai X.Y., Zhao C.W., et al., 2023. Responses of carbon and water use efficiencies to climate and land use changes in China’s karst areas. Journal of Hydrology. 617, 128968, doi: 10.1016/j.jhydrol.2022.128968. |
| [54] | Xie X.H., Liang S.L., Yao Y.J., et al., 2015. Detection and attribution of changes in hydrological cycle over the Three-North region of China: Climate change versus afforestation effect. Agricultural and Forest Meteorology. 203, 74-87. |
| [55] | Xu H.J., Wang X.P., Yang T.B., 2017. Trend shifts in satellite-derived vegetation growth in Central Eurasia, 1982-2013. Science of The Total Environment. 579, 1658-1674. |
| [56] | Xu H.J., Wang X.P., Zhao C.Y., 2021. Drought sensitivity of vegetation photosynthesis along the aridity gradient in northern China. International Journal of Applied Earth Observation and Geoinformation. 102, 102418, doi: 10.1016/j.jag.2021.102418. |
| [57] | Xu Z., Tian Y., Liu Z.W., et al., 2023. Comprehensive effects of atmosphere and soil drying on stomatal behavior of different plant types. Water. 15(9), 1675, doi: 10.3390/w15091675. |
| [58] | Yan Y.C., Liu X.P., Ou J.P., et al., 2018. Assimilating multi-source remotely sensed data into a light use efficiency model for net primary productivity estimation. International Journal of Applied Earth Observation and Geoinformation. 72, 11-25. |
| [59] | Yang J., Zhang X.C., Luo Z.H., et al., 2017. Nonlinear variations of net primary productivity and its relationship with climate and vegetation phenology, China. Forests. 8(10), 361, doi: 10.3390/f8100361. |
| [60] | Yin J.B., Gentine P., Slater L., et al., 2023. Future socio-ecosystem productivity threatened by compound drought-heatwave events. Nature Sustainability. 6, 259-272. |
| [61] | Yuan F.H., Liu J.Z., Zuo Y.J., et al., 2020. Rising vegetation activity dominates growing water use efficiency in the Asian permafrost region from 1900 to 2100. Science of The Total Environment. 736, 139587, doi: 10.1016/j.scitotenv.2020.139587. |
| [62] | Zhang M., Wang J.M., Li S.J., 2019. Tempo-spatial changes and main anthropogenic influence factors of vegetation fractional coverage in a large-scale opencast coal mine area from 1992 to 2015. Journal of Cleaner Production. 232, 940-952. |
| [63] | Zhang Q.A., Chen W., 2021. Ecosystem water use efficiency in the Three-North Region of China based on long-term satellite data. Sustainability. 13(14), 7977, doi: 10.3390/su13147977. |
| [64] | Zhu W.Q., Pan Y.Z., He H., et al., 2006. Simulation of maximum light use efficiency for some typical vegetation types in China. Chinese Science Bulletin. 51, 457-463. |
| [1] | Majid GULAYOZOV, CHEN Xi, Mustafo SAFAROV, LIU Tie, Ali R FAZYLOV, Hofiz NAVRUZSHOEV. Hydroclimatic and cryospheric changes in the eastern Pamir Plateau, Tajikistan: A 31-a remote sensing assessment of Yashilkul Lake [J]. Regional Sustainability, 2026, 7(2): 100329-. |
| [2] | Sourakanti SARKAR, Aishi MUKHERJEE, Auindrila BISWAS, Subrata GORAIN, Bimal BERA, Anmol GIRI, Malini ROY CHOUDHURY, Suman DUTTA, Sumanta DAS. Evaluating farmers’ strategies and socioeconomic drivers for adaptation to climate uncertainty: A case study in the Himalayan region of West Bengal, India [J]. Regional Sustainability, 2026, 7(2): 100334-. |
| [3] | CHEN Yaning, FANG Gonghuan, LI Zhi, ZHANG Xueqi, LI Weihong, Nekruz GULAHMADOV, Farhod NASRULLOEV, Aminjon GULAKHMADOV. Water resources and sustainable management in Tajikistan under global change [J]. Regional Sustainability, 2026, 7(1): 100291-. |
| [4] | Kobiljon Khushvakht KHUSHVAKHTZODA, Ilkhom Burkhonovich MAKHSUMOV, Muzaffar Boynazarovich KHOLNAZAROV, Irina Mikhailovna KIRPICHNIKOVA. Impact of green energy development on climate change mitigation [J]. Regional Sustainability, 2026, 7(1): 100292-. |
| [5] | Hikmat HISORIEV, LI Yaoming, HUANG Wenjun, FAN Lianlian, Mekhrovar OKHONNIYOZOV, MA Xuexi. Grassland ecosystems of Tajikistan: Plant species diversity, ecological restoration, and sustainable management [J]. Regional Sustainability, 2026, 7(1): 100293-. |
| [6] | Ranna HAZIHAN, DU Hongru, HE Chuanchuan, Kobiljon Khushvakht KHUSHVAKHTZODA, Bobozoda KOMIL. Coupling dynamics of SDGs in Tajikistan from 2001 to 2023 [J]. Regional Sustainability, 2026, 7(1): 100295-. |
| [7] | XU Chunhai, LI Zhongqin, HE Zhonghua, WANG Feiteng, MU Jianxin, CHEN Yaning, Sheralizoda NAZRIALO, Farhod NASRULLOEV, Aminjon GULAHMADZODA. Current status and recent changes of glaciers in Tajikistan [J]. Regional Sustainability, 2026, 7(1): 100296-. |
| [8] | LI Chunlan, YU Yang, SUN Lingxiao, HE Jing, LU Yuanbo, GUO Zengkun, FANG Gonghuan, Alexandr ULMAN, Vitaliy SALNIKOV, Ireneusz MALIK, Małgorzata WISTUBA. Spatiotemporal heterogeneity of runoff in Tajikistan and its driving mechanisms under climate change [J]. Regional Sustainability, 2026, 7(1): 100297-. |
| [9] | LI Yupeng, CHEN Yaning, WANG Fei, ZHANG Xiang, ZHANG Qifei, SUN Fan, FANG Gonghuan, Safarkhon SHAROFIDDINOV, Jafar NIYAZOV. Risks of snow drought and impacts on streamflow in Tajikistan [J]. Regional Sustainability, 2026, 7(1): 100298-. |
| [10] | Nasrulloev FARHOD, CHEN Yaning, Sheralizoda NAZRIALO, Gulahmadov NEKRUZ, Shobairi SEYED OMID REZA, Murodov MURODKHUJA. Hydrological change trends of the Surkhob and Khingov river basins in the Vakhsh River of Tajikistan under climate change [J]. Regional Sustainability, 2026, 7(1): 100300-. |
| [11] | Mahalingam Santhosh KUMAR, Narasimabhrathi Venkatesa PALANICHAMY, K. M. SHIVAKUMAR, Mani CHANDRAKUMAR, Muthuswamy KALPANA, Dhandapani MURUGANANTHI. Impact of climate change on global economy: A comprehensive review [J]. Regional Sustainability, 2025, 6(6): 100274-. |
| [12] | Yadeta BEDASA, Adeba GEMECHU, Amsalu BEDEMO. Combined adoption decisions of climate-smart agriculture and their impacts on maize yield in western Ethiopia [J]. Regional Sustainability, 2025, 6(6): 100280-. |
| [13] | Md Tauhid Ur RAHMAN, Adnan KHAIRULLAH. Integrating farmers’ perceptions and empirical climate data to assess agricultural productivity and food security in coastal Bangladesh [J]. Regional Sustainability, 2025, 6(5): 100259-. |
| [14] | Piyali KUMAR. Examining the effects of climatic and non-climatic factors on sectoral growth: Evidence from different country income groups [J]. Regional Sustainability, 2025, 6(5): 100261-. |
| [15] | Saira SHAFIQ, Muhammad ZIA UL HAQ, Syed Abbas RAZA NAQVI, Wardha SARFARAZ, Hina ALI, Muhammad Majid ISLAM, Gul Zaib HASSAN, Muhammad NAWAZ, Tasawer ABBAS. Integrating neglected and underutilized crops (NUCs) in South Asian cropping systems and diets: Challenges and prospects [J]. Regional Sustainability, 2025, 6(4): 100242-. |
| Viewed | ||||||
|
Full text |
|
|||||
|
Abstract |
|
|||||
 REGSUS Wechat
 新公网安备 65010402001202号