Regional Sustainability ›› 2026, Vol. 7 ›› Issue (1): 100299.doi: 10.1016/j.regsus.2026.100299
• Full Length Article • Previous Articles Next Articles
JIA Wenjuna, CHEN Ningshenga,*( ), XUE Yanga, WANG Zhihana, WEN Taoa, GUO Rub, Safaralizoda NOSIRc, Aminjon GULAKHMADOVd
Received:2025-10-09
Revised:2025-12-22
Accepted:2026-01-05
Published:2026-02-28
Online:2026-01-21
Contact:
CHEN Ningsheng
E-mail:chennsh@yangtzeu.edu.cn
JIA Wenjun, CHEN Ningsheng, XUE Yang, WANG Zhihan, WEN Tao, GUO Ru, Safaralizoda NOSIR, Aminjon GULAKHMADOV. Spatial differentiation and risk zonation of debris flow hazards in Tajikistan[J]. Regional Sustainability, 2026, 7(1): 100299.
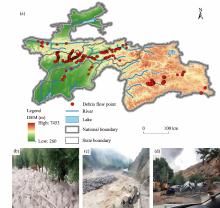
Fig. 1.
Overview of debris flow disasters in Tajikistan. (a), study area and distribution of debris flow points; (b), gravel deposited around tree trunks following a debris flow; (c), road destroyed by the debris flow; (d), trees and vehicles destroyed by the debris flow. DEM, digital elevation model. Note that the national boundary and state boundary were obtained from the Global Administrative Areas (GADM) database version 4.2 (http://www.gadm.org/), which provides generalized boundaries and does not explicitly represent disputed or undetermined borders. The boundary of the standard map used in this study has not been modified."

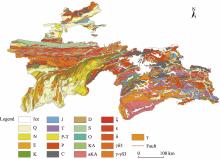
Fig. 2.
Geological map of Tajikistan. Stratigraphic units are categorized as follows: Q (Quaternary): unconsolidated deposits mainly composed of mud, clay, sand, gravel, alluvium, and silt; N (Neogene): sandstone, conglomerate, and clay; E (Paleogene): variegated clays, sandstone, siltstone, dolomite, gypsum, conglomerate, and limestone; K (Cretaceous): redstone, siltstone, clay, conglomerates, and limestone; J (Jurassic): limestone, sandstone, silt, gypsum, and siltstone; T (Triassic): variegated sandstones, conglomerate, and siltstone; P-T (Permian-Triassic): limestone, sandstone, siltstone, and conglomerate; P (Permian): limestone, sandstone, tuff, slate, diabase, and marl; C (Carboniferous): limestone, slate, siltstone, sandstone, dacite, diabase, tuff, and andesite; D (Devonian): dolomite, limestone, slate, and chert; S (Silurian): slate, limestone, dolomite, diabase, and porphyrite; O (Ordovician): slate, sandstone, and siltstone; KA (Cambrian): slate, limestone, siltstone, and sandstone; aKA (Precambrian): quartzite, feldspathic quartzite, and sericite; ξ: monzogranite; ε: ultrabasic complex; δ: diorite; γδ3: granodiorite; γ-γδ3: granodiorite-granite; γ, granodiorite."

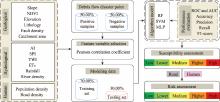
Fig. 3.
Flow chart of this study. NDVI, Normalized Difference Vegetation Index; AI, Aridity Index; SPI, Stream Power Index; TWI, Topographic Wetness Index; ET0, potential evapotranspiration; RF, Random Forest; SVM, Support Vector Machine; MLP, Multi-layer Perceptron; ROC, Receiver Operating Characteristic; AUC, Area under the ROC curve; F1-score, harmonic mean of precision and recall."
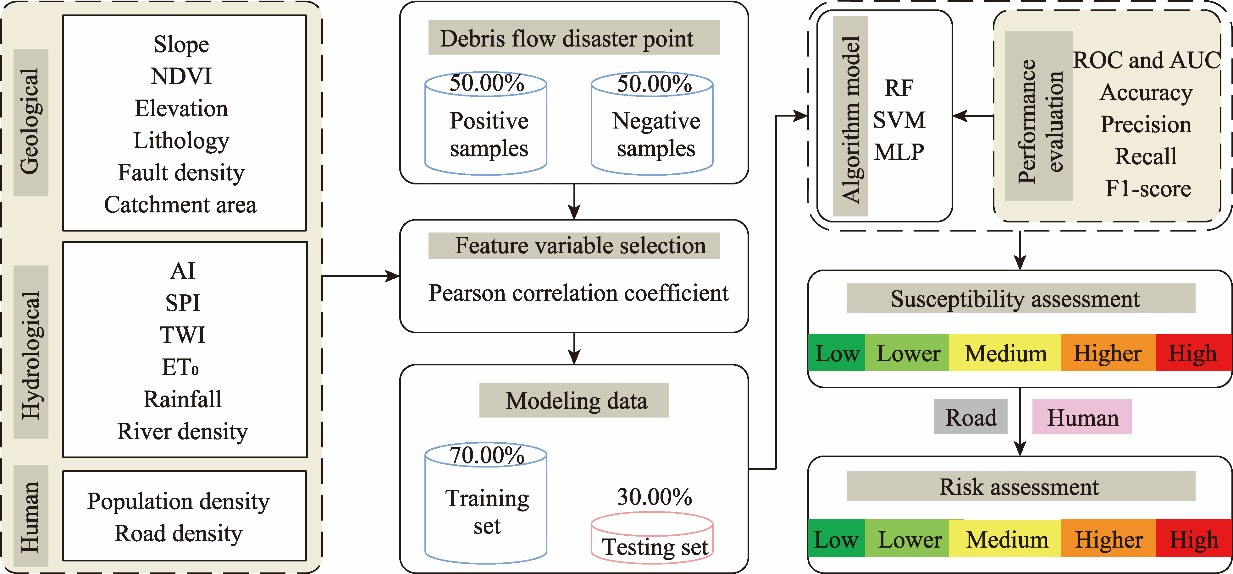
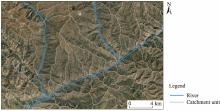
Fig. 4.
Catchment units with an area larger than 1 km2 extracted via Geographic Information System (GIS) platform."
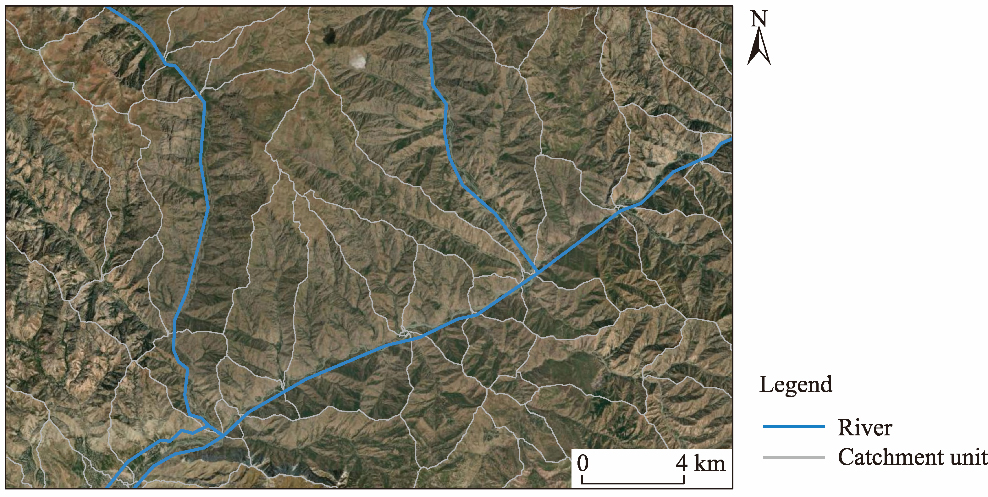
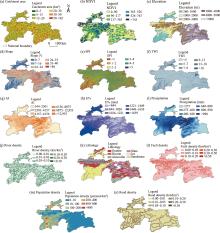
Fig. 5.
Spatial distribution of debris flow influencing factors. (a), catchment area; (b), NDVI; (c), elevation; (d), slope; (e), SPI; (f), TWI; (g), AI; (h), ET0; (i), precipitation; (j), river density; (k), lithology; (l), fault density; (m), population density; (n), road density. Note that the national boundary and state boundary were obtained from the GADM database version 4.2 (http://www.gadm.org/), which provides generalized boundaries and does not explicitly represent disputed or undetermined borders. The boundary of the standard map used in this study has not been modified."

Table 1
Characteristic variables selected in this study."
| Factor type | Factor name | Effect on debris flow activity | Data source |
|---|---|---|---|
| Geological factor | Elevation (m) | Mountainous terrain supplies abundant loose material and features steep slopes, thereby elevating the probability of debris flow occurrence. | Elevation was extracted from the 30 m resolution digital elevation model (DEM) provided by United States Geological Survey (USGS) ( |
| Slope (°) | Steeper slopes enhance gravity-driven mass movement, leading to slope instability and rapid downslope sliding. | Calculated from DEM in ArcGIS software (version 10.8; Esri, Inc., Redlands, the USA) | |
| Normalized Difference Vegetation Index (NDVI) | The NDVI reflects vegetation coverage. | Li et al. ( | |
| Lithology | Loose deposits or weak rocks are easily eroded by rainfall, providing abundant source materials for debris flows. | 1:150,000 geological map (Academy of Sciences of the Tajik SSR, | |
| Fault density (km/km2) | Faults influence the degree of bedrock fragmentation. For linear variables, fault density indicates the total fault length per unit area (Huang et al., | Calculated from 1:150,000 geological map of Tajikistan (Academy of Sciences of the Tajik SSR, | |
| Climatic and hydrological factor | Precipitation (mm) | Precipitation denotes the total cumulative precipitation in 2024. | WorldClim ( |
| River density (km/km2) | Dense river networks facilitate runoff concentration and may erode gully toes, triggering debris flows. | National Earth System Science Data Center ( | |
| Aridity Index (AI) | The AI is an indicator of climatic dryness, defined as the ratio of water loss to water supply. Arid conditions can cause surface cracking, enhance rainfall infiltration into slopes, and promote debris flow initiation. | Figshare ( | |
| Potential evapotranspiration (ET0; mm) | The ET0 affects soil moisture and vegetation growth; areas with lower ET0 are more likely to retain higher water content. | Figshare ( | |
| Stream Power Index (SPI) | The SPI reflects the erosive power of flowing water, calculated as: where α is the upslope contributing area (m2); and β is the slope (°). | Calculated from DEM in ArcGIS software | |
| Topographic Wetness Index (TWI) | The TWI characterizes soil moisture conditions in a catchment, calculated as: | Calculated from DEM in ArcGIS software | |
| Human activities | Population density (persons/km2) | Concentrated human activities may disturb slope stability and increase debris flow risk. | WorldPop Hub ( |
| Road density (km/km2) | Road construction and excavation may weaken slope structure, alter drainage pathways, and enhance debris flow hazards. | National Earth System Science Data Center ( | |
| Catchment area (km2) | Catchment area serves as the evaluation unit for debris flows. | Calculated from DEM in ArcGIS software | |
Table 2
Statistics of hyper-parameter adjustment range."
| Model | Hyper-parameter | Range | Step |
|---|---|---|---|
| Random Forest (RF) | n_estimators | 30.00000-800.00000 | 1.00000 |
| max_depth | 10.00000-60.00000 | 1.00000 | |
| max_features | 10.00000-60.00000 | 1.00000 | |
| min_impurity_decrease | 0.00000-5.00000 | 0.10000 | |
| Supporting Vector Machine (SVM) | kenel | ‘rbf’ | - |
| degree | 500.00000-2000.00000 | 1.00000 | |
| gamma | 0.00100-0.30000 | 0.00001 | |
| coef0 | 10.00000-30.00000 | 0.10000 | |
| tol | 0.05000-0.30000 | 0.00100 | |
| C | 10.00000-40.00000 | 0.01000 | |
| Multi-layer Perceptron (MLP) | hidden_layer_sizes | 10.00000-200.00000 | 1.00000 |
| max_iter | 500.00000-2000.00000 | 10.0000 | |
| alpha | 0.00010-0.70000 | 0.00010 | |
| learning_rate | 0.00010-0.65000 | 0.00010 |
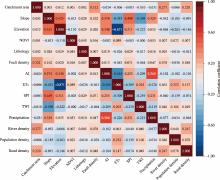
Fig. 6.
Pearson correlation between characteristic variables."
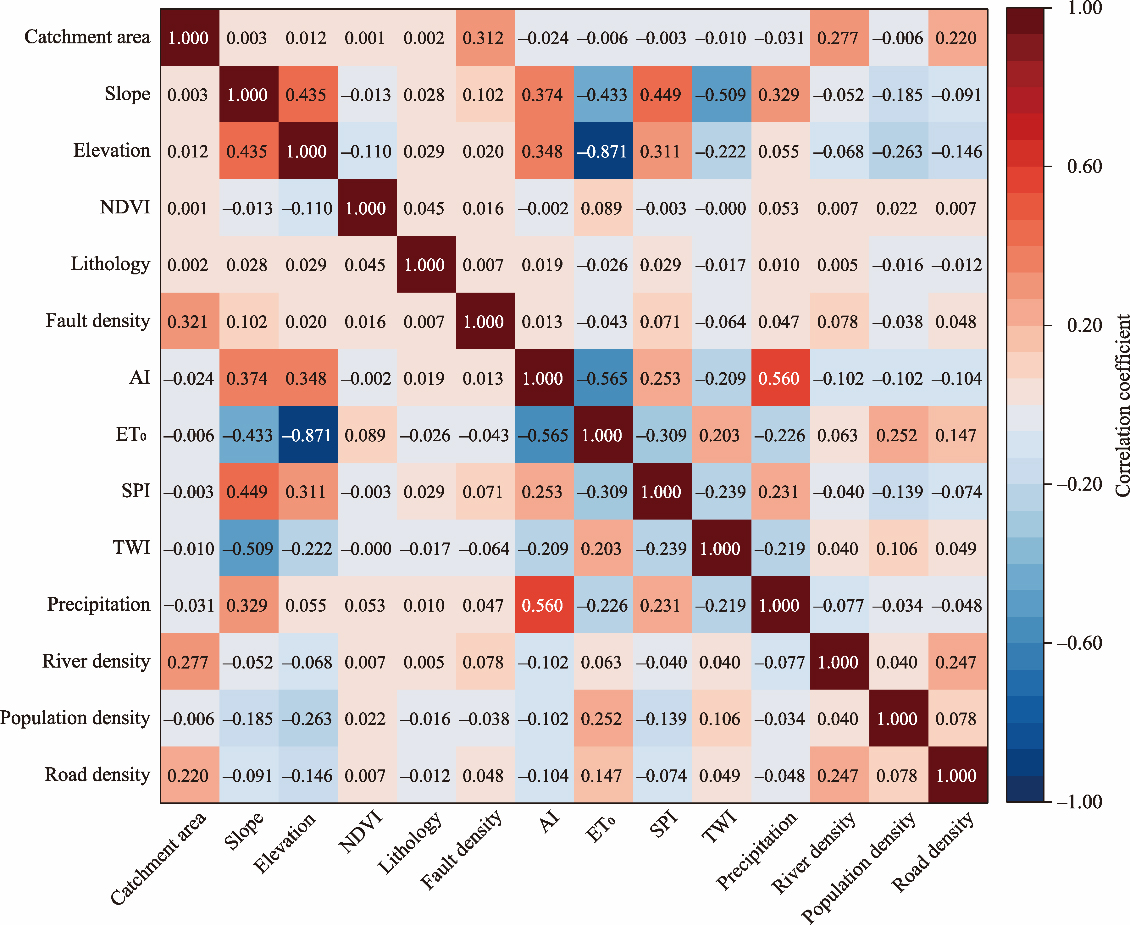
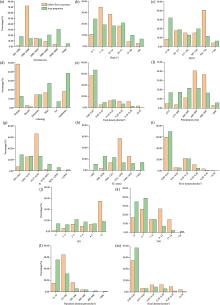
Fig. 7.
Distribution of debris flow occurrence and area proportion across different environmental factors. (a), elevation; (b), slope; (c), NDVI; (d), lithology; (e), fault density; (f), precipitation; (g), AI; (h), ET0; (i), river density; (j), SPI; (k), TWI; (l), population density; (m), road density."

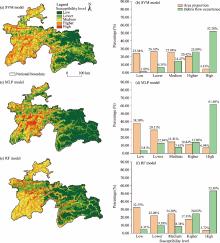
Fig. 8.
Debris flow susceptibility assessment based on three machine learning algorithms. (a, c, and e), spatial distribution of debris flow susceptibility based on SVM model, MLP model, and RF model, respectively; (b, d, and f), comparison between area proportion and debris flow occurrence across different susceptibility levels based on SVM model, MLP model, and RF model, respectively. Note that the national boundary and state boundary were obtained from the GADM database version 4.2 (http://www.gadm.org/), which provides generalized boundaries and does not explicitly represent disputed or undetermined borders. The boundary of the standard map used in this study has not been modified."
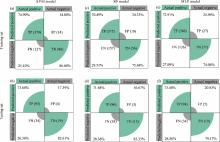
Fig. 9.
Confusion matrices of the three machine-learning models. (a and b), training set and testing set in SVM model, respectively; (c and d), training set and testing set in RF model, respectively; (e and f), training set and testing set in MLP model, respectively. TP (true positive), the number of debris flow samples correctly predicted as debris flows; TN (true negative), the number of non-debris flow samples correctly predicted as non-debris flows; FP (false positive), the number of non-debris flow samples incorrectly predicted as debris flows; FN (false negative), the number of debris flow samples incorrectly predicted as non-debris flows. The percentages in each column were normalized by the total number of actual samples per class (column-wise proportions). These values indicate the model’s sensitivity (true positive rate) in the first column and specificity (true negative rate) in the second column."
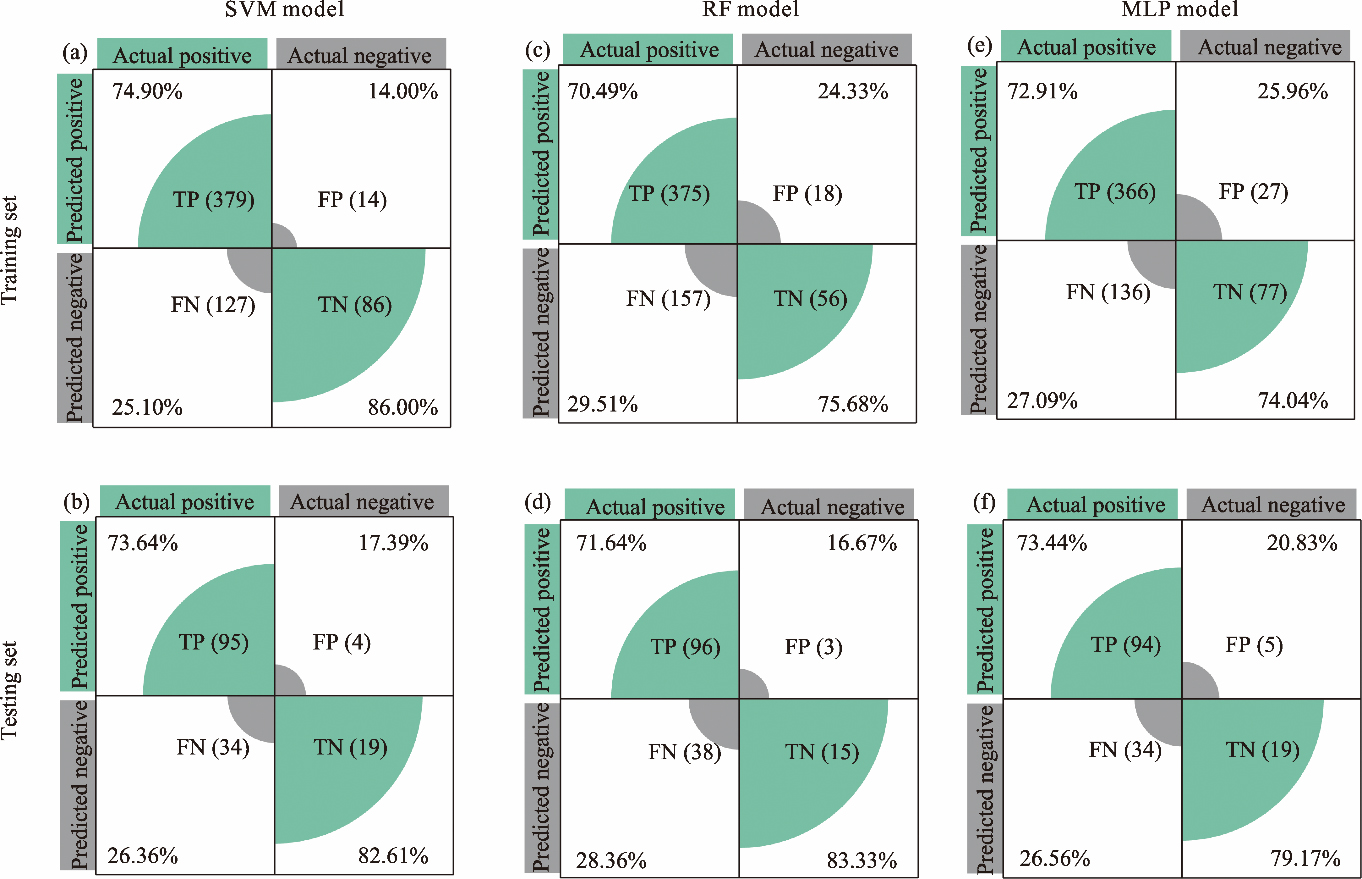
Table 3
Static validation of confusion matrix on three models."
| Model | Set | Accuracy | Precision | Recall | F1-score |
|---|---|---|---|---|---|
| MLP | Training set | 0.73102 | 0.74038 | 0.36150 | 0.48579 |
| Testing set | 0.74342 | 0.79167 | 0.35849 | 0.49351 | |
| SVM | Training set | 0.76733 | 0.86000 | 0.40376 | 0.51952 |
| Testing set | 0.75000 | 0.82609 | 0.35849 | 0.50000 | |
| RF | Training set | 0.71122 | 0.75676 | 0.26291 | 0.39024 |
| Testing set | 0.73026 | 0.83333 | 0.28320 | 0.42253 |
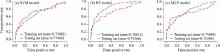
Fig. 10.
Receiver Operating Characteristic (ROC) curve of three models. (a), SVM model; (b), RF model; (c), MLP model."
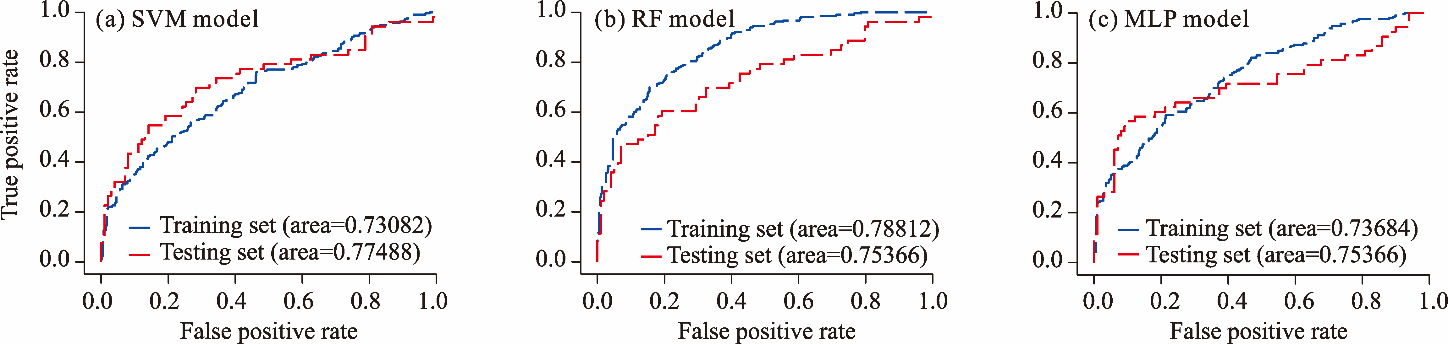
Table 4
Comparison of model performance using DeLong’s test and Bootstrap permutation test."
| Model comparison | Set | P-value (from DeLong’s test) | 95.00% CI (from Bootstrap permutation test) |
|---|---|---|---|
| SVM vs. MLP | Training set | <0.001 | (0.43019, 0.46114) |
| SVM vs. MLP | Testing set | <0.001 | (0.13491, 0.21950) |
| SVM vs. RF | Training set | 0.030 | (1.08170×10⁻⁶, 1.54030×10⁻⁵) |
| SVM vs. RF | Testing set | <0.001 | (0.07010, 0.13108) |
| MLP vs. RF | Training set | <0.001 | (-0.46115, -0.43019) |
| MLP vs. RF | Testing set | <0.001 | (-0.31723, -0.23814) |
Table 5
Risk assessment matrix integrating debris flow susceptibility and exposed element categories."
| Exposed element | ||||||
|---|---|---|---|---|---|---|
| 1 | 2 | 3 | 4 | 5 | ||
| Susceptibility | 1 | Low | Low | Lower | Medium | Medium |
| 2 | Low | Lower | Medium | Medium | Higher | |
| 3 | Lower | Medium | Medium | Higher | Higher | |
| 4 | Medium | Medium | Higher | Higher | High | |
| 5 | Medium | Higher | Higher | High | High | |
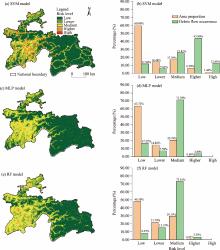
Fig. 11.
Debris flow hazard risk based on population density. (a, c, and e), risk zoning based on population density in SVM model, MLP model, and RF model, respectively; (b, d, and f), area proportion of different hazard levels and the corresponding distribution of historical debris flows in SVM model, MLP model, and RF model, respectively. Note that the national boundary and state boundary were obtained from the GADM database version 4.2 (http://www.gadm.org/), which provides generalized boundaries and does not explicitly represent disputed or undetermined borders. The boundary of the standard map used in this study has not been modified."

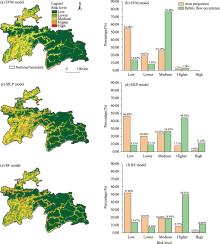
Fig. 12.
Debris flow hazard risk based on road density. (a, c, and e), risk zoning based on road density in SVM model, MLP model, and RF model, respectively; (b, d, and f), area proportion of different hazard levels and the corresponding distribution of historical debris flows in SVM model, MLP model, and RF model, respectively. Note that the national boundary and state boundary were obtained from the GADM database version 4.2 (http://www.gadm.org/), which provides generalized boundaries and does not explicitly represent disputed or undetermined borders. The boundary of the standard map used in this study has not been modified."

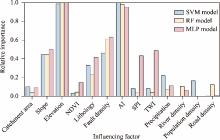
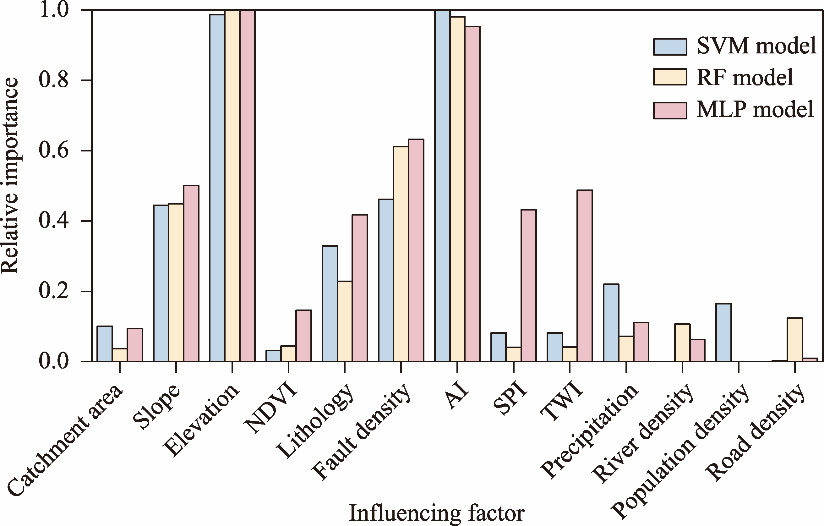
Fig. 13.
Relative importance of the characteristic variables."
| [1] | Academy of Sciences of the Tajik SSR (Soviet Socialist Republic), 1968. Atlas of the Tajik Soviet Socialist Republic. Dushanbe: Main Administration of Geodesy and Cartography (GUGK) (in Russian). |
| [2] | Angillieri M.Y.E., 2020. Debris flow susceptibility mapping using frequency ratio and seed cells, in a portion of a mountain international route, dry Central Andes of Argentina. CATENA. 189, 104504, doi: 10.1016/j.catena.2020.104504. |
| [3] | Baggio T., Martini M., Bettella F., et al., 2024. Debris flow and debris flood hazard assessment in mountain catchments. CATENA. 245, 108338, doi: 10.1016/j.catena.2024.108338. |
| [4] |
Bregoli F., Medina V., Chevalier G., et al., 2015. Debris-flow susceptibility assessment at regional scale: Validation on an alpine environment. Landslides. 12, 437-454.
doi: 10.1007/s10346-014-0493-x |
| [5] |
Carrara A., Crosta G., Frattini P., 2008. Comparing models of debris-flow susceptibility in the alpine environment. Geomorphology. 94(3-4), 353-378.
doi: 10.1016/j.geomorph.2006.10.033 |
| [6] | Chen H.Y., Ruan H.C., Chen J.G., et al., 2022. Review of investigations on hazard chains triggered by river-blocking debris flows and dam-break floods. Frontiers in Earth Science. 10, 83004, doi: 10.3389/feart.2022.830044. |
| [7] |
Chen N.S., Zhang Y., Tian S.F., et al., 2020a. Effectiveness analysis of the prediction of regional debris flow susceptibility in post-earthquake and drought site. Journal of Mountain Science. 17(2), 329-339.
doi: 10.1007/s11629-019-5684-4 |
| [8] |
Chen X.Z., Chen H., You Y., et al., 2015. Susceptibility assessment of debris flows using the analytic hierarchy process method - A case study in Subao river valley, China. Journal of Rock Mechanics and Geotechnical Engineering. 7(4), 404-410.
doi: 10.1016/j.jrmge.2015.04.003 |
| [9] | Chen Y., Qin S.W., Qiao S.S., et al., 2020b. Spatial predictions of debris flow susceptibility mapping using convolutional neural networks in Jilin Province, China. Water. 12(8), 2079, doi: 10.3390/w12082079. |
| [10] | Demler O.V., Pencina M.J., D’Agostino Sr. R.B., et al., 2012. Misuse of DeLong test to compare AUCs for nested models. Statistics in Medicine. 31(23), 2577-2587. |
| [11] |
Dikshit A., Pradhan B., Alamri A.M., 2021. Pathways and challenges of the application of artificial intelligence to geohazards modelling. Gondwana Research. 100, 290-301.
doi: 10.1016/j.gr.2020.08.007 |
| [12] |
Erokhin S.A., Zaginaev V.V., Meleshko A.A., et al., 2018. Debris flows triggered from non-stationary glacier lake outbursts: the case of the Teztor Lake complex (Northern Tian Shan, Kyrgyzstan). Landslides. 15(1), 83-98.
doi: 10.1007/s10346-017-0862-3 |
| [13] |
Handwerger A.L., Huang M.H., Fielding E.J., et al., 2019. A shift from drought to extreme rainfall drives a stable landslide to catastrophic failure. Scientific Reports. 9(1), 1569, doi: 10.1038/s41598-018-38300-0.
pmid: 30733588 |
| [14] | Horton P., Jaboyedoff M., Rudaz B., et al., 2013. Flow-R, a model for susceptibility mapping of debris flows and other gravitational hazards at a regional scale. Natural Hazards and Earth System Sciences. 13(4), 869-885. |
| [15] | Hu G.S., Shang Y.J., Zeng Q.L., et al., 2017. The emergency scientific investigation of catastrophic debris flow in Yecheng County of Xinjiang on July 6th, 2016. Mountain Research. 35(1), 112-116. |
| [16] | Hu G.S., Zhao C.Y., Chen N.S., et al., 2019. Characteristics, mechanisms and prevention modes of debris flows in an arid seismically active region along the Sichuan-Tibet railway route, China: a case study of the Basu-Ranwu section, southeastern Tibet. Environmental Earth Sciences. 78(18), 564, doi: 10.1007/s12665-019-8554-z. |
| [17] | Huang F.M., Pan L.H., Fan X.M., et al., 2022a. The uncertainty of landslide susceptibility prediction modeling: suitability of linear conditioning factors. Bulletin of Engineering Geology and the Environment. 81, 182, doi: 10.1007/s10064-022-02672-5. |
| [18] | Huang H., Wang Y.S., Li Y.M., et al., 2022b. Debris-flow susceptibility assessment in China: A comparison between traditional statistical and machine learning methods. Remote Sensing. 14(18), 4475, doi: 10.3390/rs14184475. |
| [19] |
Ilia I., Tsangaratos P., 2016. Applying weight of evidence method and sensitivity analysis to produce a landslide susceptibility map. Landslides. 13(2), 379-397.
doi: 10.1007/s10346-015-0576-3 |
| [20] | Janssen A., Pauls T., 2003. How do bootstrap and permutation tests work? The Annals of Statistics. 31(3), 768-806. |
| [21] | Kappes M.S., Malet J.P., Remaître A., et al., 2011. Assessment of debris-flow susceptibility at medium-scale in the Barcelonnette Basin, France. Natural Hazards and Earth System Sciences. 11(2), 627-641. |
| [22] | Leinss S., Bernardini E., Jacquemart M., et al., 2021. Glacier detachments and rock-ice avalanches in the Petra Pervogo range, Tajikistan (1973-2019). Natural Hazards and Earth System Sciences. 21(5), 1409-1429. |
| [23] | Li C.J., Hu Y.X., Fan G., et al., 2024. Exploring debris flow deposit morphology in river valleys: Insights from physical modeling experiments. Engineering Geology. 332, 107465, doi: 10.1016/j.enggeo.2024.107465. |
| [24] | Li M.Y., Cao S., Zhu Z.C., et al., 2023. Spatiotemporally Consistent Global Dataset of the GIMMS Normalized Difference Vegetation Index (PKU GIMMS NDVI) from 1982 to 2022 (V1.2). [2025-08-30]. https://doi.org/10.5281/zenodo.8253971. |
| [25] |
Li W.C., Li H.J., Dai F.C., et al., 2012. Discrete element modeling of a rainfall-induced flowslide. Engineering Geology. 149-150, 22-34.
doi: 10.1016/j.enggeo.2012.08.006 |
| [26] | Lin Y., Guo Z.H., Meng Q.B., et al., 2025. Prediction of peak strength under triaxial compression for sandstone based on ABC-SVM algorithm. Expert Systems with Applications. 264, 125923, doi: 10.1016/j.eswa.2024.125923. |
| [27] |
Liu M., Zhang Y., Tian S.F., et al., 2020. Effects of loose deposits on debris flow processes in the Aizi Valley, southwest China. Journal of Mountain Science. 17(1), 156-172.
doi: 10.1007/s11629-019-5388-9 |
| [28] | Ma T.X., Lin Y., Zhou X.B., et al., 2022. Grading evaluation of goaf stability based on entropy and normal cloud model. Advances in Civil Engineering. 2022(1), 9600909, doi: 10.1155/2022/9600909. |
| [29] | Meng D.B., Yang S.Y., De Jesus A.M.P., et al., 2023. A novel hybrid adaptive Kriging and water cycle algorithm for reliability-based design and optimization strategy: Application in offshore wind turbine monopile. Computer Methods in Applied Mechanics and Engineering. 412, 116083, doi: 10.1016/j.cma.2023.116083. |
| [30] | Meng D.B., Yang S.Y., Yang H.F., et al., 2024. Intelligent-inspired framework for fatigue reliability evaluation of offshore wind turbine support structures under hybrid uncertainty. Ocean Engineering. 307, 118213, doi: 10.1016/j.oceaneng.2024.118213. |
| [31] | Meng D.B., Zhu S.P., 2024. Multidisciplinary Design Optimization of Complex Structures Under Uncertainty. Boca Raton: CRC Press. |
| [32] | Naef D., Rickenmann D., Rutschmann P., et al., 2006. Comparison of flow resistance relations for debris flows using a one-dimensional finite element simulation model. Natural Hazards and Earth System Sciences. 6(1), 155-165. |
| [33] |
Nyman P., Rutherfurd I.D., Lane P.N.J., et al., 2019. Debris flows in southeast Australia linked to drought, wildfire, and the El Niño-Southern Oscillation. Geology. 47(5), 491-494.
doi: 10.1130/G45939.1 |
| [34] | Podgórski J., Pętlicki M., Fernández A., et al., 2023. Evaluating the impact of the Central Chile mega drought on debris cover, broadband albedo, and surface drainage system of a dry Andes glacier. Science of The Total Environment. 905, 166907, doi: 10.1016/j.scitotenv.2023.166907. |
| [35] |
Ren D.D., Leslie L.M., 2020. Climate warming enhancement of catastrophic southern California debris flows. Scientific Reports. 10(1), 10507, doi: 10.1038/s41598-020-67511-7.
pmid: 32601392 |
| [36] | Rogelis M.C., Werner M., 2014. Regional debris flow susceptibility analysis in mountainous peri-urban areas through morphometric and land cover indicators. Natural Hazards and Earth System Sciences. 14(11), 3043-3064. |
| [37] |
Safarov M., Kang S.C., Fazylov A., et al., 2025. Mapping the territories of the mountain-foothill zone of Tajikistan exposed to mudflows. Journal of Mountain Science. 22(1), 16-30.
doi: 10.1007/s11629-024-9020-2 |
| [38] | Shahgedanova M., Saidaliyeva Z., Mussina A., et al., 2024. Debris flows in the northern Tien Shan, Central Asia: regional database, meteorological triggers, and trends. npj Natural Hazards. 1, 49, doi: 10.1038/s44304-024-00050-7. |
| [39] |
Shen L.X., Ma T.X., Chen H., et al., 2025. A new CNN-GRU deep learning framework optimized by CHIO for precise prediction of debris flow velocity. Stochastic Environmental Research and Risk Assessment. 39(6), 2351-2371.
doi: 10.1007/s00477-025-02973-7 |
| [40] |
Shen W., Li T.L., Li P., et al., 2018. A modified finite difference model for the modeling of flowslides. Landslides. 15(8), 1577-1593.
doi: 10.1007/s10346-018-0980-6 |
| [41] |
Sorg A., Bolch T., Stoffel M., et al., 2012. Climate change impacts on glaciers and runoff in Tien Shan (Central Asia). Nature Climate Change. 2, 725-731.
doi: 10.1038/nclimate1592 |
| [42] |
Wang Y.F., Ma T.X., Shen L.X., et al., 2025. Prediction of thermal conductivity of natural rock materials using LLE-transformer-lightGBM model for geothermal energy applications. Energy Reports. 13, 2516-2530.
doi: 10.1016/j.egyr.2025.02.003 |
| [43] | Wei Z.L., Shang Y.Q., Liang Q.H., et al., 2024. A coupled hydrological and hydrodynamic modeling approach for estimating rainfall thresholds of debris-flow occurrence. Natural Hazards and Earth System Sciences. 24(10), 3357-3379. |
| [44] | Wilford D.J., Sakals M.E., Innes J.L., et al., 2004. Recognition of debris flow, debris flood and flood hazard through watershed morphometrics. Landslides. 1(1), 61-66. |
| [45] | Xie S.J., Lin H., Duan H.Y., et al., 2025a. A novel triaxial strength criterion for rocks based on the ultimate strength and its application. Geoenergy Science and Engineering. 246, 213590, doi: 10.1016/j.geoen.2024.213590. |
| [46] |
Xie S.J., Lin H., Ma T.X., et al., 2025b. Prediction of joint roughness coefficient via hybrid machine learning model combined with principal components analysis. Journal of Rock Mechanics and Geotechnical Engineering. 17(4), 2291-2306.
doi: 10.1016/j.jrmge.2024.05.059 |
| [47] | Xinhua News Agency, 2021. Eight People Died in a Debris Flow in Tajikistan. [2025-07-15]. https://www.xinhuanet.com/world/2021-05/12/c_1127438295.htm?baike (in Chinese). |
| [48] |
Xu W.B., Yu W.J., Jing S.C., et al., 2013. Debris flow susceptibility assessment by GIS and information value model in a large-scale region, Sichuan Province (China). Natural Hazards. 65(3), 1379-1392.
doi: 10.1007/s11069-012-0414-z |
| [49] | Yang C., Wang J., Zhang G.T., 2024. A novel framework for debris flow susceptibility assessment considering the uncertainty of sample selection. Geomatics, Natural Hazards and Risk. 15(1), 2425732, doi: 10.1080/19475705.2024.2425732. |
| [50] |
Yılmaz K., Dinçer A.E., Kalpakcı V., et al., 2023. Debris flow modelling and hazard assessment for a glacier area: a case study in Barsem Tajikistan. Natural Hazards. 115(3), 2577-2601.
doi: 10.1007/s11069-022-05654-8 |
| [51] | Zhang Y.H., Ge T.T., Tian W., et al., 2019. Debris flow susceptibility mapping using machine-learning techniques in Shigatse area, China. Remote Sensing. 11(23), 2801, doi: 10.3390/rs11232801. |
| [52] | Zhang Y.W., Chen J.P., Wang Q., et al., 2022. Geographic information system models with fuzzy logic for susceptibility maps of debris flow using multiple types of parameters: a case study in Pinggu District of Beijing, China. Natural Hazards and Earth System Sciences. 22(7), 2239-2255. |
| [53] |
Zhao H.J., Wei A.H., Ma F.S., et al., 2024. Comparison of debris flow susceptibility assessment methods: support vector machine, particle swarm optimization, and feature selection techniques. Journal of Mountain Science. 21(2), 397-412.
doi: 10.1007/s11629-023-8395-9 |
| [54] | Zhao Y., Meng X.M., Qi T.J., et al., 2021. Modeling the spatial distribution of debris flows and analysis of the controlling factors: A machine learning approach. Remote Sensing. 13(23), 4813, doi: 10.3390/rs13234813. |
| [55] |
Zhong Z., Chen N.S., Hu G.S., et al., 2021. Aggravation of debris flow disaster by extreme climate and engineering: a case study of the Tongzilin Gully, Southwestern Sichuan Province, China. Natural Hazards. 109(1), 237-253.
doi: 10.1007/s11069-021-04834-2 |
| [56] | Zhou W.T., Zou Q., Chen S.Y., et al., 2024. Extreme climate and human activities contribute to low-frequency, large-scale catastrophic debris flow: a case study in the Heishui Gully. Geomatics, Natural Hazards and Risk. 15(1), 2316719, doi: 10.1080/19475705.2024.2316719. |
| [1] | Nasrulloev FARHOD, CHEN Yaning, Sheralizoda NAZRIALO, Gulahmadov NEKRUZ, Shobairi SEYED OMID REZA, Murodov MURODKHUJA. Hydrological change trends of the Surkhob and Khingov river basins in the Vakhsh River of Tajikistan under climate change [J]. Regional Sustainability, 2026, 7(1): 100300-. |
| [2] | LI Yupeng, CHEN Yaning, WANG Fei, ZHANG Xiang, ZHANG Qifei, SUN Fan, FANG Gonghuan, Safarkhon SHAROFIDDINOV, Jafar NIYAZOV. Risks of snow drought and impacts on streamflow in Tajikistan [J]. Regional Sustainability, 2026, 7(1): 100298-. |
| [3] | CHEN Yaning, FANG Gonghuan, LI Zhi, ZHANG Xueqi, LI Weihong, Nekruz GULAHMADOV, Farhod NASRULLOEV, Aminjon GULAKHMADOV. Water resources and sustainable management in Tajikistan under global change [J]. Regional Sustainability, 2026, 7(1): 100291-. |
| [4] | Mahalingam Santhosh KUMAR, Narasimabhrathi Venkatesa PALANICHAMY, K. M. SHIVAKUMAR, Mani CHANDRAKUMAR, Muthuswamy KALPANA, Dhandapani MURUGANANTHI. Impact of climate change on global economy: A comprehensive review [J]. Regional Sustainability, 2025, 6(6): 100274-. |
| [5] | Md Maruf BILLAH, Mohammad Mahmudur RAHMAN, Santiago MAHIMAIRAJA, Alvin LAL, Asadi SRINIVASULU, Ravi NAIDU. Enhancing climate-smart coastal farming system through agriculture extension and advisory services towards the avenues of farm sustainability [J]. Regional Sustainability, 2025, 6(4): 100243-. |
| [6] | Osama AHMED, Mourad FAIZ, Laamari ABDELALI, Safwa KHOALI, Cataldo PULVENT, Sameh MOHAMED, Mame Samba MBAYE, Thomas GLAUBEN. Unlocking climate change resilience: Socioeconomic factors shaping smallholder farmers’ perceptions and adaptation strategies in Mediterranean and Sub-Saharan Africa regions [J]. Regional Sustainability, 2025, 6(1): 100195-. |
| [7] | Muhammad RENDANA, Wan Mohd Razi IDRIS, Febrinasti ALIA, Supli Effendi RAHIM, Muhammad YAMIN, Muhammad IZZUDIN. Relationship between drought and soil erosion based on the normalized differential water index (NDWI) and revised universal soil loss equation (RUSLE) model [J]. Regional Sustainability, 2024, 5(4): 100183-. |
| [8] | LI Guoyi, LIU Jiahong, SHAO Weiwei. Urban flood risk assessment under rapid urbanization in Zhengzhou City, China [J]. Regional Sustainability, 2023, 4(3): 332-348. |
| [9] | Sunil SAHA, Debabrata SARKAR, Prolay MONDAL. Assessing and mapping soil erosion risk zone in Ratlam District, central India [J]. Regional Sustainability, 2022, 3(4): 373-390. |
| [10] | Yuanming Zhang, Daoyuan Zhang, Wenjun Li, Yaoming Li, Chi Zhang, Kaiyun Guan, Borong Pan. Characteristics and utilization of plant diversity and resources in Central Asia [J]. Regional Sustainability, 2020, 1(1): 1-10. |
| Viewed | ||||||
|
Full text |
|
|||||
|
Abstract |
|
|||||
 REGSUS Wechat
 新公网安备 65010402001202号