Regional Sustainability ›› 2025, Vol. 6 ›› Issue (5): 100261.doi: 10.1016/j.regsus.2025.100261
• Research article • Previous Articles Next Articles
Piyali KUMAR*( )
)
Received:2024-06-26
Revised:2025-08-10
Accepted:2025-10-15
Published:2025-10-31
Online:2025-11-06
Contact:
* E-mail address: kumarpiyali92@gmail.com (Piyali KUMAR).Piyali KUMAR. Examining the effects of climatic and non-climatic factors on sectoral growth: Evidence from different country income groups[J]. Regional Sustainability, 2025, 6(5): 100261.
Table 1
List of the selected countries."
| Income group | Country |
|---|---|
| High-income countries | Japan, Canada, the USA, Poland, Finland, Sweden, Ireland, Singapore, Australia, Italy, Germany, Spain, France, Oman, Israel, South Korea, Slovakia, Norway, Slovenia, and Netherland |
| Upper-middle-income countries | Indonesia, Thailand, Turkey, China, Malaysia, Albania, Russia, Bulgaria, Brazil, Colombia, Paraguay, Ecuador, Botswana, and Gabon |
| Lower-middle-income countries | Bangladesh, India, Kyrgyzstan, Zambia, Honduras, Nigeria, Bolivia, Cameroon, Kenya, Morocco, Egypt, Congo Republic, Ukraine, and Philippines |
| Low-income countries | Yemen, Madagascar, Mozambique, Ethiopia, Niger, Chad, Central African Republic, and Liberia |
Table 2
Variable descriptions and data sources."
| Abbreviation | Variable | Measure and explanation | Unit | Source |
|---|---|---|---|---|
| AGR | Agricultural sector output | AGR refers to the share of gross domestic product (GDP) that corresponds to the total income generated through the production of goods and services in the agricultural, forestry, and fishing sectors. | % | https://data.worldbank.org.cn/ |
| IND | Industrial sector output | IND refers to the share of GDP that corresponds to the total income generated through the production of goods and services in the industrial sector (including construction). | % | |
| SER | Service sector output | SER refers to the share of GDP that corresponds to the total income generated through the production of services in the service sector. | % | |
| TEMP | Temperature | Annual average temperature | °C | |
| PREC | Precipitation | Average annual precipitation | mm | |
| FDI | Foreign direct investment | FDI refers to the ratio between the net inflows (new investment inflows minus disinvestment) from foreign investors and the GDP of the reporting economy. | % | |
| NC | Natural capital | NC refers to the share of GDP that comes from total natural resource rents, including oil, natural gas, coal, and mineral. | % | |
| HCI | Human capital index | HCI serves as a proxy for labor productivity based on educational attainment, which is reflected by the average years of schooling and returns to education. | - | https://www.rug.nl/ggdc/ |
| ICT | Information and communication technology | ICT reveals the share of the population that uses the internet via devices such as computers, mobile phones, personal digital assistants, games machines, and digital televisions, etc. | % | https://ourworldindata.org/ |
Table 3
Descriptive statistics of dependent and independent variables."
| Income group | Variable | Mean | Standard deviation | Maximum | Minimum |
|---|---|---|---|---|---|
| High-income countries | AGR (%) | 2.39 | 1.74 | 13.59 | 1.15 |
| IND (%) | 28.75 | 8.05 | 68.18 | 16.20 | |
| SER (%) | 61.10 | 8.78 | 123.04 | 32.89 | |
| TEMP (°C) | 11.47 | 7.84 | 28.02 | -4.66 | |
| PREC (mm) | 885.77 | 531.69 | 3001.26 | 42.39 | |
| PREC2 (mm) | 1,066,922.00 | 1,406,474.00 | 9,007,562.00 | 1796.91 | |
| FDI (%) | 3.86 | 7.77 | 86.47 | -36.14 | |
| HCI | 3.25 | 0.44 | 4.56 | 2.34 | |
| NC (%) | 2.77 | 7.82 | 50.48 | 0.00 | |
| ICT (%) | 45.53 | 37.62 | 111.00 | 0.00 | |
| Upper-middle-income countries | AGR (%) | 11.93 | 10.08 | 89.95 | 1.73 |
| IND (%) | 35.24 | 10.16 | 66.52 | 9.27 | |
| SER (%) | 47.59 | 8.98 | 73.33 | 11.79 | |
| TEMP (°C) | 18.62 | 8.98 | 27.23 | -4.86 | |
| PREC (mm) | 1477.06 | 871.22 | 3437.66 | 345.01 | |
| PREC2 (mm) | 2,939,334.00 | 2,915,942.00 | 11,800,000.00 | 119,031.90 | |
| FDI (%) | 2.53 | 2.89 | 31.22 | -6.89 | |
| HCI | 2.98 | 0.48 | 3.79 | 2.04 | |
| NC (%) | 6.59 | 8.24 | 47.76 | 0.14 | |
| ICT (%) | 24.05 | 26.66 | 96.75 | 0.00 | |
| Lower-middle-income countries | AGR (%) | 17.06 | 7.18 | 46.31 | 2.86 |
| IND (%) | 29.68 | 9.00 | 72.15 | 13.55 | |
| SER (%) | 47.10 | 7.50 | 61.41 | 21.45 | |
| TEMP (°C) | 21.34 | 6.84 | 27.53 | 1.73 | |
| PREC (mm) | 1205.07 | 729.46 | 2979.16 | 34.07 | |
| PREC2 (mm) | 1,983,335.00 | 1,990,405.00 | 8,875,394.00 | 1160.76 | |
| FDI (%) | 2.02 | 2.77 | 17.13 | -13.73 | |
| HCI | 2.13 | 0.53 | 3.69 | 1.20 | |
| NC (%) | 7.71 | 10.12 | 59.68 | 0.19 | |
| ICT (%) | 12.04 | 17.63 | 88.13 | 0.00 | |
| Low-income countries | AGR (%) | 33.39 | 11.51 | 63.83 | 8.16 |
| IND (%) | 21.25 | 10.70 | 52.79 | 2.85 | |
| SER (%) | 37.63 | 9.43 | 52.57 | 3.64 | |
| TEMP (°C) | 25.53 | 2.06 | 28.52 | 22.1 | |
| PREC (mm) | 746.05 | 526.74 | 1605.87 | 42.39 | |
| PREC2 (mm) | 833,008.90 | 824,358.50 | 2,578,818.00 | 1796.91 | |
| FDI (%) | 2.91 | 7.80 | 46.27 | -37.72 | |
| HCI | 1.35 | 0.24 | 1.96 | 1.02 | |
| NC (%) | 13.59 | 13.29 | 102.55 | -18.66 | |
| ICT (%) | 4.55 | 7.46 | 32.95 | 0.00 |
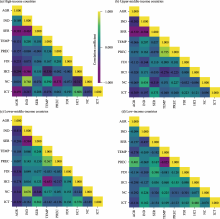
Fig. 1.
Correlation heatmap of variables for high-income countries (a), upper-middle-income countries (b), lower-middle-income countries (c), and low-income countries (d). AGR, agricultural sector output; IND, industrial sector output; SER, service sector output; TEMP, temperature; PREC, precipitation; FDI, foreign direct investment; HCI, human capital index; NC, natural capital; ICT, information and communication technology."

Table 4
Results of cross-sectional dependence (CSD) test."
| Equation | High-income countries | Upper-middle-income countries | Lower-middle-income countries | Low-income countries |
|---|---|---|---|---|
| Agricultural sector | 14.731*** | 17.158*** | 0.604* | 0.516** |
| Industrial sector | 4.822*** | 0.407* | 2.578*** | 1.604* |
| Service sector | 13.747*** | 3.273*** | 0.900* | 1.533** |
Table 5
Results of slope homogeneity test."
| Equation | High-income countries | Upper-middle-income countries | Lower-middle-income countries | Low-income countries | ||||
|---|---|---|---|---|---|---|---|---|
| ∆ | ∆adj | ∆ | ∆adj | ∆ | ∆adj | ∆ | ∆adj | |
| Agricultural sector | 22.281*** | 25.077*** | 16.678*** | 19.294*** | 15.112*** | 17.588*** | 13.276** | 15.253** |
| Industrial sector | 23.666*** | 26.636*** | 16.757*** | 19.386*** | 18.313*** | 21.313*** | 11.649*** | 13.383*** |
| Service sector | 14.919*** | 16.791*** | 14.442** | 16.707** | 17.204*** | 20.022*** | 14.324*** | 16.457*** |
Table 6
Summary of cross-sectionally augmented Im, Pesaran and Shin (CIPS) and cross-section augmented Dickey-Fuller (CADF) tests."
| Transfor-mation | Country group | Test | AGR | IND | SER | TEMP | PREC | PREC2 | FDI | HCI | NC | ICT |
|---|---|---|---|---|---|---|---|---|---|---|---|---|
| Level I(0) | High-income countries | CIPS | -2.822*** | -1.775 | -1.752 | -3.404*** | -0.709 | 0.010 | -3.868*** | -1.961 | -2.590*** | -2.928*** |
| CADF | -2.274*** | -1.632 | -1.477 | -2.677*** | -0.709 | 0.010 | -2.087* | -1.930 | -1.569 | -2.479*** | ||
| Upper-middle-income countries | CIPS | -2.950*** | -2.071 | -2.409** | -3.314*** | -0.465*** | -0.852 | -3.342*** | -0.508 | -2.139 | -3.759*** | |
| CADF | -2.175** | -2.178* | -2.278** | -3.175*** | -0.465 | -0.852 | -2.431*** | -0.468 | -1.719 | -0.166 | ||
| Lower-middle-income countries | CIPS | -2.468*** | -1.498 | -1.913 | -2.975*** | -1.042 | -1.056 | -3.981*** | -2.160* | -2.159** | -5.683 | |
| CADF | -1.971 | -1.295 | -1.497 | -2.591*** | -1.042 | -1.056 | -2.696*** | -1.736 | -1.725 | -4.264 | ||
| Low-income countries | CIPS | -2.132 | -1.071 | -2.117 | -3.847*** | -0.570 | 0.406 | -2.360** | -1.639 | -2.180 | -2.400** | |
| CADF | -1.869 | -1.292 | -1.721 | -3.026*** | -0.570 | 0.406 | -2.355* | -1.485 | -1.605 | -2.294* | ||
| Level I(1) | High-income countries | CIPS | -5.343 | -4.807*** | -4.444*** | -2.969*** | -1.713 | -2.051 | -6.053*** | -3.090*** | -5.800*** | -4.814*** |
| CADF | -3.437*** | -2.552 | -2.462*** | -2.982*** | -1.586*** | -1.747** | -4.078*** | -2.236** | -3.420*** | -3.191*** | ||
| Upper-middle-income countries | CIPS | -5.612*** | -5.324*** | -5.364*** | -3.782*** | -1.489** | -1.776* | -5.829*** | -1.791** | -6.038*** | -4.473*** | |
| CADF | -3.515*** | -3.303*** | -3.271*** | -3.778*** | -1.211** | -1.625** | -4.139*** | -1.390*** | -3.046*** | -0.715*** | ||
| Lower-middle-income countries | CIPS | -5.855*** | -5.612*** | -5.297*** | -3.720*** | -1.343 | -1.566 | -5.958*** | -1.417** | -5.792*** | -2.785*** | |
| CADF | -3.250*** | -3.187*** | -3.230*** | -3.587*** | -1.154* | -1.019* | -4.374*** | -1.849 | -3.225*** | -2.583*** | ||
| Low-income countries | CIPS | -5.458*** | -5.381*** | -4.868*** | -3.207*** | -4.325*** | -3.792*** | -4.926*** | -0.515*** | -3.454*** | -3.993*** | |
| CADF | -2.972*** | -3.387*** | -3.314*** | -3.315*** | -2.867*** | -2.468** | -3.169*** | -0.416*** | -2.309* | -2.179*** |
Table 7
Results of Westerlund cointegration test."
| Equation | High-income countries | Upper-middle-income countries | Lower-middle-income countries | Low-income countries |
|---|---|---|---|---|
| Agricultural sector | 1.739*** | -1.764** | -2.296** | 3.967*** |
| Industrial sector | 3.565*** | -1.535* | -2.334*** | 4.693*** |
| Service sector | 6.199*** | -1.653** | -2.236** | 2.234** |
Table 8
Cross-sectionally augmented autoregressive distributed lag (CS-ARDL) estimation results of agricultural sector equation."
| Estimation | Independent variable | High-income countries | Upper-middle-income countries | Lower-middle-income countries | Low-income countries |
|---|---|---|---|---|---|
| Long-run association | TEMP | 1.1360*** | -1.0345*** | -1.6423** | 2.0327 |
| PREC | -0.0070*** | 0.0109*** | -0.0089 | -0.2747*** | |
| PREC2 | 0.0060*** | -0.0003*** | 0.0004 | 0.0080** | |
| FDI | -0.0234** | 0.0482** | 0.0342 | 0.0728 | |
| HCI | 0.0002*** | -0.0002** | -6.9499*** | -47.6856*** | |
| NC | 0.5543*** | -0.0395 | -0.2259*** | -0.1307* | |
| ICT | 0.0006* | -0.0048 | 0.0112 | 0.3528** | |
| Short-run association | TEMP | 0.0213 | 6.2204** | 2.3081 | -0.0771 |
| PREC | -0.0324 | -0.4261 | -1.0391 | -1.3815 | |
| PREC2 | 0.0020 | 0.0005 | 0.0001 | 0.0040 | |
| FDI | 0.0088* | -0.0719 | 0.0244 | -0.0497 | |
| HCI | 6.7969** | 8.8360 | -16.6448 | 57.3107 | |
| NC | 0.1150 | -0.0706 | 0.1248 | -0.0199 | |
| ICT | -0.0031 | -0.0821** | -0.1797 | -0.2524 | |
| Constant | 2.0823** | 18.0417*** | 33.0289*** | 67.7052*** | |
| Error correction term | -0.1117*** | -0.4079*** | -0.4466*** | -0.4024*** | |
| R2 | 0.5840 | 0.6720 | 0.4950 | 0.5130 | |
Table 9
CS-ARDL estimation results of industrial sector equation."
| Estimation | Independent variable | High-income countries | Upper-middle-income countries | Lower-middle-income countries | Low-income countries |
|---|---|---|---|---|---|
| Long-run association | TEMP | 1.3005*** | -2.8590* | 6.9020*** | -9.9572*** |
| PREC | -0.0168 | 0.0203** | 0.0502*** | 0.1895** | |
| PREC2 | 0.0001 | -0.0060** | -0.0005*** | -0.0002* | |
| FDI | 0.3181*** | -0.0334 | -0.1401 | 0.0452 | |
| HCI | 0.0005 | 0.0001* | 0.4299 | -47.2004*** | |
| NC | 1.0503 | 0.5393*** | 0.3257*** | 0.1848* | |
| ICT | -0.0295 | -0.1262*** | 0.0361** | 0.1762 | |
| Short-run association | TEMP | 0.9565 | -8.0745 | 4.1663 | -6.5521 |
| PREC | 0.9481** | -3.0266** | 7.2272* | 0.3853 | |
| PREC2 | -0.0013* | 0.0032** | -0.0008* | -0.0070 | |
| FDI | 0.0336 | 0.1555** | -0.0805 | 0.0547 | |
| HCI | 21.0773 | -9.8123 | -1.9566 | 10.6643 | |
| NC | 0.4222 | 0.1936** | 0.0656 | -0.1240 | |
| ICT | 0.0078 | 0.1018* | 0.2000 | 0.2685 | |
| Constant | 8.3356*** | -3.5482*** | 81.1307*** | -75.9124*** | |
| Error correction term | -0.1682*** | -0.3245*** | -0.4148*** | -0.2909*** | |
| R2 | 0.4370 | 0.5940 | 0.4120 | 0.4640 | |
Table 10
CS-ARDL estimation results of service sector equation."
| Estimation | Independent variable | High-income countries | Upper-middle-income countries | Lower-middle-income countries | Low-income countries |
|---|---|---|---|---|---|
| Long-run association | TEMP | 0.1644** | -0.8137*** | 2.0735** | 3.3086* |
| PREC | -0.1160*** | 0.0204** | -0.0124 | -0.1544*** | |
| PREC2 | 0.0002** | -0.0003** | -0.0006 | 0.0004*** | |
| FDI | 0.0050*** | 0.0257** | 0.0796*** | -0.0755** | |
| HCI | 0.0003*** | 0.0040 | 17.9276*** | 50.6758*** | |
| NC | -1.4655*** | -0.6593*** | -0.1394* | 0.8745*** | |
| ICT | 0.0658*** | 0.0726*** | -0.0550*** | -0.1011 | |
| Short-run association | TEMP | 1.2291*** | 5.4759 | -11.9400* | 12.1216 |
| PREC | -0.8245* | 3.6919** | -2.7000 | -1.1470** | |
| PREC2 | 0.0009** | -0.0036** | -0.0014 | 0.0070* | |
| FDI | -0.0859*** | -0.0153 | 0.0675 | -0.1765* | |
| HCI | -27.8809 | -24.6395 | -15.4877 | -64.1950 | |
| NC | -0.5629 | -0.1249** | -0.1591*** | 0.0418 | |
| ICT | 0.0107** | 0.0133* | -0.1025 | -0.2945*** | |
| Constant | 13.6312*** | 19.5057*** | -5.8731** | -3.9249* | |
| Error correction term | -0.1970*** | -0.3918*** | -0.4436*** | -0.2237** | |
| R2 | 0.5160 | 0.6790 | 0.4860 | 0.4380 | |
Table 11
Results of augmented mean group (AMG) robustness test."
| Equation | Income group | TEMP | PREC | PREC2 | FDI | HCI | NC | ICT | Constant |
|---|---|---|---|---|---|---|---|---|---|
| Agricultural sector | High-income countries | -0.1100 | -0.0100* | 0.0100* | -0.0100** | -1.4000 | 0.3900 | -0.0100 | 0.2900 |
| Upper-middle-income countries | -0.8400** | 0.0100 | -0.0100 | -0.0700 | -1.8400 | -0.0100* | -0.0100 | 10.5800*** | |
| Lower-middle-income countries | -1.5500** | -0.0100 | -0.0100 | 0.0200 | -8.1700** | 0.2100 | 0.0200 | 28.8600 | |
| Low-income countries | -2.8000 | -0.0800*** | 0.1400** | -0.2100 | -44.0600*** | -0.2900*** | 0.6200*** | 68.1900** | |
| Industrial sector | High-income countries | 0.7200* | -0.0100* | 0.0100 | -0.0100 | -2.2000 | 0.9200*** | -0.0200*** | 6.2300*** |
| Upper-middle-income countries | -0.2900 | -0.0100 | 0.0100 | -0.1800 | -0.1600 | 0.7800*** | -0.0900** | -8.7100* | |
| Lower-middle-income countries | 2.7100 | 0.0100** | -0.0100* | -0.2900*** | 7.4100*** | 0.5000*** | -0.0200 | 25.6000** | |
| Low-income countries | -1.4700 | 0.0300*** | -0.0200** | -0.1800*** | 119.7100*** | 0.1900** | -0.1000 | -44.5800** | |
| Service sector | High-income countries | -12.7200* | 2.5900** | -0.0400* | -0.0900*** | 29.4800* | -0.7200 | 12.1200** | 384.4700 |
| Upper-middle-income countries | -2.7800 | -0.0100 | 0.0100 | 0.1800 | 1.7400 | -0.7300*** | 0.0700*** | 36.1000 | |
| Lower-middle-income countries | -8.1400*** | -0.0100 | 0.0100 | 0.0700 | 20.3800*** | -0.2900*** | 0.0300** | 62.2400*** | |
| Low-income countries | -3.7200 | -0.0300*** | 0.0200*** | -0.1100* | 59.1100*** | -0.2600** | -0.2400 | 67.1008*** |
| [1] | Aarif, M., Tarique, M., 2022. Does FDI generate employment? An empirical study of Indian service sector. SDMIMD Journal of Management. 13, 63, doi: 10.18311/sdmimd/2022/29585. |
| [2] | Abbass, K., Qasim, M.Z., Song, H.M., et al., 2022. A review of the global climate change impacts, adaptation, and sustainable mitigation measures. Environ. Sci. Pollut. Res. 29, 42539-42559. |
| [3] | Adejumo, A.V., Olomola, P.A., Adejumo, O.O., 2013. The role of human capital in industrial development: The Nigerian case (1980-2010). Modern Economy. 4, 639-651. |
| [4] | Adger, W.N., 2006. Vulnerability. Global Environmental Change. 16(3), 268-281. |
| [5] | Albalate, D., Bel, G., Mazaira-Font, F.A., 2021. Geography and regional economic growth: The high cost of deviating from nature. J. Reg. Sci. 62(2), 360-388. |
| [6] | Alfar, A.J.K., Elheddad, M., Doytch, N., 2024. Impact of political conflict on foreign direct investments in the mining sector: Evidence from the event study and spatial estimation. J. Environ. Manage. 350, 119590, doi: 10.1016/j.jenvman.2023.119590. |
| [7] | Alshubiri, F., Jamil, S.A., Elheddad, M., 2019. The impact of ICT on financial development: Empirical evidence from the Gulf Cooperation Council countries. Int. J. Eng. Bus. Manag. 11, 1-14. |
| [8] | Appiah-Otoo, I., Song, N., 2021. The impact of ICT on economic growth - Comparing rich and poor countries. Telecommun. Policy. 45(2), 102082, doi: 10.1016/j.telpol.2020.102082. |
| [9] | Badeeb, R.H., Lean, H.H., 2017. Natural resources and productivity: Can banking development mitigate the curse? Economies. 5(2), 11, doi: 10.3390/economies5020011. |
| [10] | Baiyegunhi, L.J.S., 2024. Examining the impact of human capital and innovation on farm productivity in the KwaZulu-Natal North Coast, South Africa. Agrekon. 63(1-2), 51-64. |
| [11] | Bedane, H.R., Beketie, K.T., Fantahun, E.E., et al., 2022. The impact of rainfall variability and crop production on vertisols in the central highlands of Ethiopia. Environ. Syst. Res. 11, 26, doi: 10.1186/s40068-022-00275-3. |
| [12] | Bergougui, B., Murshed, S.M., 2023. Spillover effects of FDI inflows on output growth: An analysis of aggregate and disaggregated FDI inflows of 13 MENA economies. Aust. Econ. Pap. 62(4), 668-692. |
| [13] | Bosetti, V., Carraro, C., Tavoni, M., 2009. Climate change mitigation strategies in fast-growing countries: The benefits of early action. Energy Econ. 31, S144-S151. |
| [14] | Byaro, M., Nkonoki, J., Mafwolo, G., 2023. Exploring the nexus between natural resource depletion, renewable energy use, and environmental degradation in sub-Saharan Africa. Environ. Sci. Pollut. Res. 30(8), 19931-19945. |
| [15] | Camino-Mogro, S., Bermudez-Barrezueta, N., Armijos, M., 2023. Is FDI a potential tool for boosting firm’s performance? Firm level evidence from Ecuador. J. Evol. Econ. 33, 341-391. |
| [16] | Chandio, A.A., Sethi, N., Dash, D.P., et al., 2022. Towards sustainable food production: What role ICT and technological development can play for cereal production in Asian-7 countries? Comput. Electron. Agric. 202, 107368, doi: 10.1016/j.compag.2022.107368. |
| [17] | Chandio, A.A., Dash, D.P., Nathaniel, S.P., et al., 2023a. Mitigation pathways towards climate change: Modelling the impact of climatological factors on wheat production in top six regions of China. Ecol. Model. 481, 110381, doi: 10.1016/j.ecolmodel.2023.110381. |
| [18] | Chandio, A.A., Gokmenoglu, K.K., Sethi, N., et al., 2023b. Examining the impacts of technological advancement on cereal production in ASEAN countries: Does information and communication technology matter? Eur. J. Agron. 144, 126747, doi: 10.1016/j.eja.2023.126747. |
| [19] | Chandio, A.A., Gokmenoglu, K.K., Khan, I., et al., 2023c. Does internet technology usage improve food production? Recent evidence from major rice-producing provinces of China. Comput. Electron. Agric. 211, 108053, doi: 10.1016/j.compag.2023.108053. |
| [20] | Chandio, A.A., Gokmenoglu, K.K., Dash, D.P., 2025. Exploring the energy-climate-agriculture (ECA) nexus: A roadmap toward agricultural sustainability in Asian countries. Environ. Dev. Sustain. 27(6), 12769-12795. |
| [21] | Chen, S., Chen, X.G., Xu, J.T., 2016. Impacts of climate change on agriculture: Evidence from China. J. Environ. Econ. Manage. 76, 105-124. |
| [22] | Chudik, A., Mohaddes, K., Pesaran, M.H., et al., 2016. Long-run effects in large heterogeneous panel data models with cross-sectionally correlated errors. In: Estimators, M.A.O.N., Footprints, A.R.W., (eds.). Essays in Honor of Aman Ullah Available. Bradford: Emerald Group Publishing Limited, 85-135. |
| [23] | Das, L., Raut, R., 2014. Impact of changes in service sector in India in shaping the future of Business & Society. Procedia Economics and Finance. 11, 795-803. |
| [24] | Demeulemeester, J.L., Diebolt, C., 2011. Education and growth: What links for which policy? Hist. Soc. Res. 36(4), 323-346. |
| [25] | Emako, E., Nuru, S., Menza, M., 2022. The effect of foreign direct investment on economic growth in developing countries. Transnatl. Corp. Rev. 14(4), 382-401. |
| [26] | Erumban, A.A., Das, D.K., 2016. Information and communication technology and economic growth in India. Telecommun. Policy. 40(5), 412-431. |
| [27] | Fazaalloh, A.M., 2024. FDI and economic growth in Indonesia: A provincial and sectoral analysis. Journal of Economic Structures. 13, 3, doi: 10.1186/s40008-023-00323-w. |
| [28] | Franzoni, S., Pelizzari, C., 2021. Rainfall option impact on profits of the hospitality industry through scenario correlation and copulas. Ann. Oper. Res. 229, 939-962. |
| [29] | Gillman, M., 2021. Steps in industrial development through human capital deepening. Econ. Model. 99, 105470, doi: 10.1016/j.econmod.2021.02.011. |
| [30] | Gössling, S., Neger, C., Steiger, R., et al., 2023. Weather, climate change, and transport: A review. Nat. Hazards. 118, 1341-1360. |
| [31] | Gruzina, Y., Firsova, I., Strielkowski, W., 2021. Dynamics of human capital development in economic development cycles. Economies. 9(2), 67, doi: 10.3390/economies9020067. |
| [32] | Heal, G.M., Park, J., 2013. Feeling the heat: Temperature, physiology & the wealth of nations. In: National Bureau of Economic Research. Working Paper No.w19725. Cambridge, USA. |
| [33] | Huang, X., Zhang, M., Hui, M.K., et al., 2014. Warmth and conformity: The effects of ambient temperature on product preferences and financial decisions. J. Consum. Psychol. 24(2), 241-250. |
| [34] | Ihensekhien, O.A., Soriwei, E., 2023. Impact of Human Capital Development in the Service Sector of the Nigerian Economy. [2024-05-12]. https://www.studocu.com/en-us/document/clarkson-university/introduction-to-econometrics/impact-of-human-capital-development-in-t/62326274. |
| [35] | Jirophat, C., Manopimoke, P., Suwanik, S., 2022. The macroeconomic effects of climate shocks in Thailand. In: Puey Ungphakorn Institute for Economic Research. Discussion Paper No.188. Bangkok, Thailand. |
| [36] | Koetse, M.J., Rietveld, P., 2009. The impact of climate change and weather on transport: An overview of empirical findings. Transport. Res. Part D-Transport. Environ. 14(3), 205-221. |
| [37] |
Kotchoni, D.O.V., Vouillamoz, J.M., Lawson, F.M.A., et al., 2019. Relationships between rainfall and groundwater recharge in seasonally humid Benin: A comparative analysis of long-term hydrographs in sedimentary and crystalline aquifers. Hydrogeol. J. 27(2), 447-457.
doi: 10.1007/s10040-018-1806-2 |
| [38] | Kotz, M., Wenz, L., Stechemesser, A., et al., 2021. Day-to-day temperature variability reduces economic growth. Nat. Clim. Chang. 11(4), 319-325. |
| [39] | Kotz, M., Levermann, A., Wenz, L., 2022. The effect of rainfall changes on economic production. Nature. 601, 223-227. |
| [40] | Kumar, V., Balu, B., 2023. Estimating the impact of human capital underutilization on the productivity and economic growth in India. J. Knowl. Econ. doi: 10.1007/s13132-023-01152-9. |
| [41] | Kumar, P., Datta, S.K., 2024. Environmental degradation and economic growth: A longitudinal analysis across different income group countries. The Indian Economic Journal. 72(1), 72-89. |
| [42] | Lahlali, R., Taoussi, M., Laasli, S.E., et al., 2024. Effects of climate change on plant pathogens and host-pathogen interactions. Crop Environ. 3(3), 159-170. |
| [43] | Lee, M., Gaspar, R., Villaruel, M.L., 2020. Effects of temperature shocks on economic growth and welfare in Asia. Resources and Environmental Economics. 2(2), 158-171. |
| [44] | Li, C.Z., Cong, J.J., Gu, H.Y., et al., 2021. The non-linear effect of daily weather on economic performance: Evidence from China. China Econ. Rev. 69, 101647, doi: 10.1016/j.chieco.2021.101647. |
| [45] | Liu, X.M., Zhang, W., Liu, X.R., et al., 2022. The impact assessment of FDI on industrial green competitiveness in China: Based on the perspective of FDI heterogeneity. Environ. Impact Assess. Rev. 93, 106720, doi: 10.1016/j.eiar.2021.106720. |
| [46] | Mabeta, J., Smutka, L., Mrkvička, T., 2025. Impact of foreign direct investment on agricultural production and exports of SADC countries. Social Sciences & Humanities. 11, 101499, doi: 10.1016/j.ssaho.2025.101499. |
| [47] | Metreau, E., Young, K.E., Eapen, S.G., 2024. World Bank Country Classifications by Income Level for 2024-2025. [2024-05-12]. https://blogs.worldbank.org/en/opendata/world-bank-country-classifications-by-income-level-for-2024-2025. |
| [48] | Meyghani, S., Khodaparast Mashhadi, M., Salehnia, N., 2023. Long-term effects of temperature and precipitation on economic growth of selected MENA region countries. Environ. Dev. Sustain. 25(7), 7325-7343. |
| [49] | Mitra, S.K., 2014. Nonlinear impact of rain on food grain production in India. Appl. Econ. Lett. 21(14), 1001-1005. |
| [50] | Muhamad, M.G., Heshmati, A., Khayyat, N.T., 2021. How to reduce the degree of dependency on natural resources? Resour. Policy. 72, 102047, doi: 10.1016/j.resourpol.2021.102047. |
| [51] | Mulama, O.N., Kariuki, C.W., 2021. Panel analysis of the relationship between weather variability and sectoral output in Kenya. In: Oguge, N., Ayal, D., Adeleke, L., (eds.). African Handbook of Climate Change Adaptation. Cham: Springer International Publishing, 947-963. |
| [52] | Nath, H.K., Liu, L.R., 2017. Information and communications technology (ICT) and services trade. Inf. Econ. Policy. 41, 81-87. |
| [53] | Odili, F., Bhushan, S., Valenti, H.H., et al., 2023. Water table depth effect on growth and yield parameters of hard red spring wheat (Triticum aestivum L.): A lysimeter study. Appl. Water Sci. 13, 65, doi: 10.1007/s13201-023-01868-8. |
| [54] | Pesaran, M.H., 2004. General diagnostic tests for cross section dependence in panel. In: Institute for the Study of Labor. Discussion Paper No. 1240. Bonn, Germany. |
| [55] | Pesaran, M.H., 2007. A simple panel unit root test in the presence of cross sectional dependence. J. Appl. Econom. 22(2), 265-312. |
| [56] | Pesaran, M.H., Yamagata, T., 2008. Testing slope homogeneity in large panels. J. Econom. 142(1), 50-93. |
| [57] | Pradhan, R.P., Mallik, G., Bagchi, T.P., 2018. Information communication technology (ICT) infrastructure and economic growth: A causality evinced by cross-country panel data. IIMB Manag. Rev. 30(1), 91-103. |
| [58] | Pradhan, R., Sahoo, J., 2019. Smart rainwater management: New technologies and innovation. In: Bobek, V., (ed.). Smart Urban Development. London: IntechOpen, 83. |
| [59] | Regnerová, O., Šálková, D., Sanova, P., 2021. The importance of industry in modern economies of the globalized world in the 21st century. SHS Web of Conferences. 92, 04021, doi: 10.1051/shsconf/20219204021. |
| [60] | Remeikiene, R., Gaspareniene, L., Fedajev, A., et al., 2021. The role of ICT development in boosting economic growth in transition economies. Journal of International Studies. 14(4), 9-22. |
| [61] | Romer, P., 1993. Idea gaps and object gaps in economic development. J. Monetary Econ. 32(3), 543-573. |
| [62] | Sahoo, K., Sethi, N., 2012. Investigating the impact of agriculture and industrial sector on economic growth of India. OIDA International Journal of Sustainable Development. 5(5), 11-22. |
| [63] | Saleh, H., Surya, B., Ahmad, D.N.A., et al., 2020. The role of natural and human resources on economic growth and regional development: With discussion of open innovation dynamics. Journal of Open Innovation: Technology, Market, and Complexity. 6(4), 103, doi: 10.3390/joitmc6040103. |
| [64] | Samdrup, T., Fogarty, J., Pandit, R., et al., 2023. Does FDI in agriculture in developing countries promote food security? Evidence from meta-regression analysis. Econ. Anal. Policy. 80, 1255-1272. |
| [65] | Sangkhaphan, S., Shu, Y., 2020. The effect of rainfall on economic growth in Thailand: A blessing for poor provinces. Economies. 8(1), 1, doi: 10.3390/economies8010001. |
| [66] | Schleypen, J.R., Mistry, M.N., Saeed, F., et al., 2022. Sharing the burden: Quantifying climate change spillovers in the European Union under the Paris Agreement. Spat. Econ. Anal. 17(1), 67-82. |
| [67] | Schmitt, J., Offermann, F., Söder, M., et al., 2022. Extreme weather events cause significant crop yield losses at the farm level in German agriculture. Food Policy. 112, 102359, doi: 10.1016/j.foodpol.2022.102359. |
| [68] | Scholze, N., Riach, N., Glaser, R., et al., 2023. Climate change impacts and adaptation efforts in different economic sectors of the Trinational Metropolitan Region Upper Rhine. CLIM. RISK MANAG. 42, 100576, doi: 10.1016/j.crm.2023.100576. |
| [69] | Shah, W.U.H., Hao, G., Yan, H., et al., 2024. Natural resources utilization efficiency evaluation, determinant of productivity change, and production technology heterogeneity across developed and developing G20 economies. Technol. Soc. 77, 102507, doi: 10.1016/j.techsoc.2024.102507. |
| [70] | Subash, N., Singh, S.S., Priya, N., 2011. Extreme rainfall indices and its impact on rice productivity—A case study over sub-humid climatic environment. Agric. Water Manage. 98(9), 1373-1387. |
| [71] | Sudarshan, A., Tewari, M., 2014. The economic impacts of temperature on industrial productivity:Evidence from Indian manufacturing. In: Indian Council for Research on International Economic Relations. Working Paper 278. Delhi, India. |
| [72] | Sultana, Z., Sadekin, M.N., 2023. The impact of FDI on the agriculture sector: A case study from Bangladesh. Heliyon. 9(12), e22983, doi: 10.1016/j.heliyon.2023.e22983. |
| [73] | Sun, H.P., Sun, W.F., Geng, Y., et al., 2018. Natural resource dependence, public education investment, and human capital accumulation. Pet. Sci. 15, 657-665. |
| [74] | Sun, Q., Mann, J., Skidmore, M., 2022. The impacts of flooding and business activity and employment: A spatial perspective on small business. Water Econ. Policy. 8(3), 2140003, doi: 10.1142/S2382624X21400038. |
| [75] | Tamura, R., 2002. Human capital and the switch from agriculture to industry. J. Econ. Dyn. Control. 27(2), 207-242. |
| [76] | Teixeira, A.A.C., Queirós, A.S.S., 2016. Economic growth, human capital and structural change: A dynamic panel data analysis. Res. Policy. 45(8), 1636-1648. |
| [77] | Tong, Q.M., Yuan, X.Y., Zhang, L., et al., 2024. The impact of livelihood capitals on farmers’ adoption of climate-smart agriculture practices: Evidence from rice production in the Jianghan Plain, China. CLIM. RISK MANAG. 43, 100583, doi: 10.1016/j.crm.2023.100583. |
| [78] | Torres, M., Howitt, R., Rodrigues, L., 2019. Analyzing rainfall effects on agricultural income: Why timing matters. Economia. 20(1), 1-14. |
| [79] | Ullah, S., Luo, R., Ali, K., et al., 2023. How does the sectoral composition of FDI induce economic growth in developing countries? The key role of business regulations. Ekon. Istraz. 36(2), 2129406, doi: 10.1080/1331677X.2022.2129406. |
| [80] | Wang, T., Sun, C.W., Yang, Z.Q., 2023. Climate change and sustainable agricultural growth in the Sahel region: Mitigating or resilient policy response? Heliyon. 9(9), e19839, doi: 10.1016/j.heliyon.2023.e19839. |
| [81] | Wang, X.F., Zhu, L., Liu, H.Y, 2024. Effects of foreign direct investment in services on input imports of manufacturing firms: Evidence from China. Rev. Int. Econ. 32(3), 1434-1461. |
| [82] | Wenz, L., Levermann, A., Auffhammer, M., 2017. North-south polarization of European electricity consumption under future warming. Proc. Natl. Acad. Sci. U.S.A. 114(38), E7910-E7918. |
| [83] | Westerlund, J., 2007. Testing for error correction in panel data. Oxf. Bull. Econ. Stat. 69(6), 709-748. |
| [84] | Yeboah, E., Baffour, A.A., Chibalamula, H.C., et al., 2025. The significance of foreign direct investment (FDI) and trade openness: evidence from nine European economies. SN Business & Economics. 5, 27, doi: 10.1007/s43546-025-00798-8. |
| [85] | Zahoor, Z., Latif, M.I., Khan, I., et al., 2022. Abundance of natural resources and environmental sustainability: the roles of manufacturing value-added, urbanization, and permanent cropland. Environ. Sci. Pollut. Res. 29(54), 82365-82378. |
| [86] | Zhang, P., Deschênes, O., Meng, K., et al., 2018. Temperature effects on productivity and factor reallocation: Evidence from a half million Chinese manufacturing plants. J. Environ. Econ. Manage. 88, 1-17. |
| [87] | Zhang, Y.G., Dilanchiev, A., 2022. Economic recovery, industrial structure and natural resource utilization efficiency in China: Effect on green economic recovery. Resour. Policy. 79, 102958, doi: 10.1016/j.resourpol.2022.102958. |
| [88] | Zhao, Y.B., Liu, S.G., 2023. Effects of climate change on economic growth: A perspective of the heterogeneous climate regions in Africa. Sustainability. 15(9), 7136, doi: 10.3390/su15097136. |
| [89] | Zheng, X.T., Sarwar, A., Islam, F., et al., 2023. Rainwater harvesting for agriculture development using multi-influence factor and fuzzy overlay techniques. Environ. Res. 238(2), 117189, doi: 10.1016/j.envres.2023.117189. |
| [90] | Zhu, P., Burney, J., Chang, J.F., et al., 2022. Warming reduces global agricultural production by decreasing cropping frequency and yields. Nat. Clim. Chang. 12, 1016-1023. |
| [1] | Md Tauhid Ur RAHMAN, Adnan KHAIRULLAH. Integrating farmers’ perceptions and empirical climate data to assess agricultural productivity and food security in coastal Bangladesh [J]. Regional Sustainability, 2025, 6(5): 100259-. |
| [2] | Saira SHAFIQ, Muhammad ZIA UL HAQ, Syed Abbas RAZA NAQVI, Wardha SARFARAZ, Hina ALI, Muhammad Majid ISLAM, Gul Zaib HASSAN, Muhammad NAWAZ, Tasawer ABBAS. Integrating neglected and underutilized crops (NUCs) in South Asian cropping systems and diets: Challenges and prospects [J]. Regional Sustainability, 2025, 6(4): 100242-. |
| [3] | Md Maruf BILLAH, Mohammad Mahmudur RAHMAN, Santiago MAHIMAIRAJA, Alvin LAL, Asadi SRINIVASULU, Ravi NAIDU. Enhancing climate-smart coastal farming system through agriculture extension and advisory services towards the avenues of farm sustainability [J]. Regional Sustainability, 2025, 6(4): 100243-. |
| [4] | Syed Masiur RAHMAN, Asif RAIHAN, Md Shafiul ALAM, Shakhawat CHOWDHURY. Greenhouse gas emission dynamics and climate change mitigation efforts toward sustainability in the Middle East and North Africa (MENA) region [J]. Regional Sustainability, 2025, 6(4): 100246-. |
| [5] | Olani Bekele SAKILU, CHEN Haibo. Exploring the influence of trade openness, energy consumption, natural resource rents, and human capital in achieving carbon neutrality [J]. Regional Sustainability, 2025, 6(4): 100247-. |
| [6] | Mohammad Reza PAKRAVAN-CHARVADEH, Jeyran CHAMCHAM, Rahim MALEKNIA. How climate change adaptation strategies and climate migration interact to control food insecurity? [J]. Regional Sustainability, 2025, 6(3): 100229-. |
| [7] | Ivette Gnitedem KEUBENG, George Achu MULUH, Vatis Christian KEMEZANG. Controlling agricultural product price volatility: An empirical analysis from Cameroon [J]. Regional Sustainability, 2025, 6(2): 100215-. |
| [8] | Osama AHMED, Mourad FAIZ, Laamari ABDELALI, Safwa KHOALI, Cataldo PULVENT, Sameh MOHAMED, Mame Samba MBAYE, Thomas GLAUBEN. Unlocking climate change resilience: Socioeconomic factors shaping smallholder farmers’ perceptions and adaptation strategies in Mediterranean and Sub-Saharan Africa regions [J]. Regional Sustainability, 2025, 6(1): 100195-. |
| [9] | Felix KPENEKUU, Philip ANTWI-AGYEI, Fred NIMOH, Andrew DOUGILL, Albert BANUNLE, Jonathan ATTA-AIDOO, Frank BAFFOUR-ATA, Thomas Peprah AGYEKUM, Godfred ADDAI, Lawrence GUODAAR. Cost and benefit analysis of Climate-Smart Agriculture interventions in the dryland farming systems of northern Ghana [J]. Regional Sustainability, 2025, 6(1): 100196-. |
| [10] | MA Xing, QIANG Wenli, WANG Shijin, LIU Jiayi, Arunima MALIK, LI Mengyu, WANG Xiang. Evolutionary characteristics of export trade network in the Arctic region [J]. Regional Sustainability, 2024, 5(4): 100176-. |
| [11] | Septri WIDIONO, Ekawati Sri WAHYUNI, Lala M. KOLOPAKING, Arif SATRIA. Livelihood vulnerability of indigenous people to climate change around the Kerinci Seblat National Park in Bengkulu, Indonesia [J]. Regional Sustainability, 2024, 5(4): 100181-. |
| [12] | Issa NYASHILU, Robert KIUNSI, Alphonce KYESSI. Climate change vulnerability assessment in the new urban planning process in Tanzania [J]. Regional Sustainability, 2024, 5(3): 100155-. |
| [13] | Homayoon RAOUFI, Hamidreza JAFARI, Wakil Ahmad SARHADI, Esmail SALEHI. Assessing the impact of climate change on agricultural production in central Afghanistan [J]. Regional Sustainability, 2024, 5(3): 100156-. |
| [14] | Frank BAFFOUR-ATA, Louisa BOAKYE, Moses Tilatob GADO, Ellen BOAKYE-YIADOM, Sylvia Cecilia MENSAH, Senyo Michael KWAKU KUMFO, Kofi Prempeh OSEI OWUSU, Emmanuel CARR, Emmanuel DZIKUNU, Patrick DAVIES. Climatic and non-climatic factors driving the livelihood vulnerability of smallholder farmers in Ahafo Ano North District, Ghana [J]. Regional Sustainability, 2024, 5(3): 100157-. |
| [15] | SONG Boyi, ZHANG Shihang, LU Yongxing, GUO Hao, GUO Xing, WANG Mingming, ZHANG Yuanming, ZHOU Xiaobing, ZHUANG Weiwei. Characteristics and drivers of the soil multifunctionality under different land use and land cover types in the drylands of China [J]. Regional Sustainability, 2024, 5(3): 100162-. |
| Viewed | ||||||
|
Full text |
|
|||||
|
Abstract |
|
|||||
 REGSUS Wechat
 新公网安备 65010402001202号