
Regional Sustainability ›› 2026, Vol. 7 ›› Issue (4): 100374.doi: 10.1016/j.regsus.2026.100374
• Research article • Previous Articles
LIU Minga, ZHANG Haoa, KONG Zhihaoa, ZHENG Yuxina, ZHOU Gaoxiangb,*( ), WANG Xiaofenga, REN Zhaoxiaa, Jonathan LIa,c
Received:2025-09-26
Revised:2026-04-15
Accepted:2026-07-19
Published:2026-08-30
Online:2026-08-05
Contact:
*E-mail address: zhougx@nwafu.edu.cn (ZHOU Gaoxiang).
LIU Ming, ZHANG Hao, KONG Zhihao, ZHENG Yuxin, ZHOU Gaoxiang, WANG Xiaofeng, REN Zhaoxia, Jonathan LI. Spatiotemporal pattern of terrestrial ecosystem carbon storage in China with projections under multiple climate scenarios[J]. Regional Sustainability, 2026, 7(4): 100374.
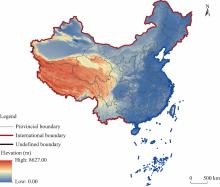
Fig. 1.
Location and topographic characteristics of the study area. The elevation background was derived from digital elevation model data (https://www.gebco.net/data-products/gridded-bathymetry-data). Note that the figure is based on the standard map (GS(2024)0650) from the National Platform for Common Geospatial Information Services (https://cloudcenter.tianditu.gov.cn/) issued by the Ministry of Natural Resources of the People’s Republic of China, and the boundary of the standard map has not been modified."

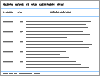
Table 1
Comparison of carbon storage results in terrestrial ecosystems in China."
| Period | Resolution | Carbon storage (Pg C) | Method | Reference |
|---|---|---|---|---|
| Last Glacial Maximum | 55 km | 67.90 | Empirical Osnabruck Biosphere model | Peng and Micharl ( |
| Mid-Holocene | 55 km | 183.40 | Empirical Osnabruck Biosphere model | Peng and Micharl ( |
| Modern period (present-day condition) | 55 km | 157.90 | Empirical Osnabruck Biosphere model | Peng and Micharl ( |
| 1973-2008 | Point data | 67.90-191.80 | Literature-data integration | Wang et al. ( |
| 1990s-2016 | Point data | 89.00-100.00 | Literature-data integration | Yang et al. ( |
| 2004-2014 | Point data | 99.15 | Literature-data integration | Xu et al. ( |
| 2005-2013 | Point data | 92.00 | Sample survey | Tang et al. ( |
| 2010-2015 | Point data | 79.24 | Sample survey | Fang et al. ( |
| 1980-2000 | 11 km | 96.50 | AVIM2 model | Ji et al. ( |
| 1980-2020 | 30 m | 98.41-99.95 | InVEST model | Wang et al. ( |
| 2001-2020 | 1 km | 83.53 | IPCC framework | This study |
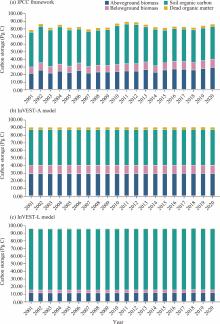
Fig. 2.
Comparison between Intergovernmental Panel on Climate Change (IPCC) framework-based carbon storage accounting (a) and Integrated Valuation of Ecosystem Services and Trade-offs (InVEST) model under two parameterization settings (b and c). InVEST-A, InVEST model based on the land-use-specific mean carbon densities derived in this study; InVEST-L, InVEST model based on literature-derived carbon densities."

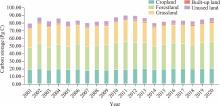
Fig. 3.
Temporal variation of carbon storage in different land-use types in China from 2001 to 2020."
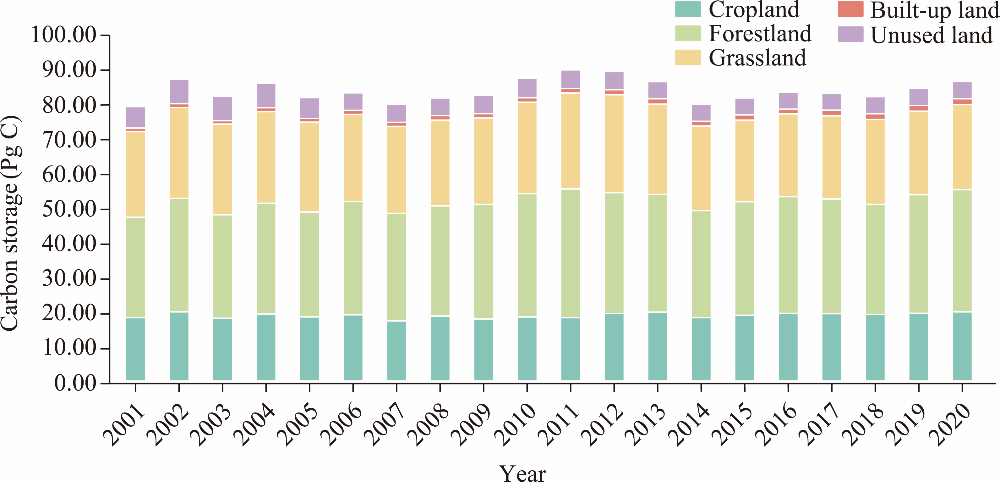
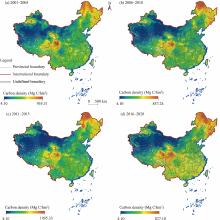
Fig. 4.
Spatial patterns of mean terrestrial ecosystem carbon density in China during 2001-2020. (a), 2001-2005; (b) 2006-2010; (c), 2011-2015; (d), 2016-2020. Note that the figures are based on the standard map (GS(2024)0650) from the National Platform for Common Geospatial Information Services (https://cloudcenter.tianditu.gov.cn/) issued by the Ministry of Natural Resources of the People’s Republic of China, and the boundary of the standard map has not been modified."

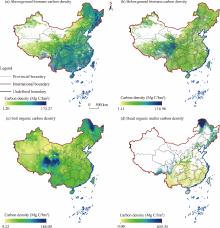
Fig. 5.
Spatial patterns of mean carbon density (averaged over 2001-2020) for the four ecosystem carbon pools in China. (a), aboveground biomass carbon density; (b), belowground biomass carbon density; (c), soil organic carbon density; (d), dead organic matter carbon density. Note that the figures are based on the standard map (GS(2024)0650) from the National Platform for Common Geospatial Information Services (https://cloudcenter.tianditu.gov.cn/) issued by the Ministry of Natural Resources of the People’s Republic of China, and the boundary of the standard map has not been modified."

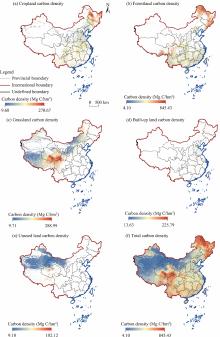
Fig. 6.
Spatial patterns of mean carbon density (averaged over 2001-2020) by land-use type in China. (a), cropland carbon density; (b), forestland carbon density; (c), grassland carbon density; (d), built-up land carbon density; (e), unused land carbon density; (f), total carbon density. Note that the figures are based on the standard map (GS(2024)0650) from the National Platform for Common Geospatial Information Services (https://cloudcenter.tianditu.gov.cn/) issued by the Ministry of Natural Resources of the People’s Republic of China, and the boundary of the standard map has not been modified."

Table 2
Projected land-use areas under different Shared Socioeconomic Pathways (SSP)-Representative Concentration Pathways (RCP) scenarios in China in 2030."
| Scenario | Cropland (×104 hm2) | Forestland (×104 hm2) | Grassland (×104 hm2) | Built-up land (×104 hm2) | Unused land (×104 hm2) |
|---|---|---|---|---|---|
| SSP1-RCP2.6 | 21,348.65 | 23,643.27 | 26,256.20 | 1061.14 | 20,078.71 |
| SSP2-RCP4.5 | 22,665.13 | 24,101.21 | 26,803.19 | 1016.24 | 17,802.20 |
| SSP3-RCP7.0 | 21,741.54 | 24,530.22 | 25,479.81 | 964.07 | 19,672.33 |
| SSP4-RCP3.4 | 22,931.34 | 23,064.33 | 26,886.57 | 1062.68 | 18,443.05 |
| SSP5-RCP8.5 | 23,447.47 | 23,288.45 | 26,337.10 | 1067.62 | 18,247.33 |
Table 3
Total terrestrial ecosystem carbon storage and carbon pool composition under different SSP-RCP scenarios in China in 2030."
| Scenario | Total carbon storage (Pg C) | Carbon pool composition | |||
|---|---|---|---|---|---|
| Aboveground biomass carbon (%) | Belowground biomass carbon (%) | Soil organic carbon (%) | Dead organic matter carbon (%) | ||
| SSP1-RCP2.6 | 90.63 | 32.2 | 12.3 | 52.0 | 3.5 |
| SSP2-RCP4.5 | 92.62 | 32.6 | 12.4 | 51.6 | 3.5 |
| SSP3-RCP7.0 | 91.41 | 32.5 | 12.2 | 51.7 | 3.6 |
| SSP4-RCP3.4 | 91.67 | 32.4 | 12.4 | 51.8 | 3.4 |
| SSP5-RCP8.5 | 91.97 | 32.6 | 12.3 | 51.7 | 3.4 |
Table 4
Pearson correlation between carbon storage of four carbon pools and human footprint in China in 2001, 2005, 2010, 2015, and 2020."
| Carbon pool | 2001 | 2005 | 2010 | 2015 | 2020 | Mean |
|---|---|---|---|---|---|---|
| Aboveground biomass | 0.61 | 0.59 | 0.56 | 0.59 | 0.63 | 0.60 |
| Belowground biomass | 0.48 | 0.46 | 0.45 | 0.48 | 0.51 | 0.48 |
| Soil organic carbon | 0.55 | 0.55 | 0.49 | 0.57 | 0.57 | 0.55 |
| Dead organic matter | 0.09 | 0.09 | 0.09 | 0.09 | 0.08 | 0.09 |
| Total | 0.60 | 0.59 | 0.54 | 0.59 | 0.61 | 0.59 |
Table 5
Pearson correlation between carbon storage of five land-use types and human footprint in China in 2001, 2005, 2010, 2015, and 2020."
| Land-use type | 2001 | 2005 | 2010 | 2015 | 2020 | Mean |
|---|---|---|---|---|---|---|
| Cropland | 0.58 | 0.57 | 0.55 | 0.57 | 0.58 | 0.57 |
| Forestland | 0.24 | 0.24 | 0.21 | 0.23 | 0.24 | 0.23 |
| Grassland | 0.18 | 0.18 | 0.18 | 0.17 | 0.16 | 0.17 |
| Built-up land | 0.23 | 0.25 | 0.26 | 0.29 | 0.30 | 0.27 |
| Unused land | -0.02 | -0.02 | -0.02 | -0.02 | -0.02 | -0.02 |
| Total | 0.60 | 0.59 | 0.54 | 0.59 | 0.61 | 0.59 |
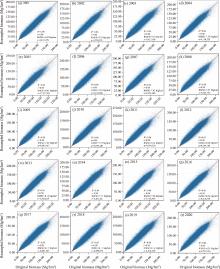
Fig. S1.
Accuracy assessment of resampling vegetation biomass from 500 m to 1 km using area-weighted mean aggregation during 2001-2020 (a-t). R2, determination of coefficient; r, Pearson correlation coefficient; RMSE, root mean square error; n, number of validation pixels."

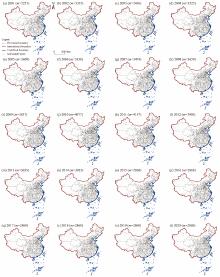
Fig. S2.
Spatial distribution of soil organic carbon density sample points used for annual reconstruction during 2001-2020 (a-t). The points represent year-labeled soil organic carbon density observations. m, number of year-labeled soil organic carbon density sample points. Note that the figures are based on the standard map (GS(2024)0650) from the National Platform for Common Geospatial Information Services (https://cloudcenter.tianditu.gov.cn/) issued by the Ministry of Natural Resources of the People’s Republic of China, and the boundary of the standard map has not been modified."

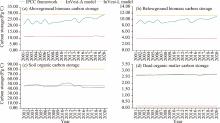
Fig. S3.
Temporal comparison of carbon storage estimates for four carbon pools from the Intergovernmental Panel on Climate Change (IPCC) framework and two Integrated Valuation of Ecosystem Services and Trade-offs (InVEST) benchmark models during 2001-2020. (a), aboveground biomass carbon storage; (b), belowground biomass carbon storage; (c), soil organic carbon storage; (d), dead organic matter carbon storage. InVEST-A model, InVEST model based on the land-use-specific mean carbon densities derived in this study; InVEST-L model, InVEST model based on literature-derived carbon densities."

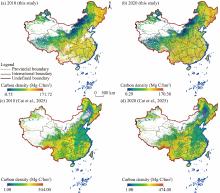
Fig. S4.
Spatial comparison of aboveground biomass carbon density between this study and Cai et al. (2025) for 2010 and 2020. (a), 2010 aboveground biomass carbon density in this study; (b), 2020 aboveground biomass carbon density in this study; (c), 2010 aboveground biomass carbon density from Cai et al. (2025); (d), 2020 aboveground biomass carbon density from Cai et al. (2025)."

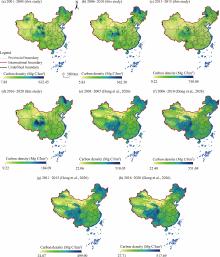
Fig. S5.
Spatial comparison of soil organic carbon density between this study and Dong et al. (2026) during 2001-2020. (a), soil organic carbon density in this study during 2001-2005; (b), soil organic carbon density in this study during 2006-2010; (c), soil organic carbon density in this study during 2011-2015; (d), soil organic carbon density in this study during 2016-2020; (e), soil organic carbon density from Dong et al. (2026) during 2001-2005; (f), soil organic carbon density from Dong et al. (2026) during 2006-2010; (g), soil organic carbon density from Dong et al. (2026) during 2011-2015; (h), soil organic carbon density from Dong et al. (2026) during 2016-2020."

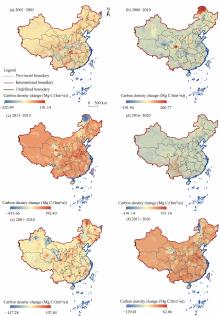
Fig. S6.
Spatial distribution of annual trends in total terrestrial ecosystem carbon density based on the Theil-Sen median trend analysis. (a), spatial distribution of annual trends during 2001-2005; (b), spatial distribution of annual trends during 2006-2010; (c), spatial distribution of annual trends during 2011-2015; (d), spatial distribution of annual trends during 2016-2020; (e), spatial distribution of annual trends during 2001-2010; (f), spatial distribution of annual trends during 2011-2020."

Table S1
Value of Rbelow:above in different climate zones."
| Climate zone | Ecotope | Aboveground biomass (Mg/hm2) | Rbelow:above |
|---|---|---|---|
| Tropical zone | Tropical rain forest | - | 0.37 |
| Tropical moist deciduous forest | <125.00 | 0.20 (0.09-0.25) | |
| >125.00 | 0.24 (0.22-0.33) | ||
| Tropical dry forests | <20.00 | 0.56 (0.28-0.68) | |
| >20.00 | 0.28 (0.27-0.28) | ||
| Tropical shrubbery | - | 0.40 | |
| Tropical mountain range | - | 0.27 (0.27-0.28) | |
| Subtropical zone | Subtropical humid forest | <125.00 | 0.20 (0.09-0.25) |
| >125.00 | 0.24 (0.22-0.33) | ||
| Subtropical arid forest | <125.0 | 0.56 (0.28-0.68) | |
| >125.00 | 0.28 (0.27-0.28) | ||
| Subtropical grassland | - | 0.32 (0.26-0.71) | |
| Subtropical mountain range | - | - | |
| Temperate zone | Temperate marine forest, temperate continental forest, and temperate mountain range | Coniferous forest <50.00 | 0.40 (0.21-1.06) |
| Coniferous forest 50.00-150.00 | 0.29 (0.24-0.50) | ||
| Coniferous forest >150.00 | 0.20 (0.12-0.49) | ||
| Oak tree >70.00 | 0.30 (0.20-1.16) | ||
| Eucalypt <50.00 | 0.44 (0.29-0.81) | ||
| Eucalypt 50.00-150.00 | 0.28 (0.15-0.81) | ||
| Eucalypt >150.00 | 0.20 (0.10-0.33) | ||
| Broad-leaved forest <75.00 | 0.46 (0.12-0.93) | ||
| Broad-leaved forest 75.00-150.00 | 0.23 (0.13-0.37) | ||
| Broad-leaved forest >150.00 | 0.24 (0.17-0.44) | ||
| Northern temperature zone | North temperate coniferous forest, northern temperate tundra forest land, and northern temperate mountain range | <75.00 | 0.39 (0.23-0.96) |
| >75.00 | 0.24 (0.15-0.37) |
Table S2
Default values of dead organic matter carbon density in different climate zones."
| Climate zone | Dead organic matter carbon density (Mg C/hm2) | |
|---|---|---|
| Fallen leaves in broad-leaved forests | Fallen leaves in coniferous forests | |
| Arid northern temperate zone | 25.00 (10.00-58.00) | 31.00 (6.00-86.00) |
| Humid northern temperate zone | 39.00 (11.00-117.00) | 55.00 (7.00-123.00) |
| Arid cold temperate zone | 28.00 (23.00-33.00) | 27.00 (17.00-42.00) |
| Humid cold temperate zone | 16.00 (5.00-31.00) | 26.00 (10.00-48.00) |
| Arid warm temperate zone | 28.20 (23.40-33.00) | 20.30 (17.30-21.10) |
| Humid warm temperate zone | 13.00 (2.00-31.00) | 22.00 (6.00-42.00) |
| Subtropical zone | 2.80 (2.00-3.00) | 4.10 |
| Tropical zone | 2.10 (1.00-3.00) | 5.20 |
Table S3
Carbon densities of four carbon pools for different land-use types for the InVEST-L model derived from this study."
| Land-use type | Carbon density (Mg C/hm2) | |||
|---|---|---|---|---|
| Aboveground biomass | Belowground biomass | Soil organic carbon | Dead organic matter | |
| Cropland | 5.70 | 1.50 | 108.40 | 0.00 |
| Forestland | 43.15 | 10.06 | 102.70 | 0.80 |
| Grassland | 0.40 | 0.90 | 99.90 | 0.00 |
| Water body | 0.00 | 0.00 | 0.00 | 0.00 |
| Built-up land | 0.00 | 0.00 | 78.00 | 0.00 |
| Unused land | 0.00 | 0.00 | 31.40 | 0.00 |
Table S4
Carbon densities of four carbon pools for different land-use types for the InVEST-A model derived from this study."
| Land-use type | Carbon density (Mg C/hm2) | |||
|---|---|---|---|---|
| Aboveground biomass | Belowground biomass | Soil organic carbon | Dead organic matter | |
| Cropland | 45.58 | 11.91 | 50.47 | 0.00 |
| Forestland | 55.98 | 13.86 | 63.98 | 13.26 |
| Grassland | 21.46 | 19.99 | 56.89 | 0.00 |
| Water body | 0.00 | 0.00 | 0.00 | 0.00 |
| Built-up land | 40.06 | 0.00 | 41.96 | 0.00 |
| Unused land | 0.00 | 0.00 | 27.41 | 0.00 |
Table S5
Pearson correlation of carbon density between IPCC framework and two InVEST benchmark models from 2001 to 2020."
| Year | InVEST-A | InVEST-L | Number of grid cells | Year | InVEST-A | InVEST-L | Number of grid cells |
|---|---|---|---|---|---|---|---|
| 2001 | 0.59 | 0.59 | 9,284,912 | 2011 | 0.62 | 0.62 | 9,265,353 |
| 2002 | 0.64 | 0.64 | 9,283,027 | 2012 | 0.59 | 0.59 | 9,266,215 |
| 2003 | 0.56 | 0.56 | 9,281,504 | 2013 | 0.66 | 0.66 | 9,269,417 |
| 2004 | 0.61 | 0.61 | 9,278,590 | 2014 | 0.62 | 0.62 | 9,270,127 |
| 2005 | 0.59 | 0.59 | 9,275,659 | 2015 | 0.71 | 0.71 | 9,268,181 |
| 2006 | 0.70 | 0.70 | 9,273,941 | 2016 | 0.73 | 0.73 | 9,267,557 |
| 2007 | 0.64 | 0.64 | 9,271,364 | 2017 | 0.71 | 0.71 | 9,266,453 |
| 2008 | 0.66 | 0.66 | 9,269,741 | 2018 | 0.69 | 0.69 | 9,275,119 |
| 2009 | 0.65 | 0.65 | 9,265,896 | 2019 | 0.73 | 0.73 | 9,276,933 |
| 2010 | 0.61 | 0.61 | 9,265,731 | 2020 | 0.75 | 0.75 | 9,276,528 |
Table S6
Statistical metrics for the cross-validation of carbon density between IPCC framework and two InVEST benchmark models."
| Model | r | MBE (Mg C/hm2) | MAE (Mg C/hm2) | RMSE (Mg C/hm2) |
|---|---|---|---|---|
| InVEST-A | 0.71 | 622.40 | 2797.70 | 3742.37 |
| InVEST-L | 0.71 | 1266.14 | 3057.94 | 3926.36 |
Table S7
Pearson correlation between soil organic carbon storage in this study and data from Dong et al. (2026) across different periods."
| Period | r | P value | Number of grid cells |
|---|---|---|---|
| 2001-2005 | 0.57 | 0.00 | 8,983,855 |
| 2005-2010 | 0.53 | 0.00 | 8,978,419 |
| 2010-2015 | 0.52 | 0.00 | 8,988,106 |
| 2015-2020 | 0.64 | 0.00 | 9,001,276 |
Table S8
Average trends in terrestrial ecosystem carbon density based on the Theil-Sen median trend analysis during different periods."
| Start year | Ending year | Year span (a) | Mean Theil-Sen slope of carbon density (Mg C/(hm2•a)) |
|---|---|---|---|
| 2001 | 2005 | 5 | 67.34 |
| 2005 | 2010 | 5 | 131.94 |
| 2010 | 2015 | 5 | -143.39 |
| 2015 | 2020 | 5 | 102.45 |
| 2001 | 2010 | 10 | 103.32 |
| 2010 | 2020 | 10 | -20.39 |
| 2001 | 2020 | 20 | 38.30 |
Table S9
Comparison between this study and recently published national-scale carbon storage datasets for China."
| Dataset | Method | Spatial resolution | Time range | Carbon pool | Land-use type | Validation | Difference from this study | Reference |
|---|---|---|---|---|---|---|---|---|
| This study | IPCC framework using annual LULC and carbon pool parameters | 1 km | 2001-2020 (annual) | Aboveground biomass, belowground biomass, soil organic carbon, and dead organic matter | Cropland, forestland, grassland, built-up land, and unused land | Benchmark intercomparison (e.g., InVEST) and error metrics | Annual, multi-pool, land-use types layers under IPCC-consistent accounting | This study |
| China forest aboveground biomass time series product | Deep learning/ML using GEDI samples and multisource predictors | 30 m | 1985-2023 (annual) | Aboveground biomass | Forestland | Model validation with GEDI/ independent references; uncertainty reported | Forestland-only; aboveground biomass-only; no full land-use accounting | Cai et al. ( |
| China aboveground biomass map | ML fusion of GEDI and multisource remote sensing | 30 m | 2020 | Aboveground biomass | Cropland, forestland, shrub-land, and grassland | Field/inventory comparison; accuracy metrics reported | Single year; aboveground biomass-only; not IPCC-multi-pool bookkeeping | Wang et al. ( |
| Forest biomass carbon pools | Regression and ML integrating multisource remote sensing with plot measurement; belowground biomass carbon via RF | 1 km | 2002-2021 (annual) | Aboveground biomass and belowground biomass | Forestland | Comparison with field-based estimates; consistency check with existing datasets | Forestland-only; no soil organic carbon, dead organic matter, and non-forestland types | Chen et al. ( |
| China annual soil organic carbon density gridded product | Digital soil mapping/ML | 1 km | 1985-2020 (annual) | Soil organic carbon | Not provided as land-use type carbon storage layers | Independent sample validation | Soil-only; no land-use type layers | Dong et al. ( |
| DLEM simulations for China carbon stocks | Process-based ecosystem model driven by LUCC, climate, CO2, and nitrogen | 0.5° | 1900-2019 | Vegetation and soil organic carbon | Not IPCC land-use type layers | Model evaluation versus inventories/ previous studies | Coarse; model-defined pools | Yu et al. ( |
Table S10
Global Moran’s I results for spatial autocorrelation between human footprint and carbon storage."
| Type | Moran’s I | P value | Number | Type | Moran’s I | P value | Number |
|---|---|---|---|---|---|---|---|
| Aboveground biomass carbon | 0.953591 | 0.00 | 6,863,562 | Forestland carbon | 0.897561 | 0.00 | 2,614,319 |
| Belowground biomass carbon | 0.700454 | 0.00 | 6,743,741 | Grassland carbon | 0.956997 | 0.00 | 3,193,150 |
| Soil organic carbon | 0.999012 | 0.00 | 9,334,359 | Built-up land carbon | 0.808555 | 0.00 | 257,982 |
| Dead organic matter carbon | 0.675260 | 0.00 | 101,690 | Unused land carbon | 0.969130 | 0.00 | 2,144,688 |
| Total carbon | 0.953974 | 0.00 | 9,334,805 | Human footprint | 0.951783 | 0.00 | 9,477,758 |
| Cropland carbon | 0.887608 | 0.00 | 2,293,887 |
| [1] | An Q.M., Yuan X.F., Zhang X.R., et al., 2024. Spatio-temporal interaction and constraint effects between ecosystem services and human activity intensity in Shaanxi province, China. Ecological Indicators. 160, 111937, doi: 10.1016/j.ecolind.2024.111937. |
| [2] |
Bar-On Y.M., Li X.J., O’Sullivan M., et al., 2025. Recent gains in global terrestrial carbon stocks are mostly stored in nonliving pools. Science. 387(6740), 1291-1295.
doi: 10.1126/science.adk1637 pmid: 40112055 |
| [3] |
Bonan G.B., 2008. Forests and climate change: forcings, feedbacks, and the climate benefits of forests. Science. 320(5882), 1444-1449.
doi: 10.1126/science.1155121 pmid: 18556546 |
| [4] |
Cai Y.T., Zhu P., Li X., et al., 2025. Dynamics of China’s forest carbon storage: The first 30 m annual aboveground biomass mapping from 1985 to 2023. Earth System Science Data. 17(12), 6993-7018.
doi: 10.5194/essd-17-6993-2025 |
| [5] |
Chen Y.Z., Feng X.M., Fu B.J., et al., 2023. Maps with 1 km resolution reveal increases in above- and belowground forest biomass carbon pools in China over the past 20 years. Earth System Science Data. 15(2), 897-910.
doi: 10.5194/essd-15-897-2023 |
| [6] |
Conant R.T., Paustian K., Elliott E.T., 2001. Grassland management and conversion into grassland: effects on soil carbon. Ecological Applications. 11(2), 343-355.
doi: 10.1890/1051-0761(2001)011[0343:GMACIG]2.0.CO;2 |
| [7] |
Dong Y., Wang X.T., Su W., 2026. A 1 km soil organic carbon density dataset with depth of 20 and 100 cm from 1985 to 2020 in China. Earth System Science Data. 18(2), 759-777.
doi: 10.5194/essd-18-759-2026 |
| [8] | Eggleston H.S., Goodwin J., Irving W., et al., 2006. 2006 IPCC Guidelines for National Greenhouse Gas Inventories. Hayama: Institute for Global Environmental Strategies (IGES) for the Intergovernmental Panel on Climate Change (IPCC). |
| [9] | Fang J.Y., Yu G.R., Liu L.L., et al., 2018. Climate change, human impacts, and carbon sequestration in China. Proceedings of the National Academy of Sciences. 115(16), 4015-4020. |
| [10] | Friedlingstein P., O’Sullivan M., Jones M.W., et al., 2025. Global carbon budget 2024. Earth System Science Data. 17, 965-1039. |
| [11] | Gao R.Y., Chuai X.W., Ge J.F., et al., 2022. An integrated tele-coupling analysis for requisition-compensation balance and its influence on carbon storage in China. Land Use Policy. 116, 106057, doi: 10.1016/j.landusepol.2022.106057. |
| [12] |
Guan D.J., Zhao Z.L., Tan J., 2019. Dynamic simulation of land use change based on logistic-CA-Markov and WLC-CA-Markov models: a case study in three gorges reservoir area of Chongqing, China. Environmental Science and Pollution Research. 26(20), 20669-20688.
doi: 10.1007/s11356-019-05127-9 |
| [13] | Han H.Y., Ding J.L., Wang J.J., et al., 2025. Assessing carbon storage in Xinjiang’s arid grassland ecosystems: Insights from process-based modeling. CATENA. 249, 108711, doi: 10.1016/j.catena.2025.108711. |
| [14] | He C.Y., Zhang D., Huang Q.X., et al., 2016. Assessing the potential impacts of urban expansion on regional carbon storage by linking the LUSD-urban and InVEST models. Environmental Modelling & Software. 75, 44-58. |
| [15] | Huang S.Q., Wu D.F., Pan Y.L., et al., 2024. A study on the spatiotemporal dynamics of land cover change and carbon storage in the Northern Gulf Economic Zone of Guangxi based on the InVEST model. Atmosphere. 15(11), 1332, doi: 10.3390/atmos15111332. |
| [16] |
Hubau W., Lewis S.L., Phillips O.L., et al., 2020. Asynchronous carbon sink saturation in African and Amazonian tropical forests. Nature. 579(7797), 80-87.
doi: 10.1038/s41586-020-2035-0 |
| [17] | Jemeljanova M., Kmoch A., Uuemaa E., 2024. Adapting machine learning for environmental spatial data: A review. Ecological Informatics. 81, 102634, doi: 10.1016/j.ecoinf.2024.102634. |
| [18] | Ji J.J., Huang M., Li K.R., 2008. Prediction of carbon exchanges between China terrestrial ecosystem and atmosphere in 21st century. Science in China Series D: Earth Sciences. 51(6), 885-898. |
| [19] | Jiao K.W., Liu Z.H., Wang W.J., et al., 2024. Carbon cycle responses to climate change across China’s terrestrial ecosystem: Sensitivity and driving process. Science of The Total Environment. 915, 170053, doi: 10.1016/j.scitotenv.2024.170053. |
| [20] | Lai L., Huang X.J., Yang H., et al., 2016. Carbon emissions from land-use change and management in China between 1990 and 2010. Science Advances. 2(11), e1601063, doi: 10.1126/sciadv.1601063. |
| [21] |
Law B.E., Harmon M.E., 2011. Forest sector carbon management, measurement and verification, and discussion of policy related to climate change. Carbon Management. 2(1), 73-84.
doi: 10.4155/cmt.10.40 |
| [22] | Li C., Wu Y.M., Gao B.P., et al., 2021. Multi-scenario simulation of ecosystem service value for optimization of land use in the Sichuan-Yunnan ecological barrier, China. Ecological Indicators. 132, 108328, doi: 10.1016/j.ecolind.2021.108328. |
| [23] | Li Y.Q., Wang X.Y., Chen Y.P., et al., 2019. Changes in surface soil organic carbon in semiarid degraded Horqin Grassland of northeastern China between the 1980s and the 2010s. CATENA. 174, 217-226. |
| [24] |
Liang B.Y., Wang J., Zhang Z.Y., et al., 2022. Planted forest is catching up with natural forest in China in terms of carbon density and carbon storage. Fundamental Research. 2(5), 688-696.
doi: 10.1016/j.fmre.2022.04.008 pmid: 38933132 |
| [25] | Liang X., Guan Q.F., Clarke K.C., et al., 2021. Understanding the drivers of sustainable land expansion using a patch-generating land use simulation (PLUS) model: A case study in Wuhan, China. Computers, Environment and Urban Systems. 85, 101569, doi: 10.1016/j.compenvurbsys.2020.101569. |
| [26] |
Liao Z.M., Yue C., He B.B., et al., 2024. Growing biomass carbon stock in China driven by expansion and conservation of woody areas. Nature Geoscience. 17(11), 1127-1134.
doi: 10.1038/s41561-024-01569-0 |
| [27] | Lin Y., Xiao J.T., Kou Y.P., et al., 2023. Aboveground carbon sequestration rate in alpine forests on the eastern Tibetan Plateau: impacts of future forest management options. Journal of Plant Ecology. 16(3), rtad001, doi: 10.1093/jpe/rtad001. |
| [28] | Lin Y.Y., Xu X.B., Tan Y., et al., 2025. Identifying ecosystem supply-demand response thresholds for land use optimization: A case study of the Taihu Lake Basin, China. Ecological Indicators. 175, 113569, doi: 10.1016/j.ecolind.2025.113569. |
| [29] | Liu F., Zhang G.L., Song X.D., et al., 2020. High-resolution and three-dimensional mapping of soil texture of China. Geoderma. 361, 114061, doi: 10.1016/j.geoderma.2019.114061. |
| [30] |
Liu F., Wu H.Y., Zhao Y.G., et al., 2022. Mapping high resolution National Soil Information Grids of China. Science Bulletin. 67(3), 328-340.
doi: 10.1016/j.scib.2021.10.013 pmid: 36546081 |
| [31] | Liu Z.C., Zohner C.M., Wu Z.F., et al., 2025. Diminished contribution of spring phenology to early-season carbon uptake in a changing climate. Communications Earth & Environment. 6, 206, doi: 10.1038/s43247-025-02201-8. |
| [32] | Liu M., Zhang H., Kong Z.H., et al., 2026. A 1 km-Resolution Terrestrial Carbon Storage Data for China from 2001 to 2020: Multi-Pool Integration under the IPCC Accounting Standard. [2026-04-07]. https://zenodo.org/records/19447107. |
| [33] |
Livne-Luzon S., Fox H., Cahanovitc R., et al., 2024. Context-dependent effects of below-ground carbon transfer: Limited benefits from sunlit pines to shaded oaks. Functional Ecology. 39(6), 1369-1383.
doi: 10.1111/fec.v39.6 |
| [34] |
Mokany K., Raison R.J., Prokushkin A.S., 2006. Critical analysis of root: shoot ratios in terrestrial biomes. Global Change Biology. 12(1), 84-96.
doi: 10.1111/gcb.2006.12.issue-1 |
| [35] |
Mu H.W., Li X.C., Wen Y.N., et al., 2022. A global record of annual terrestrial Human Footprint dataset from 2000 to 2018. Scientific Data. 9(1), 176, doi: 10.1038/s41597-022-01284-8.
pmid: 35440581 |
| [36] | Niu Z.E., He H.L., Peng S.S., et al., 2021. A process-based model integrating remote sensing data for evaluating ecosystem services. Journal of Advances in Modeling Earth Systems. 13(6), e2020MS002451, doi: 10.1029/2020MS002451. |
| [37] |
Peng C.H., Micharl J.A., 1997. Contribution of China to the global carbon cycle since the last glacial maximum. Reconstruction from palaeovegetation maps and an empirical biosphere model. Tellus B. 49(4), 393-408.
doi: 10.3402/tellusb.v49i4.15977 |
| [38] |
Peng Y., Wang Y.K., Fu B., et al., 2013. Spatial distribution of carbon storage function and seismic damage in Wenchuan earthquake stricken areas. Acta Ecologica Sinica. 33(3), 798-808 (in Chinese).
doi: 10.5846/stxb |
| [39] |
Piao S.L., Fang J.Y., He J.S., et al., 2004. Spatial distribution of grassland biomass in China. Chinese Journal of Plant Ecology. 28(4), 491-498 (in Chinese).
doi: 10.17521/cjpe.2004.0067 |
| [40] |
Piao S.L., He Y., Wang X.H., et al., 2022. Estimation of China’s terrestrial ecosystem carbon sink: Methods, progress and prospects. Science China Earth Sciences. 65(4), 641-651.
doi: 10.1007/s11430-021-9892-6 |
| [41] |
Qiu L.H., He J.H., Yue C., et al., 2024. Substantial terrestrial carbon emissions from global expansion of impervious surface area. Nature Communications. 15, 6456, doi: 10.1038/s41467-024-50840-w.
pmid: 39085270 |
| [42] | Randerson J.T., Li Y., Fu W.W., et al., 2025. The weak land carbon sink hypothesis. Science Advances. 11(37), eadr5489, doi: 10.1126/sciadv.adr5489. |
| [43] |
Reich B.J., Yang S., Guan Y.W., et al., 2021. A review of spatial causal inference methods for environmental and epidemiological applications. International Statistical Review. 89(3), 605-634.
doi: 10.1111/insr.12452 pmid: 37197445 |
| [44] | Su Y.J., Guo Q.H., Xue B.L., et al., 2016. Spatial distribution of forest aboveground biomass in China: Estimation through combination of spaceborne LiDAR, optical imagery, and forest inventory data. Remote Sensing of Environment. 173, 187-199. |
| [45] | Tang X.L., Zhao X., Bai Y.F., et al., 2018. Carbon pools in China’s terrestrial ecosystems: New estimates based on an intensive field survey. Proceedings of the National Academy of Sciences. 115(16), 4021-4026. |
| [46] | Wang H., Wang L.X., Li Z.W., et al., 2024c. Response of carbon storage evolution to future climate and policy at the basin scale. Environmental Science. 45(12), 6870-6880 (in Chinese). |
| [47] | Wang L.X., Zou C.X., Wang Y., et al., 2018. Carbon storage and its changes in Chinese terrestrial ecosystem in recent decades. E3S Web of Conferences. 53, 04027, doi: 10.1051/e3sconf/20185304027. |
| [48] |
Wang S.J., Zhou S.J., Fang C.L., 2024a. Spatial-temporal patterns and evolution of carbon storage in China’s terrestrial ecosystems from 1980 to 2020. Science China Earth Sciences. 67(10), 3270-3287.
doi: 10.1007/s11430-023-1385-9 |
| [49] | Wang X.Y., Zhong B., Chang B., et al., 2025. A 30 m aboveground biomass dataset for multiple vegetation types in China (2020). Scientific Data. 12(1), 1777, doi: 10.1038/s41597-025-06053-x. |
| [50] | Wang Y.H., Song C.Q., Gao Y.F., et al., 2024b. Integrating national integrated assessment model and land-use intensity for estimating China’s terrestrial ecosystem carbon storage. Applied Geography. 162, 103173, doi: 10.1016/j.apgeog.2023.103173. |
| [51] | Xiong C.S., Ren H.Y., Xu D., et al., 2024. Spatial scale effects on the value of ecosystem services in China’s terrestrial area. Journal of Environmental Management. 366, 121745, doi: 10.1016/j.jenvman.2024.121745. |
| [52] | Xu L., Yu G.R., He N.P., et al., 2018. Carbon storage in China’s terrestrial ecosystems: A synthesis. Scientific Reports. 8(1), 2806, doi: 10.1038/s41598-018-20764-9. |
| [53] | Xu L., He N.P., Yu G.R., 2019. A dataset of carbon density in Chinese terrestrial ecosystems (2010s). Science Data Bank. 2019, 4(1), doi: 10.11922/csdata.2018.0026.zh. |
| [54] |
Yang J., Huang X., 2021. The 30 m annual land cover dataset and its dynamics in China from 1990 to 2019. Earth System Science Data. 13(8), 3907-3925.
doi: 10.5194/essd-13-3907-2021 |
| [55] | Yang M.X., Yang X.C., Zhao Y., et al., 2023a. Estimated carbon storage and influencing factors of alpine grassland in the source region of the Yellow River. Acta Ecologica Sinica. 43(9), 3546-3557 (in Chinese). |
| [56] | Yang Q.L., Niu C.Y., Liu X.Q., et al., 2023b. Mapping high-resolution forest aboveground biomass of China using multisource remote sensing data. GIScience & Remote Sensing. 60(1), 2203303, doi: 10.1080/15481603.2023.2203303. |
| [57] |
Yang Y.H., Shi T., Sun W.J., et al., 2022. Terrestrial carbon sinks in China and around the world and their contribution to carbon neutrality. Science China Life Sciences. 65(5), 861-895.
doi: 10.1007/s11427-021-2045-5 |
| [58] | Yu Z., Ciais P., Piao S.L., et al., 2022. Forest expansion dominates China’s land carbon sink since 1980. Nature Communications. 13(1), 5374, doi: 10.1038/s41467-022-32961-2. |
| [59] | Zhang H.Y., Li X., Luo Y.P., et al., 2024. Spatial heterogeneity and driving mechanisms of carbon storage in the urban agglomeration within complex terrain: Multi-scale analyses under localized SSP-RCP narratives. Sustainable Cities and Society. 109, 105520, doi: 10.1016/j.scs.2024.105520. |
| [60] | Zhang Q.Y., Zhu J.X., Wang Q.F., et al., 2025. Climate and anthropogenic activities control spatiotemporal dynamics of topsoil inorganic carbon in China. Communications Earth & Environment. 6, 625, doi: 10.1038/s43247-025-02616-3. |
| [61] | Zhang T.Y., Cheng C.X., Wu X.D., 2023. Mapping the spatial heterogeneity of global land use and land cover from 2020 to 2100 at a 1 km resolution. Scientific Data. 10(1), 748, doi: 10.1038/s41597-023-02637-7. |
| [62] |
Zhao J.J., Hou P., Chen Y., 2025. Research progress on the estimation of vegetation carbon storage of grasslands in China. Chinese Journal of Ecology. 44(5), 1678-1687 (in Chinese).
doi: 10.13292/j.1000-4890.202505.044 |
| [63] | Zhao M.M., He Z.B., Du J., et al., 2019. Assessing the effects of ecological engineering on carbon storage by linking the CA-Markov and InVEST models. Ecological Indicators. 98, 29-38. |
| [64] | Zhu C., Zhao S.Q., Zhou D.C., 2012. Organic carbon storage in urban built-up areas of China in 1997-2006. Chinese Journal of Applied Ecology. 23(5), 1195-1202 (in Chinese). |
| [65] | Zhu G.F., Qiu D.D., Zhang Z.X., et al., 2021. Land-use changes lead to a decrease in carbon storage in arid region, China. Ecological Indicators. 127, 107770, doi: 10.1016/j.ecolind.2021.107770. |
| [66] | Zou T.H., Chen P., Liu J.F., et al., 2023. Spatio-temporal dynamics of territorial ecosystem carbon storage under different land use scenarios in Siping City. China Environmental Science. 43(10), 5508-5518 (in Chinese). |
| [1] | DU Mengbing, ZHANG Caijing, QIU Ning, ZHANG Zhe, LI Wen, SHAN Wanyue, ZHANG Li. Broadband China Policy can alleviate city-level carbon inequality in China [J]. Regional Sustainability, 2026, 7(3): 100349-. |
| [2] | YANG Zeyu, ZHANG Shubao, LEI Jun, ZHANG Xiaolei, TONG Yanjun, DUAN Zuliang, FAN Liqin. Evolution of economic linkage network of the cities and counties on the northern slope of the Tianshan Mountains, China [J]. Regional Sustainability, 2023, 4(2): 173-184. |
| [3] | XU Shaojie, WANG Fuyuan, WANG Kaiyong. Evaluation and optimization analysis of high-speed rail network structure in Northeast China under the background of northeast revitalization [J]. Regional Sustainability, 2021, 2(4): 349-362. |
| [4] | LONG Yulin. Export competitiveness of agricultural products and agricultural sustainability in China [J]. Regional Sustainability, 2021, 2(3): 203-210. |
| [5] | Zi’ang ZHANG, Zengxian LIANG, Jigang BAO. From theme park to cultural tourism town: Disneyization turning of tourism space in China [J]. Regional Sustainability, 2021, 2(2): 156-163. |
| [6] | Yanhua He, Yi Lin, Guohua Zhou, Yixuan Zhu, Kai Tang. Spatial pattern and drivers of urbanization in China’s mid-level developing urban agglomeration: A case study of Chang-Zhu-Tan [J]. Regional Sustainability, 2021, 2(1): 83-97. |
| [7] | Yaning Chen, Xueqi Zhang, Gonghuan Fang, Zhi Li, Fei Wang, Jingxiu Qin, Fan Sun. Potential risks and challenges of climate change in the arid region of northwestern China [J]. Regional Sustainability, 2020, 1(1): 20-30. |
| Viewed | ||||||
|
Full text |
|
|||||
|
Abstract |
|
|||||
 REGSUS Wechat
 新公网安备 65010402001202号