Regional Sustainability ›› 2023, Vol. 4 ›› Issue (2): 173-184.doi: 10.1016/j.regsus.2023.05.002
Previous Articles Next Articles
YANG Zeyua,b, ZHANG Shubaoa,b, LEI Juna,b,*( ), ZHANG Xiaoleib,c, TONG Yanjuna,b, DUAN Zulianga, FAN Liqina,b
Received:2023-02-23
Revised:2023-04-24
Accepted:2023-05-19
Published:2023-05-25
Online:2023-06-16
Contact:
LEI Jun
E-mail:leijun@ms.xjb.ac.cn
YANG Zeyu, ZHANG Shubao, LEI Jun, ZHANG Xiaolei, TONG Yanjun, DUAN Zuliang, FAN Liqin. Evolution of economic linkage network of the cities and counties on the northern slope of the Tianshan Mountains, China[J]. Regional Sustainability, 2023, 4(2): 173-184.
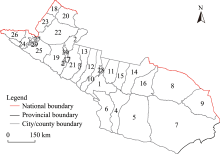
Fig. 1.
Schematic diagram of the northern slope economic belt of Tianshan Mountains (NSEBTM). 1, Urumqi City; 2, Karamay City; 3, Shihezi City; 4, Gaochang District; 5, Shanshan County; 6, Toksun County; 7, Yizhou District; 8, Barkol Kazak Autonomous County; 9, Yiwu County; 10, Changji City; 11, Fukang City; 12, Hutubi County; 13, Manas County; 14, Qitai County; 15, Jimsar County; 16, Mori Kazak Autonomous County; 17, Kuytun City; 18, Tacheng City; 19, Usu City; 20, Emin County; 21, Shawan City; 22, Toli County; 23, Yumin County; 24, Bole City; 25, Jinghe County; 26, Wenquan County; 27, Alashankou City; 28, Wujiaqu City; 29, Shuanghe City; 30, Huyanghe City."
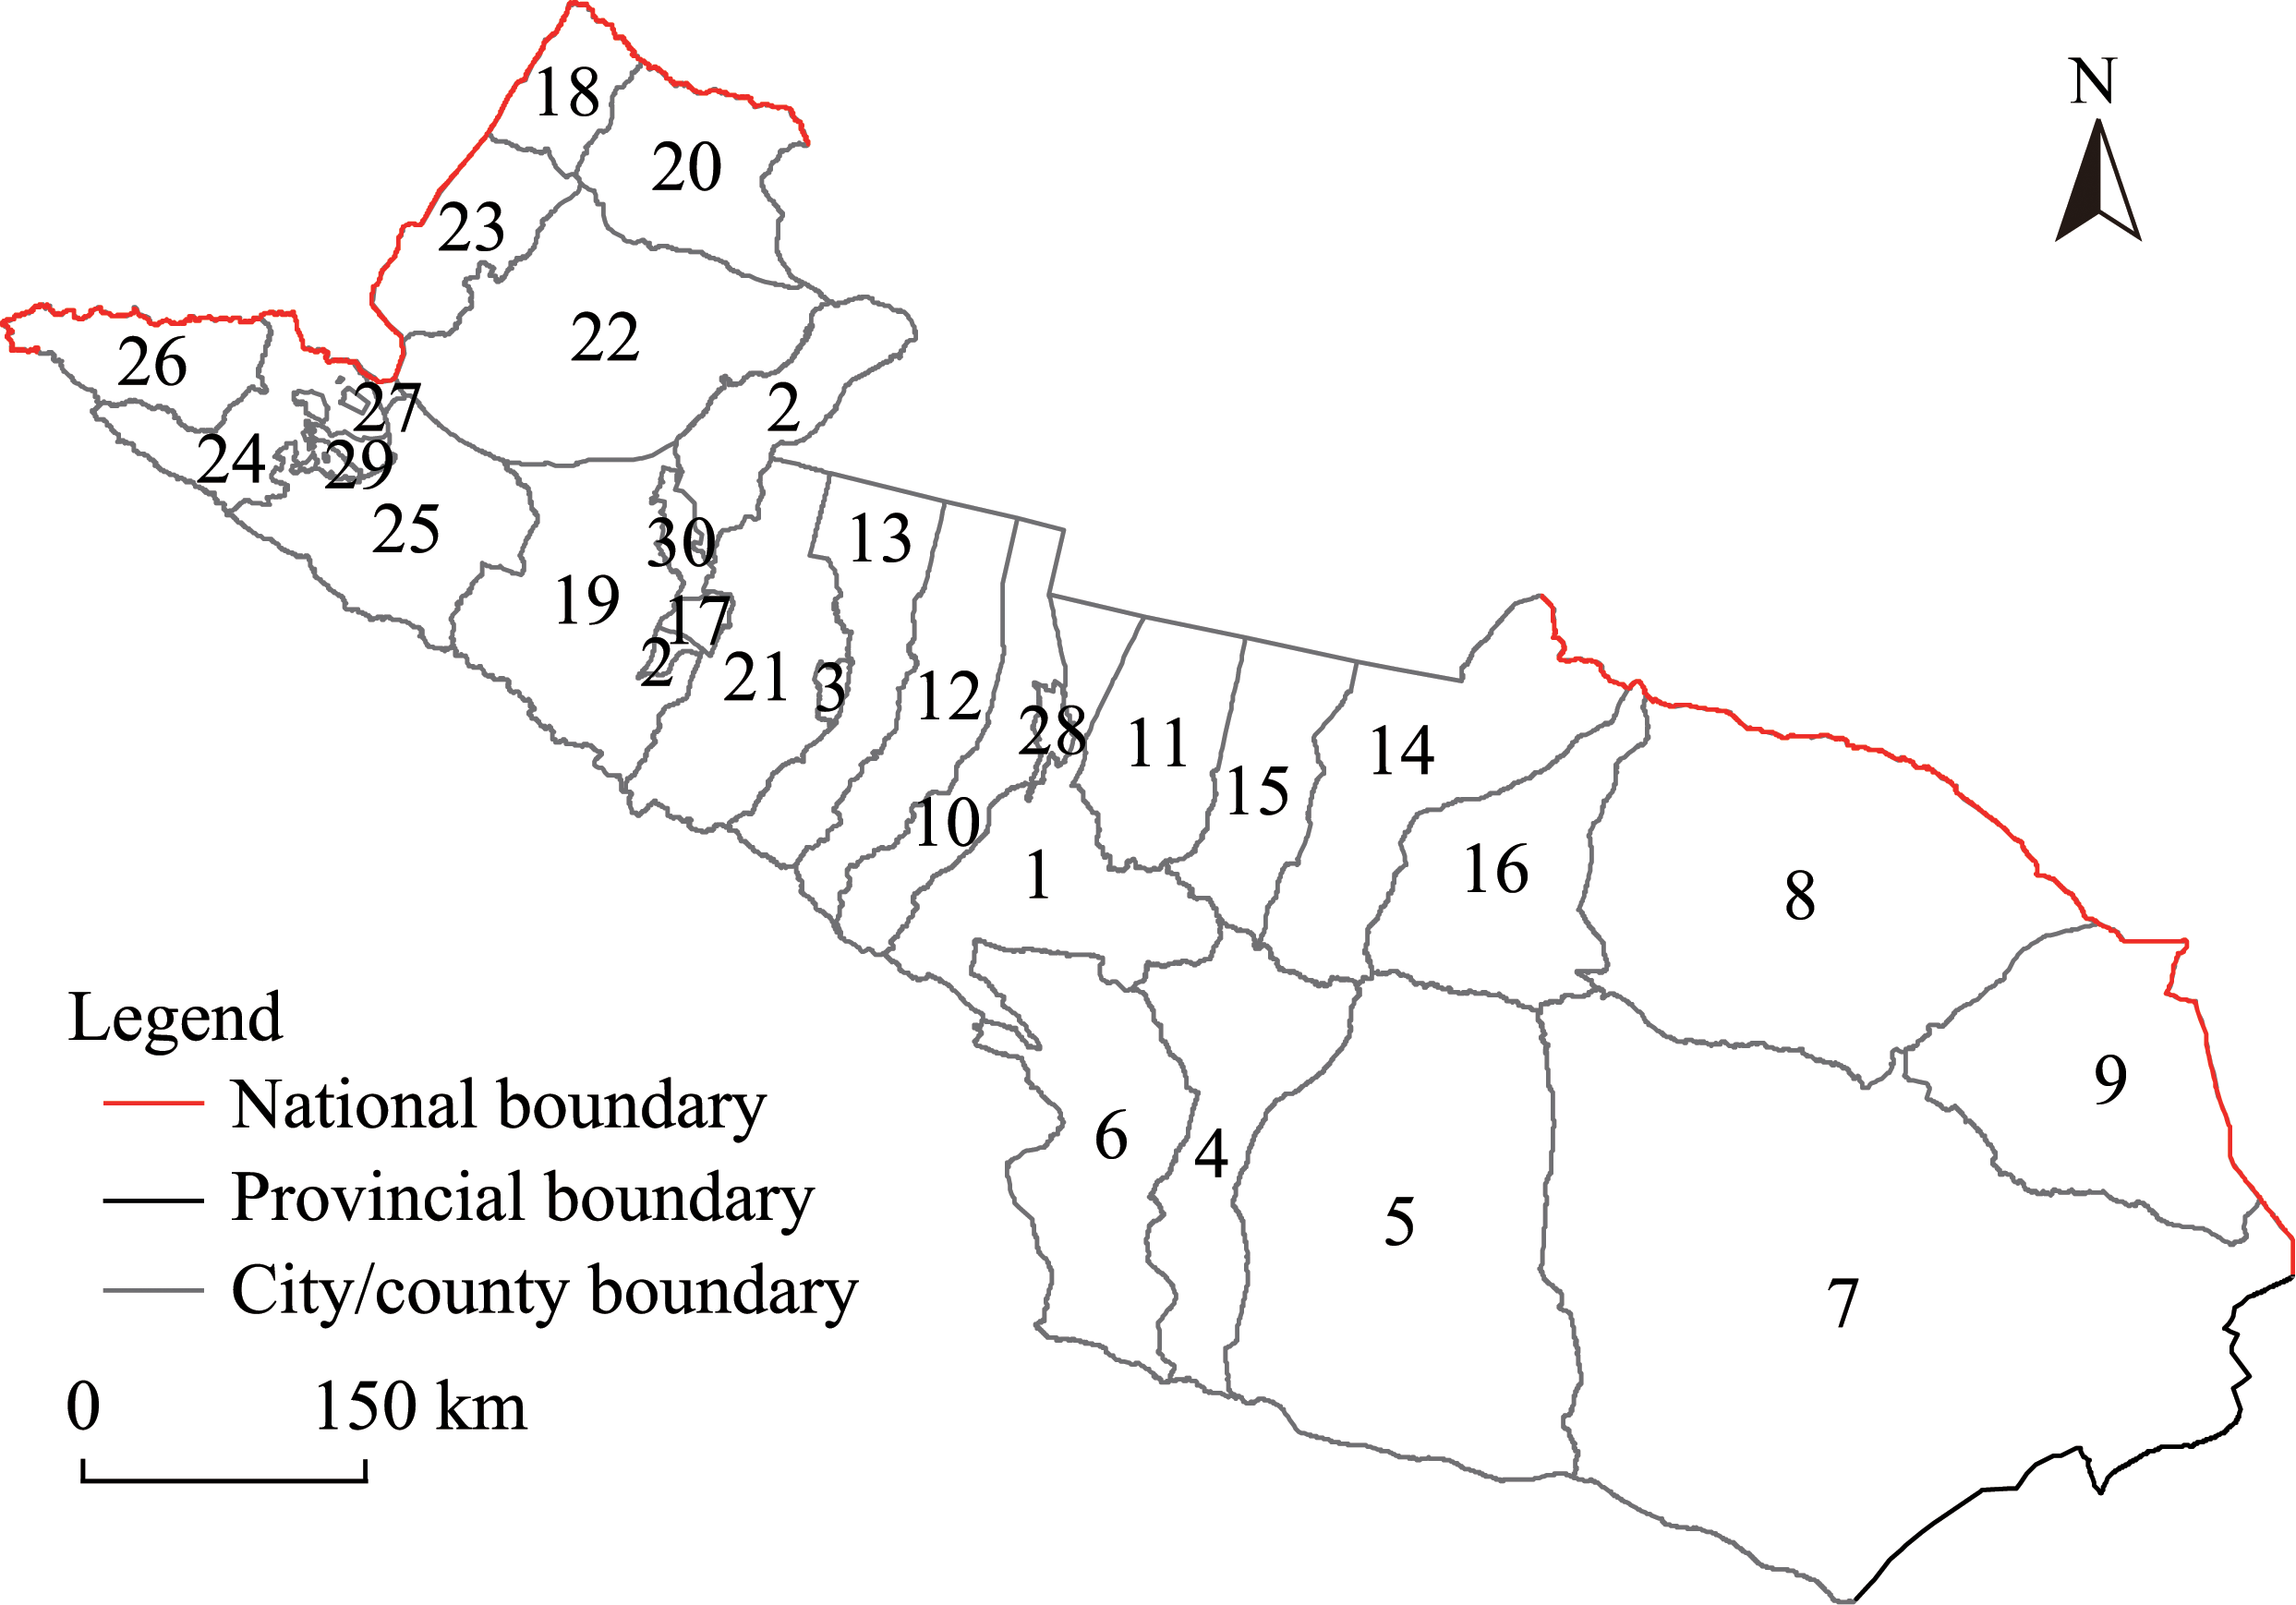
Table 1
Selected indicators of comprehensive quality development level and data sources."
| Dimension | Indicator | Unit | Data source |
|---|---|---|---|
| Economic development | GDP | ×108 CNY | Statistic Bureau of Xinjiang Uygur Autonomous Region ( |
| Per capita GDP | CNY | Statistic Bureau of Xinjiang Uygur Autonomous Region ( | |
| Proportion of non-agricultural industry output value | % | Statistic Bureau of Xinjiang Uygur Autonomous Region ( | |
| Total retail sales of consumer goods | ×105 CNY | Statistic Bureau of Xinjiang Uygur Autonomous Region ( | |
| Advanced industrial structure | % | Statistic Bureau of Xinjiang Uygur Autonomous Region ( | |
| Social development | General public budget revenue and expenditure | ×105 CNY | National Bureau of Statistics ( |
| Number of students in primary and secondary schools | National Bureau of Statistics ( | ||
| Number of beds in health institutions | National Bureau of Statistics ( | ||
| Household savings deposit balance | ×105 CNY | National Bureau of Statistics ( | |
| Population | Number of permanent residents | Statistic Bureau of Xinjiang Uygur Autonomous Region ( |
Table 2
Weight of each indicator of comprehensive quality development level."
| Indicator | Weight | Indicator direction |
|---|---|---|
| GDP | 0.12 | + |
| Per capita GDP per capita | 0.06 | + |
| Proportion of nonagricultural industry output value | 0.01 | + |
| Total retail sales of consumer goods | 0.17 | + |
| Advanced industrial structure | 0.03 | + |
| General public budget revenue and expenditure | 0.11 | + |
| Number of students in primary and secondary schools | 0.07 | + |
| Number of beds in health institutions | 0.13 | + |
| Household savings deposit balance | 0.22 | + |
| Number of permanent residents | 0.08 | + |
Table 3
Statistics of comprehensive quality development level of cities and counties on the northern slope economic belt of Tianshan Mountains (NSEBTM) in 2000, 2010, and 2020."
| Statistics | Comprehensive quality development level | |||
|---|---|---|---|---|
| 2000 | 2010 | 2020 | ||
| Average value | 3.34 | 5.44 | 10.09 | |
| Statistical extreme value | 21.15 | 44.85 | 90.55 | |
| Coefficient of variation | 1.18 | 1.56 | 1.66 | |
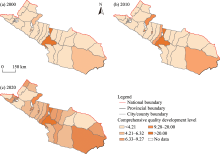
Fig. 2.
Distribution of comprehensive quality development level of cities and counties on NSEBTM in 2000 (a), 2010 (b), and 2020 (c). The shade of color represents the comprehensive quality development level; the darker the color the higher the comprehensive quality development level, thus the wider the service range."

Table 4
Statistics of the total amount of external economic linkages of cities and counties on NSEBTM in 2000, 2010, and 2020."
| Statistics | Total amount of external economic linkages | |||
|---|---|---|---|---|
| 2000 | 2010 | 2020 | ||
| Sum | 16.05 | 46.12 | 158.23 | |
| Average value | 0.62 | 1.77 | 5.86 | |
| Statistical extreme value | 7.57 | 24.64 | 88.96 | |
| Standard deviation | 1.42 | 4.68 | 16.56 | |
| Coefficient of variation | 2.30 | 2.64 | 2.83 | |
Fig. 3.
Intensity and direction map of economic linkages between cities and counties on NSEBTM in 2000 (a), 2010 (b), and 2020 (c). The line represents the economic linkage between two cities or counties, the arrow represents the direction of economic linkage, the thickness represents the intensity of economic linkage, and the color of line is based on the target city."

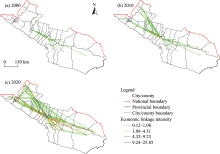
Fig. 4.
Economic linkage network of NSEBTM in 2000 (a), 2010 (b), and 2020 (c). The line represents that the economic linkage intensity between two cities or counties is greater than the average economic linkage intensity of 0.11."

Table 5
Network centrality of economic linkage network on NSEBTM in 2000, 2010, and 2020."
| Region | Degree centrality (%) | Closeness centrality (%) | Betweenness centrality (%) | ||||||
|---|---|---|---|---|---|---|---|---|---|
| 2000 | 2010 | 2020 | 2000 | 2010 | 2020 | 2000 | 2010 | 2020 | |
| Urumqi City | 64.00 | 100.00 | 100.00 | 10.00 | 100.00 | 100.00 | 39.00 | 85.11 | 25.84 |
| Karamay City | 4.00 | 44.00 | 96.15 | 9.43 | 64.10 | 96.30 | 0.00 | 4.94 | 19.23 |
| Shihezi City | 8.00 | 32.00 | 76.92 | 9.47 | 59.52 | 81.25 | 0.00 | 0.94 | 8.60 |
| Gaochang District | 4.00 | 8.00 | 26.92 | 9.43 | 52.08 | 57.78 | 0.00 | 0.00 | 0.19 |
| Shanshan County | 4.00 | 4.00 | 23.08 | 9.43 | 51.02 | 56.52 | 0.00 | 0.00 | 0.05 |
| Toksun County | 4.00 | 8.00 | 19.23 | 9.43 | 52.08 | 55.32 | 0.00 | 0.00 | 0.00 |
| Yizhou District | 4.00 | 4.00 | 26.92 | 9.43 | 51.02 | 57.78 | 0.00 | 0.00 | 0.89 |
| Barkol Kazak Autonomous County | 0.00 | 4.00 | 7.69 | - | 51.02 | 52.00 | 0.00 | 0.00 | 0.00 |
| Yiwu County | 0.00 | 4.00 | 19.23 | - | 51.02 | 55.32 | 0.00 | 0.00 | 0.05 |
| Changji City | 8.00 | 28.00 | 76.92 | 9.47 | 58.14 | 81.25 | 0.00 | 1.08 | 8.82 |
| Fukang City | 4.00 | 8.00 | 26.92 | 9.43 | 52.08 | 57.78 | 0.00 | 0.00 | 0.12 |
| Hutubi County | 8.00 | 16.00 | 30.77 | 9.47 | 54.35 | 59.09 | 0.00 | 0.00 | 0.19 |
| Manas County | 8.00 | 16.00 | 30.77 | 9.47 | 54.35 | 59.09 | 0.00 | 0.00 | 0.04 |
| Qitai County | 4.00 | 4.00 | 26.92 | 9.43 | 51.02 | 57.78 | 0.00 | 0.00 | 0.12 |
| Jimsar County | 4.00 | 4.00 | 26.92 | 9.43 | 51.02 | 57.78 | 0.00 | 0.00 | 0.12 |
| Mori Kazak Autonomous County | 4.00 | 4.00 | 19.23 | 9.43 | 51.02 | 55.32 | 0.00 | 0.00 | 0.00 |
| Kuytun City | 8.00 | 24.00 | 42.31 | 9.47 | 56.82 | 63.42 | 0.00 | 0.25 | 0.69 |
| Tacheng City | 0.00 | 8.00 | 30.77 | - | 52.08 | 59.09 | 0.00 | 0.00 | 0.34 |
| Usu City | 8.00 | 16.00 | 30.77 | 9.47 | 54.35 | 59.09 | 0.00 | 0.00 | 0.04 |
| Emin County | 0.00 | 8.00 | 26.92 | - | 52.08 | 57.78 | 0.00 | 0.00 | 0.12 |
| Shawan City | 4.00 | 16.00 | 34.62 | 9.43 | 54.35 | 60.47 | 0.00 | 0.00 | 0.14 |
| Toli County | 0.00 | 8.00 | 23.08 | - | 52.08 | 56.52 | 0.00 | 0.00 | 0.00 |
| Yumin County | 0.00 | 4.00 | 23.08 | - | 51.02 | 56.52 | 0.00 | 0.00 | 0.00 |
| Bole City | 0.00 | 4.00 | 30.77 | - | 51.02 | 59.09 | 0.00 | 0.00 | 0.36 |
| Jinghe County | 0.00 | 4.00 | 23.08 | - | 51.02 | 56.52 | 0.00 | 0.00 | 0.00 |
| Wenquan County | 0.00 | 4.00 | 15.39 | - | 51.02 | 54.17 | 0.00 | 0.00 | 0.00 |
| Alashankou City | - | - | 53.85 | - | - | 68.42 | - | - | 3.27 |
| Average | 5.85 | 14.77 | 35.90 | 6.20 | 54.99 | 62.65 | 1.50 | 3.55 | 2.56 |
| [1] | Chen M., Chen H.Q., Jiang H.B., et al., 2020. Network structure evolution of passenger railway connection in Yangtze River Delta. Economic Geography. 40(12), 63-71. (in Chinese) |
| [2] | Chen W.B., Yu G.X., Zhu M.L., 2015. Comprehensive competitiveness evaluation of county based on the geographic perspective—a case study of counties of the north slope economic belt of Xinjiang Tianshan Mountain. Chinese Journal of Agricultural Resources and Regional Planning. 36(6), 104-111. (in Chinese) |
| [3] | Cui D., Bu X.Y., Xu Z., et al., 2021. Comprehensive evaluation and impact mechanism of high-quality development of China’s resource-based cities. Acta Geographica Sinica. 76(10), 2489-2503. (in Chinese) |
| [4] | Deng M.J., 2020. Development pattern of production-living-ecological spaces and construction of a smart water network system for the Economic Belt on the North Slope of the Tianshan Mountains. Arid Land Geography. 43(5), 1155-1168. (in Chinese) |
| [5] | Fu Q.G., Liu D.J., Hu J., et al., 2015. Network structure and optimization research on the Hubei Province tourist flow. Economic Geography. 35(3), 191-196. (in Chinese) |
| [6] | Fu X.C., 2016. Analysis of the temporal-spatial features of economic linkage network on urban agglomeration of Xinjiang—Taking the economic belt on the north slope of Tianshan in Xinjiang as an example. Journal of Finance and Economics Theory. 4, 58-67. (in Chinese) |
| [7] | Gan C., Voda M., Wang K., et al., 2021. Spatial network structure of the tourism economy in urban agglomeration: A social network analysis. J. Hosp. Tour. Manag. 47, 124-133. |
| [8] | Gao C., Lei J., 2011. Economic contacts of urban agglomerations at northern slope of Tianshan Mountains. Journal of Arid Land Resources and Environment. 25(6), 24-30. (in Chinese) |
| [9] | Gao Z.G., Cai L., 2014. Temporal-spatial features of regional economic disparity along the economic belt on the northern slope of the Tianshan Mountains. Journal of Xinjiang University (Philosophy and Social Science). 42(5), 7-13. (in Chinese) |
| [10] | Geng H.X., Zhang X.L., 2014. Quantitative analysis of the economic growth quality in Jiangsu Province based on entropy method. Geography and Geo-Information Science. 30(1), 81-85, 127. (in Chinese) |
| [11] |
Gu C.L., Pang H.F., 2008. Study on spatial relations of Chinese urban system: Gravity model approach. Geographical Research. 27(1), 1-12. (in Chinese)
doi: 10.11821/yj2008010001 |
| [12] | Guo Y.Y., Hu S.G., Jin G., 2012. Evolution of spatial pattern on Hunan Province’s economic zones based on improved gravitational models of cities. Economic Geography. 32(12), 67-72, 90. (in Chinese) |
| [13] | Hall P., Pain K., 2006. The Polycentric Metropolis: Learning from Mega-City Regions in Europe (1st edition). London: Routledge, 104-112. |
| [14] |
Helbing D., Brockmann D., Chadefaux T., et al., 2015. Saving human lives: What complexity science and information systems can contribute. J. Stat. Phys. 158, 735-781.
pmid: 26074625 |
| [15] |
Huang Y., Hong T., Ma T., 2020. Urban network externalities, agglomeration economies and urban economic growth. Cities. 107, 102882, doi: 10.1016/j.cities.2020.102882.
doi: 10.1016/j.cities.2020.102882 |
| [16] |
Huo T.F., Cao R.J., Xia N.N., et al., 2022. Spatial correlation network structure of China’s building carbon emissions and its driving factors: A social network analysis method. J. Environ. Manage. 320, 115808, doi: 10.1016/j.jenvman.2022.115808.
doi: 10.1016/j.jenvman.2022.115808 |
| [17] |
Jung W.S., Wang F.Z., Stanley H.E., 2008. Gravity model in the Korean highway. A Letter Journal Exploring the Frontiers of Physics. 81(4), 48005, doi: 10.1209/0295-5075/81/48005.
doi: 10.1209/0295-5075/81/48005 |
| [18] |
Jusup M., Holme P., Kanazawa K., et al., 2022. Social physics. Physics Reports. 948, 1-148.
doi: 10.1016/j.physrep.2021.10.005 |
| [19] |
Krings G., Calabrese F., Ratti C., et al., 2009. Urban gravity: a model for inter-city telecommunication flows. J. Stat. Mech.-Theory Exp. 7, L07003, doi: 10.1088/1742-5468/2009/07/L07003.
doi: 10.1088/1742-5468/2009/07/L07003 |
| [20] |
Kurt Y., Kurt M., 2020. Social network analysis in international business research: An assessment of the current state of play and future research directions. Int. Bus. Rev. 29(2), 101633, doi: 10.1016/j.ibusrev.2019.101633.
doi: 10.1016/j.ibusrev.2019.101633 |
| [21] | Leng B.R., Yang Y.C., Li Y.J., et al., 2011. Spatial characteristics and complex analysis: A perspective from basic activities of urban networks in China. Acta Geographica Sinica. 66(2), 199-211. (in Chinese) |
| [22] | Li C., Zhong W., Wang L.G., et al., 2002. Research on economic development pole in economic belt of Tianshan north slope. Arid Land Geography. 25(4), 354-359. (in Chinese) |
| [23] | Li M.C., Wang C.X., Liu H.M., et al., 2021. Evaluation of urban development quality and characteristics of spatial connection network in the Yellow River Basin. Economic Geography. 41(12), 84-93. (in Chinese) |
| [24] | Li N., Bai L., Qiao Q., et al., 2020. Economic development, emission reduction potential, and strategy analysis of industrial green development in northern Tianshan Mountain Economic Zone. Research of Environmental Sciences. 33(2), 503-510. (in Chinese) |
| [25] | Li N., Li X.D., Liu X., et al., 2022. Evolution of spatial and temporal pattern of regional economic connection network in Xinjiang. Arid Land Geography. 45(6), 1978-1987. (in Chinese) |
| [26] | Li X.M., 2019. Measuring of internal economic relation and space difference of oasis town groups in Xinjiang. Arid Land Geography. 42(1), 180-186. (in Chinese) |
| [27] |
Li Y.T., Pan S.Q., Miao C.H., 2014. Structure and evolution of economic linkage network at county level in Central Plains Economic Zone. Geographical Research. 33(7), 1239-1250. (in Chinese)
doi: 10.11821/dlyj201407005 |
| [28] | Liu J., 2019. Lectures on Whole Network Approach:A Practical Guide to UCINET (3rd edition). Shanghai: Shanghai People’s Publishing House, 138-148. (in Chinese) |
| [29] | Liu J.Y., Yang H.L., Song Q., et al., 2014. Spatio-temporal pattern evolution of the interaction among the cities in Central Plains Economic Zone. Scientia Geographica Sinica. 34(9), 1060-1068. (in Chinese) |
| [30] | Liu K., Shen Y.M., 2014. Review of research on regional spatial interaction at home and abroad. World Regional Studies. 23(1), 73-83. (in Chinese) |
| [31] | Liu S.W., Zhang Y.L., Liu X.W., 2022. Analysis on the dynamic evolution of China’s interprovincial spatial economic development relationship—Research area centered on Xinjiang. World Regional Studies. 31(6), 1285-1297. (in Chinese) |
| [32] | Lu D.D., Chen T., 1989. Xinjiang Resources Development Comprehensive Report Set:Xinjiang Regional Economic Development Strategy. Beijing: Science Press, 76. (in Chinese) |
| [33] | Ma H.X., Zhang B.S., 2006. Economic division of Xinjiang and the shapement of north and south economic slope of Tianshan Mountain. Areal Research and Development. 25(4), 48-52, 70. (in Chinese) |
| [34] | Meijers E.J., Burger M.J., 2010. Spatial structure and productivity in US metropolitan areas. Environ. Plan. A. 42(6), 1383-1402. |
| [35] |
Meijers E.J., Burger M.J., Hoogerbrugge M.M., 2016. Borrowing size in networks of cities: City size, network connectivity and metropolitan functions in Europe. Pap. Reg. Sci. 95(1), 181-198.
doi: 10.1111/pirs.v95.1 |
| [36] |
Meng D.Y., Lu Y.Q., 2009. Strength and direction of regional economic linkage in Jiangsu Province based on gravity model. Progress in Geography. 28(5), 697-704. (in Chinese)
doi: 10.11820/dlkxjz.2009.05.007 |
| [37] | National Bureau of Statistics, 2001. China County Statistical Yearbook 2001. Beijing: China Statistics Press, 511-532. (in Chinese) |
| [38] | National Bureau of Statistics, 2011. China County Statistical Yearbook 2011. Beijing: China Statistics Press, 401-418. (in Chinese) |
| [39] | National Bureau of Statistics, 2021. China County Statistical Yearbook 2021. Beijing: China Statistics Press, 402-421. (in Chinese) |
| [40] | Ou X.J., Xue L.P., Gu W.J., 2015. Characteristic in space economic contacts of cities and counties in Jiangsu Province. Economic Geography. 35(8), 24-31. (in Chinese) |
| [41] | Qi S.D., Lei J., Duan Z.L., et al., 2016. Spatial difference and evolution of regional logistic in Silk-road Economic Belt in China. Arid Land Geography. 39(1), 207-215. (in Chinese) |
| [42] |
Qian C.L., Ye J., Lu C., 2015. Gravity zoning in Wuhan metropolitan area based on an improved urban gravity model. Progress in Geography. 34(2), 237-245. (in Chinese)
doi: 10.11820/dlkxjz.2015.02.012 |
| [43] | Qin C.L., Han M.J., 2022. Study on the multipolar-network spatial development pattern of regional economy in China. Regional Economic Review. 2, 16-22. (in Chinese) |
| [44] | Shen L.J., Cheng G.B., 2016. Comparative study on spatial connection of city groups along the silk road economic belt: a case of city groups in northwest China. Human Geography. 31(5), 126-132. (in Chinese) |
| [45] |
Shen W.R., Liang H.W., Dong L., et al., 2021. Synergistic CO2 reduction effects in Chinese urban agglomerations: Perspectives from social network analysis. Sci. Total Environ. 798, 149352, doi: 10.1016/j.scitotenv.2021.149352.
doi: 10.1016/j.scitotenv.2021.149352 |
| [46] | Statistic Bureau of Xinjiang Uygur Autonomous Region, 2001. Xinjiang Statistical Yearbook 2001. Beijing: China Statistics Press, 50-572. (in Chinese) |
| [47] | Statistic Bureau of Xinjiang Uygur Autonomous Region, 2011. Xinjiang Statistical Yearbook 2011. Beijing: China Statistics Press, 54-505. (in Chinese) |
| [48] | Statistic Bureau of Xinjiang Uygur Autonomous Region, 2021. Xinjiang Statistical Yearbook 2021. Beijing: China Statistics Press, 70-448. (in Chinese) |
| [49] |
Tang Z.P., 2018. Evaluation on Chinese provincial resource input and environmental output efficiencies from 2000 to 2015. Geographical Research. 37(8), 1515-1527. (in Chinese)
doi: 10.11821/dlyj201808004 |
| [50] | Tao J., Yang D.G., 2005. Synthesized evaluation on the sustainable development capacity of the economic belt on the northern slope of the Tianshan Mountains. Arid Land Geography. 28(6), 874-878. (in Chinese) |
| [51] |
Taylor P., Evans D., Pain K., 2008. Application of the inter-locking network model to mega-city regions: measuring polycentricity within and beyond city-regions. Reg. Stud. 42(8), 1079-1093.
doi: 10.1080/00343400701874214 |
| [52] | Tu J.J., Kuang R.R., Mao K., et al., 2021. Evaluation on high-quality development of Chengdu-Chongqing urban agglomeration. Economic Geography. 41(7), 50-60. (in Chinese) |
| [53] |
Tu J.J., Luo Y.C., Zhang Q., et al., 2019. Evolution of spatial pattern of economic linkages between cities since the 40th anniversary of reform and opening up. Economic Geography. 39(3), 1-11. (in Chinese)
doi: 10.2307/142491 |
| [54] | Wang J., Wang J.E., Sai Y.Y., 2023. Study on the evolution of network structure and coordinated development of tourism economic links in the urban agglomeration along the Silk Road. West Forum on Economy and Management. 34(1), 38-48. (in Chinese) |
| [55] |
Wang M.M., Cao X.S., 2016. The measurement of inter-county economic linkage and spatio-temporal dynamics analysis in Guanzhong-Tianshui economic region based on the traffic accessibility. Geographical Research. 35(6), 1107-1126. (in Chinese)
doi: 10.11821/dlyj201606009 |
| [56] | Wang S.M., Xu X.G., Ma J.T., et al., 2020. Spatial and temporal evolution of the tourism economy network in Xinjiang: Based on modified gravity model and social network analysis. Arid Land Geography. 43(2), 458-465. (in Chinese) |
| [57] |
Wang Y., Niu X.Y., Song X.D., 2017. Research progress of regional spatial structure under the perspective of space of flow. Urban Planning International. 32(6), 27-33. (in Chinese)
doi: 10.22217/upi |
| [58] |
Wu K., Fang C.L., Zhao M.X., 2015. The spatial organization and structure complexity of Chinese intercity networks. Geographical Research. 34(4), 711-728. (in Chinese)
doi: 10.11821/dlyj201504010 |
| [59] | Xie M.H., Bai W.N., Bai L., et al., 2017. Policy recommendations for industrial green development in the Tianshan Mountain northern slope economic belt. Strategic Study of CAE. 19(4), 79-87. (in Chinese) |
| [60] |
Xie S.G., 2020. Evolution of the structure of economic linkage network of cities and counties in Zhejiang province. World Regional Studies. 29(4), 738-749. (in Chinese)
doi: 10.3969/j.issn.1004-9479.2020.04.2019078 |
| [61] |
Xu S.J., Wang F.Y., Wang K.Y., 2021. Evaluation and optimization analysis of high-speed rail network structure in Northeast China under the background of northeast revitalization. Regional Sustainability. 2(4), 349-362.
doi: 10.1016/j.regsus.2022.01.006 |
| [62] | Yan H.L., Zhang Y.M., 2010. The function and significance of improving the strategic position of economic belt on the north slope of Tianshan Mountain to Xinjiang’s economic development. Review of Economic Research. 34, 37-42. (in Chinese) |
| [63] |
Yang W.L., Du D.B., You X.J., et al., 2017. Network structure evolution and spatial complexity of global transnational investment. Scientia Geographica Sinica. 37(9), 1300-1309. (in Chinese)
doi: 10.13249/j.cnki.sgs.2017.09.002 |
| [64] | Yang X.M., Li L.Q., Fu J.X., et al., 2018. Pattern variation of accessibility and economic linkage at county scale in Qinghai Province from 1986 to 2016. Arid Land Geography. 41(6), 1376-1387. (in Chinese) |
| [65] | Yao Z.L., Tu J.J., Niu H.M., et al., 2017. The research on urban agglomeration spatial structure of Cheng-Yu economic zone. Economic Geography. 37(1), 82-89. (in Chinese) |
| [66] | Ye S.S., Cao M.M., Hu S., 2022. Evolution of economic connection network structure in the Guanzhong Plain city cluster and its impact on economic growth. Arid Land Geography. 45(1), 277-286. (in Chinese) |
| [67] | Zhang R.T., 2017. Urban agglomeration spatial network structure spatial-temporal evolution in the Yangtze River Delta. Economic Geography. 37(2), 46-52. (in Chinese) |
| [68] | Zhang X.L., Li C.H., Du H.R., et al., 2010. Theory and Practice of the Urban System in Xinjiang. Urumqi: Xinjiang People’s Publishing House, 162. (in Chinese) |
| [69] | Zhang Y.F., Yang D.G., Zhang X.L., et al., 2008. Research on regional structure and spatial fractal characteristics of urban agglomerations at northern slope of Tianshan Mountains. Journal of Desert Research. 28(4), 795-801. (in Chinese) |
| [70] | Zhao C.F., Yang Q.Q., Zhu Y.Y., et al., 2015. Spatial relation and spatial organization of regional economy in Hunan. Economic Geography. 35(8), 53-60, 67. (in Chinese) |
| [71] | Zhao W.G., Jing L., 2015. Regional economic development difference from the perspective of new economic geography: An empirical study based on the Economic belt on the North slope of Tianshan Mountain in Xinjiang. Xinjiang State Farms Economy. 2, 65-72. (in Chinese) |
| [72] | Zheng B.M., Liu A.L., Han J.L., et al., 2021. The structural evolution of Yunnan tourism economic contact network and the construction of cooperative development model. Economic Geography. 41(2), 222-231. (in Chinese) |
| [73] |
Zheng H.L., Cao X.S., 2021. Impact of high-speed railway construction on spatial relationships in the Guanzhong Plain urban agglomeration. Regional Sustainability. 2(1), 47-59.
doi: 10.1016/j.regsus.2021.01.001 |
| [74] |
Zheng W.S., Jiang Y.P., Zhuo R.R., et al., 2016. Evolution and influencing factors of the structure of economic linkage network at county level in Anhui Province. Scientia Geographica Sinica. 36(2), 265-273. (in Chinese)
doi: 10.13249/j.cnki.sgs.2016.02.013 |
| [75] |
Zhong Y.X., Feng X.H., Wen Y.Z., 2016. The evolvement and driving mechanism of economic network structure in the Changjiang River Economic Zone. Scientia Geographica Sinica. 36(1), 10-19. (in Chinese)
doi: 10.13249/j.cnki.sgs.2016.01.002 |
| [76] | Zhou Y.X., 1998. Major direction of economic linkages: some theoretical considerations. City Planning Review. 2, 22-25, 61. (in Chinese) |
| [77] |
Zipf G.K., 1946. The P 1 P2/D hypothesis: on the intercity movement of persons. Am. Sociol. Rev. 11(6), 677-686.
doi: 10.2307/2087063 |
| [78] |
Zou L., Zeng G., Cao X.Z., et al., 2015. Research on spatial characteristic of the economic relation network of Yangtze Economic Zone. Economic Geography. 35(6), 1-7. (in Chinese)
doi: 10.2307/142075 |
| [1] | Arifah , Darmawan SALMAN, Amir YASSI, Eymal Bahsar DEMMALLINO. Knowledge flow analysis of knowledge co-production-based climate change adaptation for lowland rice farmers in Bulukumba Regency, Indonesia [J]. Regional Sustainability, 2023, 4(2): 194-202. |
| [2] | XU Shaojie, WANG Fuyuan, WANG Kaiyong. Evaluation and optimization analysis of high-speed rail network structure in Northeast China under the background of northeast revitalization [J]. Regional Sustainability, 2021, 2(4): 349-362. |
| Viewed | ||||||
|
Full text |
|
|||||
|
Abstract |
|
|||||
 REGSUS Wechat
 新公网安备 65010402001202号