
Regional Sustainability ›› 2026, Vol. 7 ›› Issue (4): 100373.doi: 10.1016/j.regsus.2026.100373
• Research article • Previous Articles Next Articles
HE Jinfenga,b,c, BAI Jiea,c,*( ), CHANG Cuna,b,d, JIN Jingyua, ZHAO Yongboa,b,c, LI Junlia,c, BAO Anminga,c, CHEN Qihaoe, SUN Huilanf,g
Received:2025-12-22
Revised:2026-04-24
Accepted:2026-07-17
Published:2026-08-30
Online:2026-08-05
Contact:
*E-mail address: baijie@ms.xjb.ac.cn (BAI Jie).
HE Jinfeng, BAI Jie, CHANG Cun, JIN Jingyu, ZHAO Yongbo, LI Junli, BAO Anming, CHEN Qihao, SUN Huilan. Crop planting structural optimization over area expansion: A pathway to sustainable oasis agriculture in arid Northwest China[J]. Regional Sustainability, 2026, 7(4): 100373.
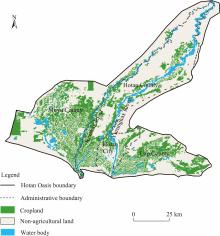
Fig. 1.
Overview of the study area. Note that the figure is based on the standard map (新S(2023)180) from the Map Service System (https://xinjiang.tianditu.gov.cn/bzdt_code/bzdt.html) issued by the Department of Natural Resources of Xinjiang Uygur Autonomous Region, and the county-level boundary of the standard map has not been modified."

Table 1
Detailed information of the remote sensing imagery."
| Data type | Image acquisition time | Number of images | Data source |
|---|---|---|---|
| GF-2 | February 2020 | 15 | China Centre for Resources Satellite Data and Applications ( |
| July 2020 | 5 | ||
| September 2020 | 15 | ||
| Sentinel-2A | March 2020 | 6 | European Space Agency (ESA; |
| April 2020 | 4 | ||
| May 2020 | 4 | ||
| June 2020 | 4 | ||
| July 2020 | 4 | ||
| August 2020 | 8 | ||
| September 2020 | 6 | ||
| October 2020 | 8 |
Table 2
Sources of statistical and planning reporting data."
| Data type | Data item | Data source |
|---|---|---|
| Statistical yearbook | Total economic benefit, total yield, planting area of each crop, crop yield, and economic benefit per unit area | Hotan Statistical Yearbook (2000-2020) (Hotan Prefecture Bureau of Statistics, |
| Fertilizer application per unit area for grain crops (corn, wheat, and rice) and cash crops (cotton and vegetable) | Compilation of Cost and Benefit of Agricultural Products in China (2021) (Price Department of the National Development and Reform Commission, | |
| Literature | Fertilizer application per unit area for fruit crops | Walnut (Zhang et al., |
| Local government report | Master plans for grain, cash, and fruit crops in Hotan City, Hotan County, Moyu County, and Lop County. | Outline of the Fourteenth Five-Year Plan for National Economic and Social Development and Vision 2035 in Hotan City ( Outline of the Fourteenth Five-Year Plan for National Economic and Social Development and Vision 2035 in Hotan County ( Outline of the Fourteenth Five-Year Plan for National Economic and Social Development and Vision 2035 in Moyu County ( Outline of the Fourteenth Five-Year Plan for National Economic and Social Development and Vision 2035 in Lop County ( |
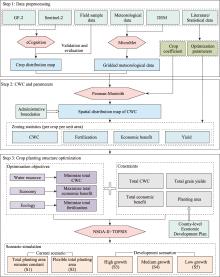
Fig. 2.
Overall technical framework. GF-2, Gaofen-2; DEM, digital elevation model; CWC, crop water consumption; NSGA-II, Non-dominated Sorting Genetic Algorithm II; TOPSIS, Technique for Order Preference by Similarity to an Ideal Solution."

Table 3
Decision variables of the optimization model."
| Category | Crop | Variable | Category | Crop | Variable |
|---|---|---|---|---|---|
| Cash crop | Cotton | x1 | Fruit-grain intercropping | Walnut-corn | x8 |
| Vegetable | x2 | Other fruit-wheat | x9 | ||
| Fruit monocropping | Walnut | x3 | Other fruit-corn | x10 | |
| Jujube | x4 | Grain monocropping | Rice | x11 | |
| Grape | x5 | Wheat | x12 | ||
| Other fruits | x6 | Corn | x13 | ||
| Fruit-grain intercropping | Walnut-wheat | x7 |
Table 4
City- or county-specific policy constraints applied in the optimization model."
| City/County | Additional constraint | City/county | Additional constraint |
|---|---|---|---|
| Hotan City | Moyu County | ||
| Hotan County | Lop County |
Table 5
Constraints applied in different scenarios."
| Scenario | Planting area limitation | Constraint formula |
|---|---|---|
| S1 | The total planting area remains constant at its current level. | |
| S2 | Flexible total planting area, allowed to increase or decrease without limitation. | |
| S3 | The total planting area for grain and cash crops increased by 10.00% compared to the current level. The total planting area for fruit crops increased by 20.00% compared to the current level. | |
| S4 | The total planting area for grain and cash crops increased by 5.00% compared to the current level. The total planting area for fruit crops increased by 15.00% compared to the current level. | |
| S5 | The total planting area for grain and cash crops increased by 2.00% compared to the current level. The total planting area for fruit crops increased by 10.00% compared to the current level. |
Table 6
Evaluation of the accuracy of the spatial distribution of the crop planting structure in the Hotan Oasis."
| Real crop type | Postclassification | |||||||||
|---|---|---|---|---|---|---|---|---|---|---|
| Monocropping walnut | Jujube | Grape | Intercropped wheat | Intercropped corn | Cotton | Rice | Total | UA (%) | ||
| Monocropping walnut | 64 | 0 | 4 | 3 | 5 | 4 | 4 | 84 | 76.19 | |
| Jujube | 0 | 263 | 6 | 1 | 3 | 2 | 2 | 277 | 94.95 | |
| Grape | 3 | 0 | 73 | 1 | 2 | 2 | 2 | 83 | 87.95 | |
| Intercropped wheat | 1 | 0 | 2 | 195 | 41 | 5 | 6 | 250 | 78.00 | |
| Intercropped corn | 2 | 0 | 1 | 43 | 185 | 4 | 7 | 242 | 76.45 | |
| Cotton | 1 | 0 | 1 | 2 | 8 | 55 | 5 | 72 | 76.39 | |
| Rice | 0 | 0 | 0 | 1 | 2 | 1 | 40 | 44 | 90.91 | |
| Total | 71 | 263 | 87 | 246 | 246 | 73 | 66 | 1052 | ||
| PA (%) | 90.14 | 100.00 | 83.91 | 79.27 | 75.20 | 75.34 | 60.61 | |||
| OA (%) | 83.17 | |||||||||
| Kappa coefficient | 0.79 | |||||||||
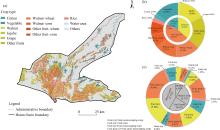
Fig. 3.
Spatial distribution and composition of major crop types in the Hotan Oasis in 2020. (a), spatial distribution major crop types in the Hotan Oasis; (b), percentage composition of the total crop area by category and sub-category in the Hotan Oasis; (c), county-level percentage composition of the total crop area by category in the Hotan Oasis. Note that Lop County does not contain grain monocropping crops. Note that the figure is based on the standard map (新S(2023)180) from the Map Service System (https://xinjiang.tianditu.gov.cn/bzdt_code/bzdt.html) issued by the Department of Natural Resources of Xinjiang Uygur Autonomous Region, and the county-level boundary of the standard map has not been modified."

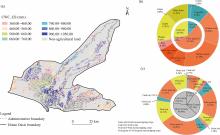
Fig. 4.
Spatial distribution and composition of CWC_GS (growing-season CWC) for major crop types in the Hotan Oasis in 2020. (a), spatial distribution of the CWC for major crop types in the Hotan Oasis; (b), percentage composition of the total CWC by crop category and sub-category in the Hotan Oasis; (c), county-level percentage composition of the total CWC by crop category in the Hotan Oasis. Note that Lop County does not contain CWC of grain monocropping crops. Note that the figure is based on the standard map (新S(2023)180) from the Map Service System (https://xinjiang.tianditu.gov.cn/bzdt_code/bzdt.html) issued by the Department of Natural Resources of Xinjiang Uygur Autonomous Region, and the county-level boundary of the standard map has not been modified."

Table 7
Crop water consumption (CWC) for the city and counties of the Hotan Oasis in 2020."
| Crop type | CWC per unit area (mm) | ||||
|---|---|---|---|---|---|
| Hotan City | Hotan County | Moyu County | Lop County | Average | |
| Cotton | 541.86±2.09 | 546.34±3.44 | 540.22±1.94 | 539.02±0.90 | 541.86±3.21 |
| Vegetable | 379.73±5.01 | 386.20±2.80 | 383.75±2.95 | 380.91±3.18 | 382.65±2.91 |
| Walnut | 738.60±4.93 | 747.47±10.94 | 761.24±10.37 | 742.15±11.17 | 747.36±9.94 |
| Jujube | 539.30±8.50 | 544.39±9.08 | 549.77±2.46 | 545.87±2.47 | 544.83±4.33 |
| Grape | 465.21±6.24 | 477.51±3.67 | 486.84±1.61 | 480.48±3.17 | 477.51±9.07 |
| Other fruit | 397.51±5.44 | 400.05±5.07 | 401.82±3.84 | 397.65±4.76 | 399.26±2.07 |
| Walnut-wheat | 1003.62±8.79 | 1008.65±12.16 | 1017.73±6.97 | 1004.11±8.98 | 1008.53±6.54 |
| Walnut-corn | 913.05±7.62 | 927.01±11.37 | 923.74±6.66 | 913.33±8.10 | 919.28±7.16 |
| Other fruit-wheat | 791.99±7.18 | 789.08±8.66 | 800.78±6.23 | 790.83±7.48 | 793.17±5.21 |
| Other fruit-corn | 701.42±5.69 | 707.44±7.52 | 706.80±5.88 | 700.05±6.40 | 703.93±3.73 |
| Rice | 1034.17±3.34 | 1029.31±4.56 | 1025.90±3.41 | 1029.79±3.77 | 1029.79±3.40 |
| Wheat | 554.02±6.74 | 553.06±8.14 | 561.04±5.54 | 553.36±6.85 | 555.37±3.80 |
| Corn | 463.45±5.11 | 471.42±6.91 | 467.05±5.15 | 462.58±5.65 | 466.13±4.02 |
Table 8
Comparison of the crop planting structure optimization results under scenarios S1-S5 with the current crop planting structure (S0) in the Hotan Oasis."
| Variable | Unit | S0 | S1 | S2 | S3 | S4 | S5 |
|---|---|---|---|---|---|---|---|
| Cotton | 104 hm2 | 0.57 | 0.51 | 0.41 | 0.61 | 0.64 | 0.55 |
| Vegetable | 104 hm2 | 3.60 | 4.47 | 4.65 | 3.68 | 3.83 | 3.78 |
| Walnut | 104 hm2 | 0.57 | 0.46 | 0.42 | 0.57 | 0.59 | 0.79 |
| Jujube | 104 hm2 | 3.37 | 2.45 | 2.41 | 3.50 | 4.25 | 4.28 |
| Grape | 104 hm2 | 0.20 | 0.26 | 0.26 | 0.28 | 0.28 | 0.27 |
| Other fruits | 104 hm2 | 4.60 | 4.47 | 3.22 | 7.17 | 6.30 | 5.26 |
| Walnut-wheat | 104 hm2 | 3.55 | 3.42 | 4.23 | 3.03 | 2.86 | 2.97 |
| Walnut-corn | 104 hm2 | 3.10 | 3.71 | 3.29 | 3.72 | 3.28 | 3.13 |
| Other fruit-wheat | 104 hm2 | 1.95 | 1.38 | 1.37 | 2.38 | 1.93 | 2.54 |
| Other fruit-corn | 104 hm2 | 1.88 | 1.71 | 1.70 | 2.42 | 2.61 | 1.91 |
| Rice | 104 hm2 | 0.61 | 0.78 | 0.60 | 0.90 | 0.86 | 0.69 |
| Wheat | 104 hm2 | 0.00 | 0.25 | 0.10 | 0.01 | 0.00 | 0.00 |
| Corn | 104 hm2 | 0.00 | 0.13 | 0.03 | 0.03 | 0.00 | 0.00 |
| Total crop area | 104 hm2 | 23.99 | 23.99 | 22.69 | 28.29 | 27.44 | 26.15 |
| Fruit-grain intercropping | 104 hm2 | 10.47 | 10.22 | 10.59 | 11.55 | 10.68 | 10.54 |
| Fruit monocropping | 104 hm2 | 8.74 | 7.64 | 6.30 | 11.51 | 11.42 | 10.59 |
| Grain monocropping | 104 hm2 | 0.61 | 1.16 | 0.73 | 0.94 | 0.87 | 0.69 |
| Cash crops | 104 hm2 | 4.17 | 4.98 | 5.06 | 4.29 | 4.47 | 4.33 |
| CWC | 108 m3 | 15.85 | 15.86 | 15.43 | 18.19 | 17.49 | 16.94 |
| Economic benefit | 108 CNY | 81.18 | 86.70 | 85.51 | 88.95 | 87.88 | 87.13 |
| Fertilizer application | 108 kg | 2.29 | 2.19 | 2.07 | 2.75 | 2.65 | 2.53 |
| Grain yield | 108 kg | 4.53 | 4.63 | 4.61 | 5.08 | 4.66 | 4.65 |
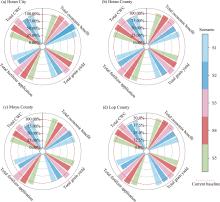
Fig. 5.
Relative changes in key indicators (economic benefit, grain yield, CWC, and fertilizer application) for Hotan City (a), Hotan County (b), Moyu County (c), and Lop County (d) versus the current baseline (red dotted line)."

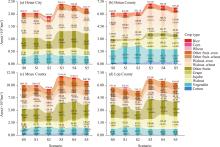
Fig. 6.
Crop planting area under current (S0) and optimized (S1-S5) scenarios in Hotan City (a), Hotan County (b), Moyu Ccounty (c), and Lop County (d)."

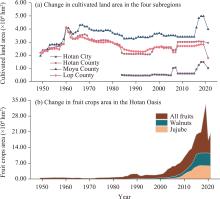
Fig. 7.
Changes in the cultivated land area in the four subregions (a) and fruit crops area (b) in the Hotan Oasis from 1949 to 2021."

Table S1
Crop coefficient (Kc) values for major crops across different growth stages in the Hotan Oasis."
| Crop | Kc across different growth stages | |||||
|---|---|---|---|---|---|---|
| Walnut | Bud (0.40) | Flowering (0.45) | Swelling (0.50) | Hardening (0.58) | Oil conversion (0.64) | Maturity (0.50) |
| Grape | Shoot growth (0.30) | Swelling (0.55) | Maturity (0.60) | |||
| Jujube | Bud (0.36) | Flowering (0.35) | Fruit set (0.63) | Swelling (0.99) | Maturity (0.30) | |
| Other fruits (apricot) | Bud (0.28) | Flowering (0.35) | Fruit set (0.40) | Swelling (0.50) | Hard core (0.45) | Maturity (0.90) |
| Vegetables | Seedling (0.15) | Vegetative growth (0.40) | Swelling (0.50) | Maturity (0.30) | ||
| Rice | Seedling (0.37) | Leaf development (1.00) | Jointing (1.30) | Heading (1.60) | Grain filling (1.50) | Maturity (0.60) |
| Wheat | Initial growth (0.18) | Rapid growth (0.18-1.18) | Mid-growth (1.18) | Maturity (1.16-0.40) | ||
| Corn | Initial growth (0.21) | Rapid growth (0.21-1.10) | Mid-growth (1.10) | Maturity (1.10-0.35) | ||
| Cotton | Initial growth (0.26) | Rapid growth (0.26-1.20) | Mid-growth (1.20) | Maturity (1.20-0.70) | ||
Table S2
Economic benefit per unit area for different crops in the Hotan Oasis."
| Crop | Economic benefit per unit area (CNY/hm2) | |||
|---|---|---|---|---|
| Hotan City | Hotan County | Moyu County | Lop County | |
| Rice | 20,736.22 | 13,587.99 | 17,738.71 | 17,354.31 |
| Cotton | 20,447.65 | 13,146.20 | 32,719.74 | 16,354.84 |
| Vegetable | 204,759.63 | 48,033.57 | 59,128.74 | 62,880.95 |
| Walnut | 11,026.81 | 22,073.50 | 34,769.32 | 27,753.86 |
| Jujube | 20,019.85 | 21,247.99 | 33,446.01 | 29,202.93 |
| Grape | 23,718.01 | 36,395.97 | 106,040.99 | 33,916.67 |
| Other fruits | 2223.49 | 23,033.49 | 5532.71 | 17,783.74 |
| Walnut-wheat | 21,005.15 | 33,926.04 | 45,757.66 | 43,372.30 |
| Walnut-corn | 17,329.85 | 70,659.62 | 40,531.17 | 34,208.52 |
| Other fruit-wheat | 12,201.83 | 34,886.04 | 16,521.05 | 33,402.18 |
| Other fruit-corn | 8526.52 | 71,619.62 | 11,294.56 | 24,238.41 |
| Wheat | 9978.34 | 11,852.54 | 10,988.34 | 15,618.44 |
| Corn | 6303.04 | 48,586.12 | 5761.85 | 6454.66 |
Table S3
Grain yield per unit area for different crops in the Hotan Oasis."
| Crop | Grain yield per unit area (kg/hm2) | |||
|---|---|---|---|---|
| Hotan City | Hotan County | Moyu County | Lop County | |
| Rice | 9146.40 | 5782.05 | 6105.00 | 7011.15 |
| Cotton | 0.00 | 0.00 | 0.00 | 0.00 |
| Vegetable | 0.00 | 0.00 | 0.00 | 0.00 |
| Walnut | 0.00 | 0.00 | 0.00 | 0.00 |
| Jujube | 0.00 | 0.00 | 0.00 | 0.00 |
| Grape | 0.00 | 0.00 | 0.00 | 0.00 |
| Other fruits | 0.00 | 0.00 | 0.00 | 0.00 |
| Walnut-wheat | 4073.40 | 4827.90 | 4485.00 | 5044.65 |
| Walnut-corn | 5312.10 | 4284.00 | 2400.00 | 2593.95 |
| Other fruit-wheat | 4073.40 | 4827.90 | 4485.00 | 5044.65 |
| Other fruit-corn | 5312.10 | 4284.00 | 2400.00 | 2593.95 |
| Wheat | 4073.40 | 4827.90 | 4485.00 | 5044.65 |
| Corn | 5312.10 | 4284.00 | 2400.00 | 2593.95 |
Table S4
Fertilizer application per unit area for different crops in the Hotan Oasis."
| Crop | Fertilizer application per unit area (kg/hm2) | |||
|---|---|---|---|---|
| Hotan City | Hotan County | Moyu County | Lop County | |
| Rice | 483.75 | 483.75 | 483.75 | 483.75 |
| Cotton | 931.80 | 931.80 | 931.80 | 931.80 |
| Vegetable | 716.96 | 716.96 | 716.96 | 716.96 |
| Walnut | 380.35 | 380.35 | 380.35 | 380.35 |
| Jujube | 1005.00 | 1005.00 | 1005.00 | 1005.00 |
| Grape | 817.50 | 817.50 | 817.50 | 817.50 |
| Other fruits | 1050.00 | 1050.00 | 1050.00 | 1050.00 |
| Walnut-wheat | 856.00 | 856.00 | 856.00 | 856.00 |
| Walnut-corn | 728.50 | 728.50 | 728.50 | 728.50 |
| Other fruit-wheat | 1525.65 | 1525.65 | 1525.65 | 1525.65 |
| Other fruit-corn | 1398.15 | 1398.15 | 1398.15 | 1398.15 |
| Wheat | 475.65 | 475.65 | 475.65 | 475.65 |
| Corn | 348.15 | 348.15 | 348.15 | 348.15 |
Table S5
Weight combinations used in the sensitivity analysis."
| Combination | Weight scheme | Description |
|---|---|---|
| 1 | (0.40, 0.30, 0.30) | Emphasizes CWC, with moderate emphasis on economic benefit and fertilizer application |
| 2 | (0.30, 0.40, 0.30) | Emphasizes economic benefit, with moderate emphasis on CWC and fertilizer application |
| 3 | (0.30, 0.30, 0.40) | Emphasizes fertilizer application, with moderate emphasis on CWC and economic benefit |
| 4 | (0.50, 0.25, 0.25) | Strongly emphasizes CWC |
| 5 | (0.25, 0.50, 0.25) | Strongly emphasizes economic benefit |
| 6 | (0.25, 0.25, 0.50) | Strongly emphasizes fertilizer application |
| 7 | (1/3, 1/3, 1/3) | Equal weights for all criteria |
Table S6
Stability of the optimal solution under different weight schemes."
| City/County | Optimal solution under equal weights | Variation of optimal solution under other weights | Stability |
|---|---|---|---|
| Hotan City | 30 | Remains 30 | Stable |
| Hotan County | 42 | Changes among 2, 12, 31, 42, 73, and 87 | Unstable |
| Moyu County | 3 | Remains 3 | Stable |
| Lop County | 2 | Changes among 2, 69, 85, and 101 | Unstable |
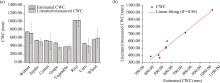
Fig. S1.
Estimated and literature/measured crop water consumption (CWC) values for major crops in Aksu Prefecture, Hotan Prefecture, and Kashgar Prefecture. (a), estimated and literature/measured CWC for major crops; (b), scatter plot of estimated and literature/measured CWC. Bars mean standard errors."

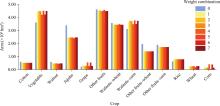
Fig. S2.
Variation in optimized cropping structure in the Hotan Oasis under different weight combinations in total planting area remains constant scenario (S1). “0” represents the current situation, and “1-7” denote different weighting combinations (see Table S5)."

| [1] | Al-Majali B.H., Zobaa A.F., 2025. Analyzing bi-objective optimization Pareto fronts using square shape slope index and NSGA-II: A multi-criteria decision-making approach. Expert Systems with Applications. 272, 126765, doi: 10.1016/j.eswa.2025.126765. |
| [2] | Allen R.G., Pereira L.S., Raes D., et al., 1998. Crop Evapotranspiration-Guidelines for Computing Crop Water Requirements-Food and Agriculture Organization of the United Nations (FAO) Irrigation and Drainage Paper 56. Rome: FAO. |
| [3] |
Boser A., Caylor K., Larsen A., et al., 2024. Field-scale crop water consumption estimates reveal potential water savings in California agriculture. Nature Communications. 15, 2366, doi: 10.1038/s41467-024-46031-2.
pmid: 38528086 |
| [4] | Dariane A.B., Ghasemi M., Karami F., et al., 2021. Crop pattern optimization in a multi-reservoir system by combining many-objective and social choice methods. Agricultural Water Management. 257, 107162, doi: 10.1016/j.agwat.2021.107162. |
| [5] |
Deb K., Pratap A., Agarwal S., et al., 2002. A fast and elitist multiobjective genetic algorithm: NSGA-II. IEEE Transactions on Evolutionary Computation. 6(2), 182-197.
doi: 10.1109/4235.996017 |
| [6] | Feng M.Q., Chen Y.N., Li Z., et al., 2024. Optimisation model for sustainable agricultural development based on water-energy-food nexus and CO2 emissions: A case study in Tarim river basin. Energy Conversion and Management. 303, 118174, doi: 10.1016/j.enconman.2024.118174. |
| [7] | Hotan Prefecture Bureau of Statistics, 2001-2021. Hotan Statistical Yearbook (2000-2020). Hotan: Hotan Prefecture Bureau of Statistics (in Chinese). |
| [8] | Li B.F., Gui D.W., Xue D.P., et al., 2022. Analysis of the expansion characteristics and carrying capacity of oasis farmland in Northwestern China in recent 40 years. Agronomy. 12(10), 2448, doi: 10.3390/agronomy12102448. |
| [9] | Li C.J., Fu B.J., Wang S., et al., 2021. Drivers and impacts of changes in China’s drylands. Nature Reviews Earth & Environment. 2, 858-873. |
| [10] | Li M., Li H.Y., Zhou Z.Q., et al., 2024. Spatial simulation and optimization of cropping structure under climate and land use change conditions considering synergistic economic benefits and carbon reduction in crop growth processes. Earth’s Future. 12(10), e2024EF004684, doi: 10.1029/2024EF004684. |
| [11] | Li Y.X., Liao K., Wang G.Z., et al., 2012. Effects of different combination ratios of N, P and K fertilizer on growth of Armeniaca Vulgaris ‘Luntaibaixing’. Xinjiang Agricultural Sciences. 49(2), 216-222 (in Chinese). |
| [12] |
Liston G.E., Elder K., 2006. A meteorological distribution system for High-Resolution Terrestrial Modeling (MicroMet). Journal of Hydrometeorology. 7(2), 217-234.
doi: 10.1175/JHM486.1 |
| [13] | Liu S.N., 2021. Study on efficient management technology of water and fertilizerintegration of jujube in sandy soil of Kunyu City. MSc Thesis. Shihezi: Shihezi University (in Chinese). |
| [14] | Liu Y.Q., Song W., 2020. Modelling crop yield, water consumption, and water use efficiency for sustainable agroecosystem management. Journal of Cleaner Production. 253, 119940, doi: 10.1016/j.jclepro.2019.119940. |
| [15] | Luo J.M., Zhang H.M., Qi Y.Q., et al., 2022. Balancing water and food by optimizing the planting structure in the Beijing-Tianjin-Hebei region, China. Agricultural Water Management. 262, 107326, doi: 10.1016/j.agwat.2021.107326. |
| [16] | Ma Q.T., Yang Y.H., Sheng Z.P., et al., 2022. Hydro-economic model framework for achieving groundwater, food, and economy trade-offs by optimizing crop patterns. Water Research. 226, 119199, doi: 10.1016/j.watres.2022.119199. |
| [17] |
Mohammadzadeh A., Vafabakhsh J., Mahdavi Damghani A., et al., 2022. Optimal land allocation to crop production in different decision priorities and water availability scenarios: East Azerbaijan Province of Iran. Archives of Agronomy and Soil Science. 68(5), 597-614.
doi: 10.1080/03650340.2020.1843637 |
| [18] | National Bureau of Statistics of China, 2020. Classification of Agricultural and Related Industries Statistics (2020) (Order No. 32 of the National Bureau of Statistics). Beijing: National Bureau of Statistics of China (in Chinese). |
| [19] | Price Department of the National Development and Reform Commission, 2021 National Agricultural Product Cost-Benefit Data Compilation 2021. Beijing: China Statistics Press (in Chinese). |
| [20] |
Randall M., Schiller K., Lewis A., et al., 2024. A systematic review of crop planning optimisation under climate change. Water Resources Management. 38(6), 1867-1881.
doi: 10.1007/s11269-024-03758-3 |
| [21] |
Reynolds J.F., Stafford Smith D.M., Lambin E.F., et al., 2007. Global desertification: Building a science for dryland development. Science. 316(5826), 847-851.
doi: 10.1126/science.1131634 pmid: 17495163 |
| [22] | Richter B.D., Ao Y., Lamsal G., et al., 2023. Alleviating water scarcity by optimizing crop mixes. Nature Water. 1, 1035-1047. |
| [23] | Ruan H.W., Yu J.J., Wang P., et al., 2023. Relieving water stress by optimizing crop structure is a practicable approach in arid transboundary rivers of Central Asia. Agricultural Water Management. 275, 108055, doi: 10.1016/j.agwat.2022.108055. |
| [24] | Shi W.J., Wang M.L., Tao F.L., et al., 2024. Wheat redistribution in Huang-Huai-Hai, China, could reduce groundwater depletion and environmental footprints without compromising production. Communications Earth & Environment. 5, 380, doi: 10.1038/s43247-024-01547-9. |
| [25] | Sun J.X., Yang Y.L., Qi P., et al., 2024. Development and application of a new water-carbon-economy coupling model (WCECM) for optimal allocation of agricultural water and land resources. Agricultural Water Management. 291, 108608, doi: 10.1016/j.agwat.2023.108608. |
| [26] | United Nations Convention to Combat Desertification (UNCCD), 2017. Global Land Outlook 2017. [2025-03-21]. https://www.unccd.int/resources/global-land-outlook/glo1. |
| [27] | Wang H.Y., Chen R.W., Wang J., et al., 2025. Optimization of cropping structure of staple crops and benefit evaluation based on carbon-water footprint in the black soil region of Northeast China. Agricultural Water Management. 321, 109898, doi: 10.1016/j.agwat.2025.109898. |
| [28] | Wang L., Du X., Wang R., et al., 2021. Optimization of the planting structure in the upstream region of Baiyangdian Lake based on the non-dominated sorting genetic algorithm (NSGA-Ⅱ). Chinese Journal of Eco-Agriculture. 29(8), 1370-1383. |
| [29] |
Wu F., Liang Y.J., Liu L.J., et al., 2023. Identifying eco-functional zones on the Chinese Loess Plateau using ecosystem service bundles. Regional Sustainability. 4(4), 425-440.
doi: 10.1016/j.regsus.2023.11.005 |
| [30] | Wu H.W., Li Z.H., Deng X.Z., et al., 2025. Enhancing agricultural sustainability: Optimizing crop planting structures and spatial layouts within the water-land-energy-economy-environment-food nexus. Geography and Sustainability. 6(3), 100258, doi: 10.1016/j.geosus.2024.100258. |
| [31] | Xie W., Zhu A.F., Ali T., et al., 2023. Crop switching can enhance environmental sustainability and farmer incomes in China. Nature. 616, 300-305. |
| [32] |
Xu Y.B., Hou Y.F., Zhu C.G, 2023. Characteristics and matching analysis of water and soil resources development and utilization in Hotan Area, Xinjiang. Journal of Water Resources Research. 12(1), 27-35.
doi: 10.12677/JWRR.2023.121004 |
| [33] |
Yin L.C., Tao F.L., Chen Y., et al., 2023. Novel cropping-system strategies in China can increase plant protein with higher economic value but lower greenhouse gas emissions and water use. One Earth. 6(5), 560-572.
doi: 10.1016/j.oneear.2023.04.010 |
| [34] | Yuan Y.J., Wang J.C., Gao X.R., et al., 2025. Optimizing planting management practices considering a suite of crop water footprint indicators —A case-study of the Fengjiashan Irrigation District. Agricultural Water Management. 307, 109261, doi: 10.1016/j.agwat.2024.109261. |
| [35] | Zhang J., Xu Y.M., Zhu Q.Q., et al., 2023a. Calculation of fertilizer effects and recommended fertilizer amount of walnut in southern Xinjiang. Soil and Fertilizer Sciences in China. (3), 65-72 (in Chinese). |
| [36] | Zhang X.Q., Liu L.N., Qi J., et al., 2023b. Comparison analysis of integrated water and fertilizer management technology for grapes in Hotan Region, Xinjiang with traditional water and fertilizer management methods. Bulletin of Agricultural Science and Technology. (3), 49-50, 153 (in Chinese). |
| [37] | Zhao N., Zheng X.J., Zhao B., et al., 2025. Does water-saving irrigation truly conserve water? Yes and No. Agricultural Water Management. 311, 109399, doi: 10.1016/j.agwat.2025.109399. |
| No related articles found! |
| Viewed | ||||||
|
Full text |
|
|||||
|
Abstract |
|
|||||
 REGSUS Wechat
 新公网安备 65010402001202号