Regional Sustainability ›› 2025, Vol. 6 ›› Issue (2): 100209.doi: 10.1016/j.regsus.2025.100209cstr: 32279.14.REGSUS.2025008
• Research article • Next Articles
Saul NGARAVAa,b,*( ), Alois Aldridge MUGADZAc,d
Received:2024-10-03
Revised:2025-01-08
Accepted:2025-03-21
Published:2025-04-30
Online:2025-05-21
Contact:
*E-mail address: s.ngarava@uu.nl (Saul NGARAVA).
Saul NGARAVA, Alois Aldridge MUGADZA. Renewable energy and its impact on agricultural and economic development in the Netherlands and South Africa[J]. Regional Sustainability, 2025, 6(2): 100209.
Table 1
Descriptive statistics of the selected variables in the Netherlands and South Africa."
| Variable | Abbreviation | Data source | Levene’s test for equality of variance | t-test for equality of mean | ||||
|---|---|---|---|---|---|---|---|---|
| F-statistic | Significance | t-statistic | Significance | Mean difference | Standard error difference | |||
| Renewable energy consumption (kW•h) | RE | FAOSTAT ( | 52.41 | 0.00 | -2.52 | 0.00 | -3.12×10¹⁰ | 1.24×10¹⁰ |
| Economic diversification index | EDI | Harvard Kennedy School ( | 5.70 | 0.02 | 20.58 | 0.00 | 32.60 | 1.58 |
| Gross domestic product (USD) | GDP | World Bank ( | 31.14 | 0.00 | -8.88 | 0.00 | -4.02×10¹¹ | 0.45×10¹¹ |
| Urban population (persons) | URB | World Bank ( | 35.25 | 0.00 | 16.15 | 0.00 | 1.68×10⁷ | 0.10×10⁷ |
| Trade balance (USD) | TB | WITS ( | 42.00 | 0.00 | -9.72 | 0.00 | -4.22×10⁶ | 0.43×10⁶ |
| Total water extraction for agricultural withdrawal (m3) | WE | FAOSTAT ( | 36.30 | 0.00 | 36.02 | 0.00 | 9.16×10⁹ | 0.25×10⁹ |
| Value of agricultural production (USD) | AP | FAOSTAT ( | 0.35 | 0.56 | -13.11 | 0.00 | -6.50×10⁹ | 0.48×10⁹ |
Fig. 1.
Variation trends of renewable energy consumption (a), the value of agricultural production (b), the total water extraction for agricultural withdrawal (c), urban population (d), gross domestic product (GDP; e), economic diversification index (f), and trade balance (g) in the Netherlands and South Africa during 1991-2021."
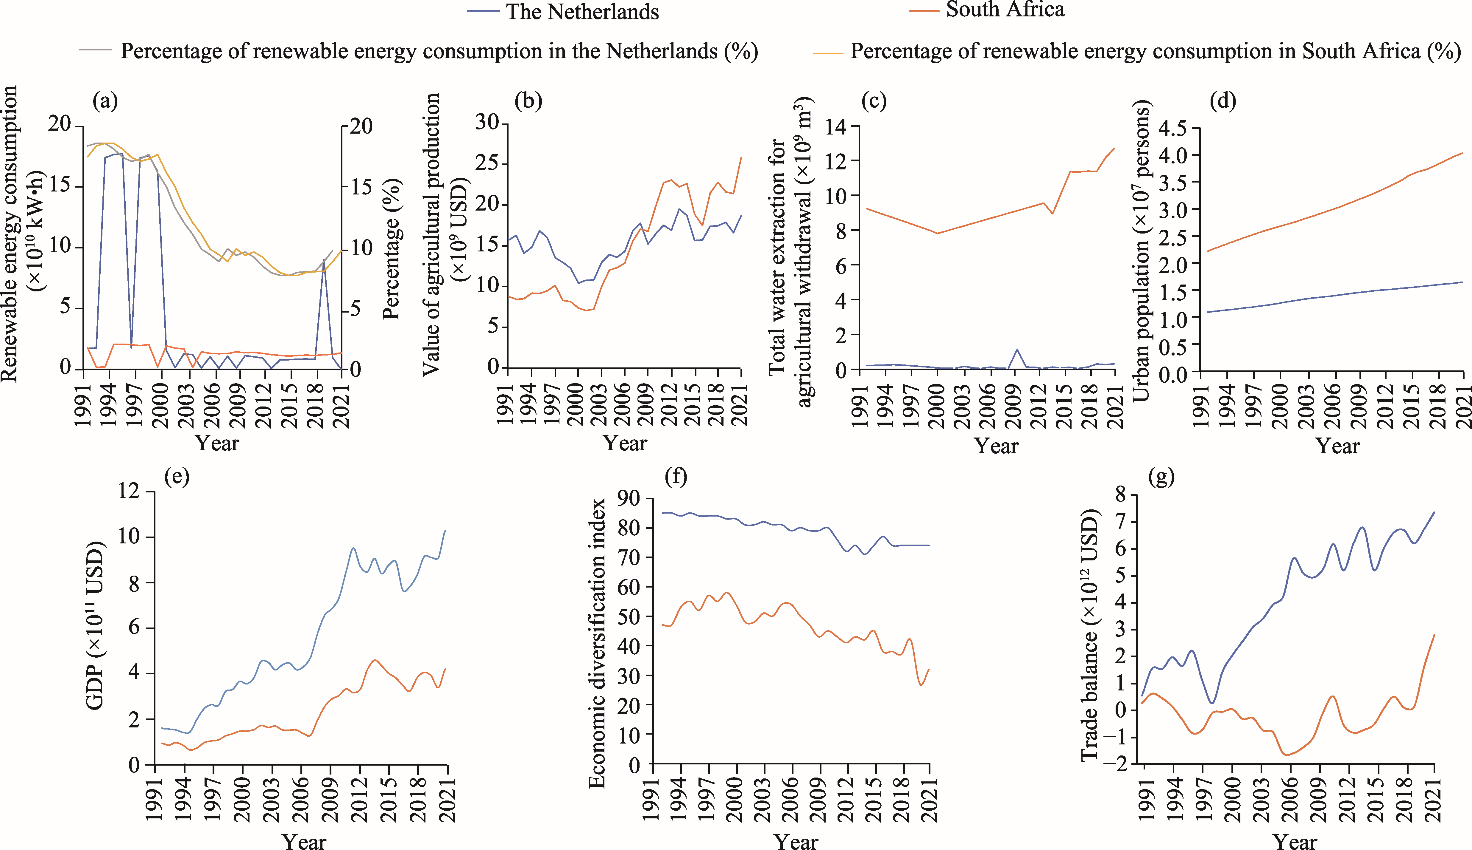
Table 2
Augmented Dickey-Fuller (ADF) unit root test results in the Netherlands."
| lnAP | lnEDI | lnGDP | lnRE | |||||
|---|---|---|---|---|---|---|---|---|
| t-statistic | Probability | t-statistic | Probability | t-statistic | Probability | t-statistic | Probability | |
| At the level | -1.44 | 0.08 | -1.17 | 0.13 | -0.99 | 0.17 | -3.20 | 0.00 |
| At the first difference level | - | - | -1.00 | 0.16 | -1.29 | 0.10 | - | - |
| lnTB | lnURB | lnWE | ||||||
| t-statistic | Probability | t-statistic | Probability | t-statistic | Probability | |||
| At the level | -2.38 | 0.01 | -6.74 | 0.00 | -3.73 | 0.00 | ||
| At the first difference level | - | - | - | - | - | - | ||
Table 3
Optimal lag structure in the Netherlands."
| lnAP | lnEDI | lnGDP | lnRE | lnTB | lnURB | lnWE | ||||||||
|---|---|---|---|---|---|---|---|---|---|---|---|---|---|---|
| AIC | HQIC | AIC | HQIC | AIC | HQIC | AIC | HQIC | AIC | HQIC | AIC | HQIC | AIC | HQIC | |
| Lag 0 | -0.80 | -0.79 | -3.01 | -3.00 | 0.54 | 0.55 | 3.85 | 3.86 | 2.32 | 2.34 | -1.62 | -1.61 | 2.11* | 2.12* |
| Lag 1 | -2.01* | -1.98* | -4.58* | -4.55* | -2.07* | -2.04* | 3.76 | 3.79 | 1.41* | 1.44* | -9.28 | -9.25 | 2.15 | 2.17 |
| Lag 2 | -1.94 | -1.90 | -4.55 | -4.51 | -2.03 | -1.99 | 3.70* | 3.74* | 1.48 | 1.52 | -9.93 | -9.89 | 2.22 | 1.27 |
| Lag 3 | -1.88 | -1.82 | -4.51 | -4.45 | -2.03 | -1.97 | 3.78 | 3.84 | 1.50 | 1.52 | -10.19* | -10.14* | 2.30 | 2.36 |
| Lag 4 | -1.86 | -1.79 | -4.45 | -4.38 | -2.05 | -1.98 | 3.78 | 3.85 | 1.57 | 1.64 | 10.14 | -10.08 | 2.38 | 2.45 |
Table 4
ADF unit root test results in South Africa."
| lnAP | lnEDI | lnGDP | lnRE | |||||
|---|---|---|---|---|---|---|---|---|
| t-statistic | Probability | t-statistic | Probability | t-statistic | Probability | t-statistic | Probability | |
| At the level | -1.32 | 0.10 | -1.35 | 0.10 | -0.89 | 0.19 | -5.19 | 0.00 |
| At the first difference level | - | - | - | - | -1.32 | 0.10 | - | - |
| lnTB | lnURB | lnWE | ||||||
| t-statistic | Probability | t-statistic | Probability | t-statistic | Probability | |||
| At the level | -20.43 | 0.00 | -2.01 | 0.02 | 1.18 | 0.87 | ||
| At the first difference level | - | - | - | - | 0.70 | 0.75 | ||
Table 5
Optimal lag structure in South Africa."
| lnAP | lnEDI | lnGDP | lnRE | lnTB | lnURB | lnWE | ||||||||
|---|---|---|---|---|---|---|---|---|---|---|---|---|---|---|
| AIC | HQIC | AIC | HQIC | AIC | HQIC | AIC | HQIC | AIC | HQIC | AIC | HQIC | AIC | HQIC | |
| Lag 0 | 0.46 | 0.47 | -0.54 | -0.52 | 1.14 | 1.16 | 1.82* | 1.83 | -3.91 | -3.90 | -0.88 | -0.87 | -0.97 | -0.95 |
| Lag 1 | -1.30 | -1.30 | -1.42 | -1.40 | -1.06* | -1.04* | 1.88 | 1.90 | -4.45* | -4.43* | -8.66 | -8.63 | -3.50* | -3.47* |
| Lag 2 | -1.26 | -1.22 | -1.64* | -1.60* | -1.06 | -1.01 | 1.90 | 1.94 | -4.38 | -4.34 | -8.77 | -8.73 | -3.43 | -3.39 |
| Lag 3 | -1.24 | -1.18 | -1.57 | -1.51 | -1.04 | 0.98 | 1.85 | 1.90 | -4.31 | -4.35 | -8.79 | -8.74 | -3.41 | -3.36 |
| Lag 4 | -1.38* | -1.32* | -1.57 | -1.50 | -0.97 | -0.90 | 1.92 | 1.99 | -4.25 | -4.18 | -8.85* | -8.78* | -3.34 | -3.27 |
Table 6
ARDL model of short-run relationship among variables in the Netherlands and South Africa."
| The Netherlands | South Africa | |||||||||||||
|---|---|---|---|---|---|---|---|---|---|---|---|---|---|---|
| lnRE | lnAP | lnGDP | lnEDI | lnWE | lnURB | lnTB | lnRE | lnAP | lnGDP | lnEDI | lnWE | lnURB | lnTB | |
| lnAP | 2.89 | - | 0.87*** | −1.12 | −0.16 | −0.02*** | 3.16*** | 8.61** | - | 0.85*** | −1.07*** | −0.02 | −0.02 | −0.11 |
| lnAP−1 | 0.84 | 0.25 | 0.38 | −0.25 | 3.11* | - | - | −8.10** | 0.38* | −0.02 | 0.02 | −0.01 | - | - |
| lnAP−2 | -4.44 | 0.25 | -0.41 | 0.05 | - | - | - | 6.92** | -0.53*** | 0.21 | -0.41 | - | - | - |
| lnEDI | -12.85 | -0.10 | 0.89 | - | 5.24 | 0.02 | 1.37 | 0.15* | -0.64*** | 0.67*** | - | -0.09 | -0.01 | -0.15* |
| lnEDI-1 | 8.58 | 0.37 | - | 0.33 | - | - | - | -10.67** | 0.33 | -0.01 | -0.31 | 0.19 | -0.02 | -0.13 |
| lnEDI-2 | - | - | - | -0.08 | - | - | - | -12.37** | 0.93*** | -0.98*** | 0.79* | 0.33 | - | -0.05 |
| lnGDP | -6.21 | 0.83*** | - | 0.15 | -0.30 | 0.01 | -0.41 | -9.98** | 0.99*** | - | 0.99*** | 0.12 | 0.01 | 0.05 |
| lnGDP-1 | - | -0.66** | 0.47 | -0.08 | - | -0.00 | - | 6.83** | -0.33 | 0.38** | -0.12 | -0.10 | 0.01 | - |
| lnGDP-2 | - | 0.10 | 0.22 | - | - | 0.00 | - | 0.53 | - | - | - | -0.15 | - | - |
| lnRE | - | 0.00 | 0.01 | -0.00 | 0.06 | 0.00 | -0.13*** | - | 0.05** | -0.01 | 0.02 | 0.02 | -0.00 | -0.00 |
| lnRE-1 | -0.46* | 0.01 | - | 0.00 | - | - | - | -0.59** | 0.05*** | - | 0.03 | - | 0.00 | -0.00 |
| lnRE-2 | - | - | - | - | - | - | - | 0.31 | - | - | 0.01 | - | - | 0.01 |
| lnTB | -1.30 | 0.07** | -0.06* | 0.02 | 0.10 | 0.00 | - | -15.66 | 0.37 | 0.85 | -1.03 | -0.63 | -0.03 | 0.08 |
| lnTB-1 | - | -0.02 | -0.03 | 0.03 | - | - | -0.01 | 0.26 | -0.47 | - | -1.16 | 0.43 | -0.01 | -0.03 |
| lnTB-2 | - | -0.00 | -0.03 | 0.04** | - | - | 0.41** | -9.14*** | 0.43* | - | - | 0.17 | 0.00 | - |
| lnURB | 311.85 | -21.79* | -8.86 | 13.23* | - | - | 5.76** | -222.03* | 15.44** | -21.58** | 15.71 | 12.60** | - | -0.43 |
| lnURB-1 | -718.11 | 20.91* | 37.10 | -25.52 | - | 1.28*** | - | 25.70 | -2.83 | 12.55 | -4.74 | -5.49 | 1.14*** | 1.45 |
| lnURB-2 | 415.80 | - | -26.84 | 11.65 | - | -0.29 | - | 175.57 | 12.43** | 9.18 | -12.01 | -6.02* | -0.30 | -1.24 |
| lnWE | -0.57 | -0.00 | -0.02 | 0.01 | - | -0.00 | 0.01 | 2.71 | 0.15 | 0.30 | 0.12 | - | 0.03 | -0.15 |
| lnWE-1 | 1.18** | 0.00 | -0.04 | 0.02 | - | - | - | 13.93* | -0.67 | -0.23 | -0.26 | 0.36 | - | 0.24 |
| lnWE-2 | 0.68 | -0.04 | -0.00 | 0.00 | -0.01 | - | - | -19.82** | 1.51*** | -1.22** | 1.51* | 0.50 | - | -0.00 |
| Constant | 77.22 | 17.20 | -36.21 | 17.64 | -80.85* | 0.42 | -140.06 | 496.47** | -9.17 | -2.10 | 26.11* | -15.24 | 1.03 | 9.62 |
| Probability | 0.02 | 0.00 | 0.00 | 0.00 | 0.43 | 0.00 | 0.00 | 0.07 | 0.00 | 0.00 | 0.00 | 0.00 | 0.00 | 0.06 |
| R | 0.79 | 0.97 | 0.99 | 0.96 | 0.28 | 0.99 | 0.86 | 0.92 | 0.99 | 0.99 | 0.97 | 0.99 | 0.99 | 0.81 |
| Adjusted R | 0.55 | 0.91 | 0.98 | 0.87 | 0.01 | 0.99 | 0.79 | 0.64 | 0.99 | 0.99 | 0.89 | 0.96 | 0.00 | 0.50 |
| RMSE | 1.15 | 0.05 | 0.04 | 0.02 | 0.68 | 0.00 | 0.34 | 0.41 | 0.03 | 0.05 | 0.06 | 0.03 | 0.00 | 0.02 |
| F-statistic | 5.71 | 1.43 | 1.05 | 2.15 | 2.38 | 1.52 | 4.46 | 15.40 | 7.23 | 4.24 | 2.10 | 3.82 | 0.84 | 1.63 |
Table 7
Autoregressive distributed lag-error correction model (ARDL-ECM) results of long-run relationship among variables in the Netherlands and South Africa."
| Variable | The Netherlands | South Africa | ||||||||||||
|---|---|---|---|---|---|---|---|---|---|---|---|---|---|---|
| lnRE | lnAP | lnGDP | lnEDI | lnWE | lnURB | lnTB | lnRE | lnAP | lnGDP | lnEDI | lnWE | lnURB | lnTB | |
| lnRE | - | - | - | - | 0.06 | - | -0.10** | - | 0.09** | -0.01 | - | -0.12 | - | - |
| lnEDI | -2.93 | - | - | - | 2.13 | - | 0.96 | -14.14* | 0.53 | -0.52 | - | 3.07 | - | - |
| lnTB | -0.90 | - | - | 0.12 | -0.06 | - | -19.24 | 0.27 | 1.37 | - | -0.25 | - | - | |
| lnGDP | -4.26 | - | - | 4.82 | -0.19 | - | -0.29 | -2.05 | 0.57*** | - | - | -1.00 | - | - |
| lnURB | 6.55 | - | - | -0.84* | - | - | 4.05** | -16.29 | 0.15 | 0.25 | - | 7.97 | - | - |
| lnAP | -0.49 | - | - | -0.42 | - | - | 2.23*** | 5.83 | 1.73*** | - | -0.27 | - | - | |
| lnWE | 1.67** | - | - | 0.04 | 2.15 | - | 0.01 | -2.49 | 0.86*** | -1.85*** | - | - | - | |
| Adjustment speed | -1.46*** | - | - | -0.75** | -0.92*** | - | -1.28*** | -1.15*** | -0.62*** | - | -0.14 | - | - | |
| R | 0.82 | - | - | 0.79 | 0.41 | - | 0.65 | 0.96 | 0.97 | 0.94 | - | 0.84 | - | - |
| Adjusted R | 0.60 | - | - | 0.33 | 0.22 | - | 0.83 | 0.92 | 0.87 | 0.87 | - | 0.55 | - | - |
| Root Mean Square Error | 1.15 | - | - | 0.02 | 0.71 | - | 0.41 | 0.03 | 0.04 | 0.04 | - | 0.03 | - | - |
| Durbin-Watson Serial Correlation test | 2.39 | 2.23 | 2.56 | 2.01 | 2.35 | 2.19 | 2.45 | 2.45 | 2.03 | 1.95 | 1.72 | 2.58 | 2.14 | 2.59 |
| Breusch-Godfrey Lagrange Multiplier test | 13.01*** | 4.58 | 6.85** | 0.05 | 16.54*** | 3.17 | 4.98* | 16.95*** | 17.47*** | 12.70** | 8.42** | 11.28*** | 5.33* | 13.01*** |
| White’s test for heteroscedasticity | 27.00 | 27.00 | 27.00 | 27.00 | 27.00 | 27.00 | 27.00 | 27.00 | 27.00 | 27.00 | 0.41 | 27.00 | 27.00 | 27.00 |
| [1] | ADB (African Development Bank), 2024. African Economic Outlook 2024: Driving Africa’s Transformation: The Reform of the Global Financial Architecture. [2025-01-04]. https://www.afdb.org/sites/default/files/2024/06/06/aeo_2024_-_country_notes.pdf. |
| [2] | Ahlborg, H., Sjöstedt, M., 2015. Small-scale hydropower in Africa: Socio-technical designs for renewable energy in Tanzanian villages. Energy Res. Soc. Sci. 5, 20-33. |
| [3] | Akizu, O., Urkidi, L., Bueno, G., et al., 2017. Tracing the emerging energy transitions in the Global North and the Global South. Int. J. Hydrog. Energy. 42(28), 18045-18063. |
| [4] | Ali, Q., Anwar, S., Tariq, M., et al., 2023. Estimation of economic, environmental, and social efficiency for sustainable development in G-8 and SAARC countries: A data envelopment analysis. Environ. Sci. Pollut. Res. 30, 26819-26842. |
| [5] | Apfel, D., Haag, S., Herbes, C., 2021. Research agendas on renewable energies in the Global South: A systematic literature review. Renew. Sust. Energ. Rev. 148, 111228, doi: 10.1016/j.rser.2021.111228. |
| [6] | Aziza, S., Aktolkin, A., Erdal, B.F., et al., 2021. Analysis of the relationship between renewable energy and economic growth in selected developing countries. International Journal of Energy Economics and Policy. 11(1), 110-116. |
| [7] | Bekele, G., Tadesse, G., 2012. Feasibility study of small Hydro/PV/Wind hybrid system for off-grid rural electrification in Ethiopia. Appl. Energy. 97, 5-15. |
| [8] | Boix-Fayos, C., de Vente, J., 2023. Challenges and potential pathways towards sustainable agriculture within the European Green Deal. Agric. Syst. 207, 103634, doi: 10.1016/j.agsy.2023.103634. |
| [9] | Briel, G., 2024. South Africa’s Draft Integrated Resource Plan Undermines its Climate Ambitions. [2024-08-24]. https://www.tralac.org/documents/blogs/5184-tralac-blog-briel-south-africa-s-draft-integrated-resource-plan-16012024/file.html. |
| [10] | Busu, M., 2020. Analyzing the impact of the renewable energy sources on economic growth at the EU level using an ARDL model. Mathematics. 8(8), 1636, doi: 10.3390/math8081367. |
| [11] | Chandio, A.A., Akram, W., Ozturk, I., et al., 2021. Towards long-term sustainable environment: Does agriculture and renewable energy consumption matter? Environ. Sci. Pollut. Res. 28, 53141-53160. |
| [12] | Cloete, K., Pienaar, L., van der Merwe, M., 2023. Is persistent “loadshedding” pulling the plug on agriculture in the Western Cape, South Africa? Agrekon. 62, 228-240. |
| [13] | CSIR (Council for Scientific and Industrial Research), 2021. Decoupling South Africa’s Development from Water Demand through a Circular Economy. [2025-01-04]. https://www.circulareconomy.co.za/wp-content/uploads/2021/11/8.-Water_CE-Briefing-Note.pdf. |
| [14] | DALRD (Department of Agriculture, Land Reform and Rural Development), 2022. Economic Review of the South African Agriculture. [2024-08-01]. http://www.dalrrd.gov.za/phocadownloadpap/Statistics_and_Economic_Analysis/Statistical_Information/Economic%20Review%202021-22.pdf. |
| [15] | Data Commons, 2024. Netherlands. [2024-08-01]. https://datacommons.org/place/country/NLD?utm_medium=explore&mprop=amount&popt=EconomicActivity&cpv=activitySource,GrossDomesticProduction&hl=en. |
| [16] | Deka, A., Ozdeser, H., Seraj, M., et al., 2023. Does energy efficiency, renewable energy and effective capital promote economic growth in the emerging 7 economies? New evidence from CS-ARDL model. Futur. Bus. J. 9, 52, doi: 10.1186/s43093-023-00235-y. |
| [17] | Destek, A.M., Aslan, A., 2017. Renewable and non-renewable energy consumption and economic growth in emerging economies: Evidence from bootstrap panel causality. Renew. Energy. 111, 757-763. |
| [18] | DoA (Department of Agriculture), 2023. The Netherlands: A Model of Success in Agriculture. [2024-08-01]. https://hdoa.hawaii.gov/add/files/2024/06/Dutch-Ag-Success_03R2.pdf. |
| [19] | DoME (Department of Minerals and Energy), 2002. White Paper on the Promotion of Renewable Energy and Clean Energy Development: Part One-Promotion of Renewable Energy. [2024-08-01]. https://www.gov.za/sites/default/files/gcis_document/201409/rewp2208022.pdf. |
| [20] | DoMRE (Department of Mineral Resources), 2021. The South African Energy Sector Report. [2024-08-01]. https://www.dmre.gov.za/Portals/0/Energy_Website/files /media/explained/2021-South-African-Energy-Sector-Report.pdf. |
| [21] | DoP (Department of the Presidency), 2011. National Development Plan. [2024-08-01]. https://www.nationalplanningcommission.org.za/National_Development_Plan. |
| [22] | El-karimi, M., El-houjjaji, H., 2022. Economic growth and renewable energy consumption nexus in G 7 countries: Symmetric and asymmetric causality analysis in frequency domain. J. Clean. Prod. 342, 130618, doi: 10.1016/j.jclepro.2022.130618. |
| [23] | European Commission, 2021. European Green Deal: Research & Innovation Call. [2024-08-01]. https://cinea.ec.europa.eu/funding-opportunities/calls-proposals/european-green-deal-research-innovation-call_en. |
| [24] | European Commission, 2023. Common Agricultural Policy: 2023-27. [2024-08-19]. https://agriculture.ec.europa.eu/common-agricultural-policy/cap-overview/cap-2023-27_en#:-:text=It%20seeks%20to%20ensure%20a,adapt%20measures%20to%20local%20conditions. |
| [25] | European Parliament, 2021. Climate Action in the Netherlands: Latest State of Play. [2024-08-01]. https://www.europarl.europa.eu/thinktank/en/document/EPRS_BRI(2021)696184. |
| [26] | European Parliament and the Council of the European Union, 2021. Regulation (EU) 2021/ 2115 of the European Partliament and of the Council. [2024-08-01]. https://eur-lex.europa.eu/eli/reg/2021/2115/oj/eng. |
| [27] | Eyuboglu, K., Uzar, U., 2022. Asymmetric causality between renewable energy consumption and economic growth: Fresh evidence from some emerging countries. Environ. Sci. Pollut. Res. 29, 21899-21911. |
| [28] | Fadare, D.A., 2009. Modelling of solar energy potential in Nigeria using an artificial neural network model. Appl. Energy. 86(9), 1410-1422. |
| [29] | Fadare, D.A., 2010. The application of artificial neural networks to mapping of wind speed profile for energy application in Nigeria. Appl. Energy. 87(3), 934-942. |
| [30] | FAOSTAT (Food and Agriculture Organization of the United Nations), 2024. Agricultural Production. [2024-08-22]. https://www.fao.org/faostat/en/#data. |
| [31] | Goldemberg, G., Coelho, S.T., Nastari, P.M., et al., 2004. Ethanol learning curve—the Brazilian experience. Biomass Bioenerg. 26(3), 301-304. |
| [32] | GoN (Government of the Netherlands), 2011. Grean Deal. [2024-08-05]. https://www.iea.org/policies/5333-green-deals. |
| [33] | GoN, 2016. Government Stimulates Biomass Energy. [2024-08-13]. https://www.government.nl/topics/renewable-energy/government-stimulates- biomass-energy. |
| [34] | GoN, 2020. North Sea Energy Outlook Establishes Framework Conditions for Future Growth of Offshore Wind Energy. [2024-08-05]. https://www.government.nl/latest/news/2020/12/04/north-sea-energy-outlook-establishes-framework-conditions-for-future-growth-of-offshore-wind-energy. |
| [35] | GoSA (Government of South Africa), 2024. Climate Change Act No. 22 of 2024. Pretoria, South Africa. [2024-08-05]. https://www.gov.za/sites/default/files/gcis_document/202407/50966climatechangeact222024.pdf. |
| [36] | Harvard Kennedy School, 2024. Country and Product Complexity Rankings. [2024-08-01]. https://atlas.hks.harvard.edu/rankings. |
| [37] | He, K., Shahzadi, I., Khan, S., et al., 2024. The dilemma of water, food, and greener energy nexus: A novel context of COP 27 for G20 economies. Land Degrad. Dev. 35(9), 2993-3006. |
| [38] | Hlomendlini, H., 2025. It’s Time for Agriculture to Build Resilience-by Investing in Alternative Energy Sources. [2024-08-09]. https://hdl.handle.net/10520/ejc-farmweek_v2023_n23005_a5. |
| [39] | Hofsetz, K., Aparecida, M., 2012. Brazilian sugarcane bagasse: Energy and non-energy consumption. Biomass Bioenerg. 46, 564-573. |
| [40] | IEA (International Energy Agency), 2017. Renewable Energy Independent Power Producer Programme (REIPPP). [2024-08-05]. https://www.iea.org/policies/5393-renewable-energy-independent-power-producer-programme-reippp. |
| [41] | IEA, 2021. Energy Systems of South Africa. [2024-08-05]. https://www.iea.org/countries/south-africa. |
| [42] | IEA Bioenergy, 2021. Country Reports: Implementation of Bioenergy in South Africa- 2021 Update. [2024-08-05]. https://www.ieabioenergy.com/wp-content/uploads/2021/11/CountryReport2021_SouthAfrica_final.pdf. |
| [43] | Jebli, B., Youssef, B., 2015. Renewable Energy Consumption and Agriculture: Evidence for Cointegration and Granger Causality for Tunisian Economy. [2024-08-01]. https://mpra.ub.uni-muenchen.de/68018/. |
| [44] | Jolly, S., 2024. Conflicting actor narratives and institutional challenges for just energy transitions in the Global North and the Global South:Case of offshore wind energy in Norway and India. In: 5th Indian Public Policy Network Conference. Bombay: Indian Institute of Technology Bombay (IITB) India. |
| [45] | Kaunda, C.S., Kimambo, C.Z., Nielsen, T.K., 2012. Potential of small-scale hydropower for electricity generation in Sub-Saharan Africa. Renew. Energy. 2012, 132606, doi: 10.5402/2012/132606. |
| [46] | Komendantova, N., Patt, A., Barras, L., et al., 2020. Perception of risks in renewable energy projects: The case of concentrated solar power in North Africa. Energy Policy. 40, 103-109. |
| [47] | Lin, Y., Mahmood, A.M., Meng, W.T., et al., 2024. Green economy transition in Asia Pacific: A holistic assessment of renewable energy production. J. Clean. Prod. 437, 140648, doi: 10.1016/j.jclepro.2024.140648. |
| [48] | Mandal, K.G., Saha, K.P., Ghosh, P.K., et al., 2002. Bioenergy and economic analysis of soybean-based crop production systems in central India. Biomass Bioenerg. 23(5), 337-345. |
| [49] | Molek-Kozakowska, K., 2023. The hybrid discourse of the ‘European Green Deal’: Road-mapping economic transition to environmental sustainability (almost) seamlessly. Crit. Discourse Stud. 21(2), 182-199. |
| [50] | Nendissa, D.R., Iriany, A., Sui, J.M., et al., 2023. The role of renewable and nonrenewable energy on agricultural economics in Indonesia. International Journal of Energy Economics and Policy. 12(3), 352-360. |
| [51] | Nfah, E.M., Ngundam, J.M., Tchinda, R., 2007. Modelling of solar/diesel/battery hybrid power systems for far-north Cameroon. Renew. Energy. 32(5), 832-844. |
| [52] | Ngarava, S., Zhou, L., Monde, N., 2019. Gendered water insecurity: A structural equation approach for female headed households in South Africa. Water. 11(12), 2491, doi: 10.3390/w11122491. |
| [53] | Ngarava, S., 2021. Relationship between economic diversification and CO2emissions: ARDL-EC modeling in South Africa ARDL-EC modeling in South Africa. Dev. Stud. Res. 8, 264-279. |
| [54] | NLEA (Netherlands Enterprise Agency), 2023. Stimulation of Sustainable Energy Production and Climate Transition (SDE++). [2024-08-05]. https://english.rvo.nl/subsidies-financiering/sde. |
| [55] | Nyoni, B., Phiri, A., 2020. Renewable energy: Economic growth nexus in South Africa: Linear, nonlinear or non-existent? Int. J. Energy Econ. Policy. 10, 635-644. |
| [56] | Omri, A., Ben, N., Sassi-tmar, A., 2015. Modeling the causal linkages between nuclear energy, renewable energy and economic growth in developed and developing countries. Renew. Sust. Energ. Rev. 42, 1012-1022. |
| [57] | Pesaran, M.M., Shin, Y., 1997. An autoregressive distributed lag modelling approach to cointegration analysis. In: Strom, S., (ed.). Econometrics and Economic Theory in 20th Century: The Ragnar Frisch Centennial Symposium. Cambridge: Cambridge University Press, 371-413. |
| [58] | Pesaran, M.H., Shin, Y., Smith, R.J., 2001. Bounds testing approaches to the analysis of level relationships. J. Appl. Econom. 16(3), 289-326. |
| [59] | REN21 (Renewable Energy Policy Network for the 21st Century), 2023. Renewables 2023 Global Status Report: Global Overview. [2024-08-12]. https://www.ren21.net/gsr-2023/modules/global_overview/. |
| [60] | Saheb-koussa, D., Haddadi, M., Belhamel, M., 2009. Economic and technical study of a hybrid system (wind-photovoltaic-diesel) for rural electrification in Algeria. Appl. Energy. 86(7-8), 1024-1030. |
| [61] | Shakouri, B., Khoshnevis Yzdi, S., 2017. Causality between renewable energy, energy consumption, and economic growth. Energy Sources, Part B Econ. Plan. Policy. 12, 838-845. |
| [62] | Šimelytė, A., Dudzevičiūtė, G., 2017. Consumption of renewable energy and economic growth. In:5th International Scientific Conference on Contemporary Issues in Business, Management and Education. Vilnius, Lithuania, 11-12. |
| [63] | Slusarczyk, B., Zegle, P., Kluczek, A., et al., 2022. The impact of renewable energy sources on the economic growth of Poland and Sweden considering COVID-19 times. Energies. 15(1), 332, doi: 10.3390/en15010332. |
| [64] | Smolovic, J.C., Muhadinovi, M., Radonji, M., et al., 2020. How does renewable energy consumption affect economic growth in the traditional and new member states of the European Union? Energy Rep. 6(6), 505-513. |
| [65] | Statista, Inc., 2023. 20 Countries with the Biggest Inequality in Income Distribution Worldwide in 2023, Based on the Gini Index. [2024-08-09]. https://www.statista.com/statistics/264627/ranking-of-the-20-countries-with-the-biggest-inequality-in-income-distribution/. |
| [66] | Statista Inc., 2024a. Netherlands—Statistics and Facts. [2024-08-09]. https://www.statista.com/topics/2697/the-netherlands/. |
| [67] | Statista Inc., 2024b. South Africa—Statistics and Facts. [2024-08-09]. https://www.statista.com/topics/3921/south-africa/. |
| [68] | Statista Inc., 2025a. African Countries with the Highest Gross Domestic Product (GDP) in 2024. [2025-02-21]. https://www.statista.com/statistics/1120999/gdp-of-african-countries-by-country/#:-:text=South%20Africa's%20GDP%20was%20estimated,a%20high%20GDP%20per%20capita. |
| [69] | Statista Inc., 2025b. Netherlands:Distribution of Gross Domestic Product (GDP) across Economic Sectors from 2013 to 2023. [2025-02-21]. https://www.statista.com/statistics/276713/distribution-of-gross-domestic-product-gdp-across-economic-sectors-in-the-netherlands/. |
| [70] | Statista Inc., 2025c. South Africa:Distribution of Gross Domestic Product (GDP) Across Economic Sectors from 2013 to 2023. [2025-02-21] https://www.statista.com/statistics/371233/south-africa-gdp-distribution-across-economic-sectors/#:-:text=In%202023%2C%20agriculture%20had%20contributed,the%20total%20value%20added%2C%20respectively. |
| [71] | Statistics Netherlands, 2024. Nearly Half the Electricity Produced in the Netherlands is Now Renewable. [2024-08-05]. https://www.cbs.nl/en-gb/news/2024/10/nearly-half-the-electricity-produced-in-the-netherlands-is-now-renewable. |
| [72] | StatLine, 2024. Agriculture; Income and Labour Volume Structure, National Accounts. Statistical Netherlands. [2024-08-20]. https://opendata.cbs.nl/statline/#/CBS/nl/dataset/85933NED/table?ts=1741539162927. |
| [73] | Sutherland, L.A., Peter, S., Zagata, L., 2015. Conceptualising multi-regime interactions: The role of the agriculture sector in renewable energy transitions. Res. Policy. 44(8), 1543-1554. |
| [74] | Szabo, S., Bodis, K., Huld, T., et al., 2011. Energy solutions in rural Africa: Mapping electrification costs of distributed solar and diesel generation versus grid extension. Environ. Res. Lett. 6(3), 034002, doi: 10.1088/1748-9326/6/3/034002. |
| [75] | Taliotis, C., Bazilian, M., Welsch, M., et al., 2014. Grand Inga to power Africa: Hydropower development scenarios to 2035. Energy Strateg. Rev. 4, 1-10. |
| [76] | Tan, D.J., Alvarado, F.F., Alvarado, F., et al., 2022. The effects of environmental degradation on agriculture: Evidence from European countries. Gondwana Res. 106, 92-104. |
| [77] | The European Parliament, 2009. Directive 2009/28/EC of the European Parliament and of the Council. [2024-08-05]. https://eur-lex.europa.eu/eli/dir/2009/28/oj/eng. |
| [78] | Tugcu, T.C., Tiwari, K.A., 2016. Does renewable and/or non-renewable energy consumption matter for total factor productivity (TFP) growth? Evidence from the BRICS. Renew. Sust. Energ. Rev. 65, 610-616. |
| [79] | Uche, E., Ngepah, N., 2024. How green-technology, energy-transition and resource rents influence load capacity factor in South Africa. Int. J. Sustain. Energy. 43, 1-19. |
| [80] | UN (United Nations), 2015a. SDG 7: Ensure Access to Affordable, Reliable, Sustainable and Modern Energy for All: Targets and Indicators. [2024-08-08]. https://sdgs.un.org/goals/goal7. |
| [81] | UN, 2015b. Sustainable Development Goal (SDG) 12: Ensure Sustainable Consumption and Production Patterns. [2024-08-08]. https://sdgs.un.org/goals/goal12#targets_and_indicators. |
| [82] | UN, 2023. The Sustainable Development Goals Extended Report 2023. [2024-08-05]. https://sdgs.un.org/sites/default/files/2023-07/The-Sustainable-Development-Goals-Report-2023_0.pdf. |
| [83] | Wageningen Economic Research, 2023. State of Agriculture, Nature and Food: Agricultural Businesses Increasingly Finding Additional Sources of Income. [2024-08-13]. https://www.wur.nl/en/research-results/research-institutes/social-economic-research/show-ser/state-of-agriculture-nature-and-food-agricultural-businesses-increasingly-finding-additional-sources-of-income.htm. |
| [84] | Western Cape Government, 2018. Solar Energy in Agriculture. [2024-08-13]. https://www.westerncape.gov.za/110green/projects/green-agriportal-agriculture-launched. |
| [85] | WITS (World Integrated Trade Solution), 2024. Trade Stats-Country at a Glance. [2024-08-05]. https://wits.worldbank.org/datadownload.aspx?lang=en. |
| [86] | World Bank, 2024. World Development Indicators. [2024-08-05]. ttps://databank.worldbank.org/source/world-development-indicators. |
| [87] | Zhang, X.L., Wang, X.L., Si, D.W., et al., 2024. Natural resources, food, energy and water: Structural shocks, food production and clean energy for USA in the view of COP27. Land Degrad. Dev. 35(7), 2602-2613. |
| Viewed | ||||||
|
Full text |
|
|||||
|
Abstract |
|
|||||
 REGSUS Wechat
 新公网安备 65010402001202号