Regional Sustainability ›› 2022, Vol. 3 ›› Issue (2): 122-132.doi: 10.1016/j.regsus.2022.07.002cstr: 32279.14.j.regsus.2022.07.002
• Full Length Article • Previous Articles Next Articles
Binod DAWADIa,b,*( ), Anjula SHRESTHAc, Ram Hari ACHARYAd, Yam Prasad DHITALe, Rohini DEVKOTAf,g
Received:2021-12-28
Revised:2022-06-20
Accepted:2022-07-08
Published:2022-06-30
Online:2022-09-19
Contact:
*E-mail address: Binod DAWADI, Anjula SHRESTHA, Ram Hari ACHARYA, Yam Prasad DHITAL, Rohini DEVKOTA. Impact of climate change on agricultural production: A case of Rasuwa District, Nepal[J]. Regional Sustainability, 2022, 3(2): 122-132.
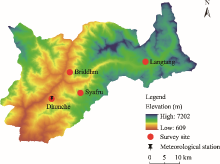
Fig. 1.
Overview of the study area as well as the distribution of the selected survey sites."

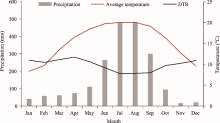
Fig. 2.
Monthly climatology (precipitation and temperature) of Dhunche in Rasuwa District. DTR, diurnal temperature range."

Table 1
Mann-Kendall trend test and Sen’s slope estimation statistics of precipitation (1980-2014), temperature (1990-2014), and agricultural production (1990-2014)"
| Variable | Season | Sen’s slope | Kendall’s tau | Kendall’ P-value | Auto- correlation | Linear trend | Intercept | Mean | SD |
|---|---|---|---|---|---|---|---|---|---|
| P | Winter | -4.89 | -0.29 | 0.03 | 0.09 | -5.90 | 179.01 | 121.70 | 104.47 |
| P | Pre-monsoon | -3.30 | -0.10 | 0.49 | 0.35 | -5.28 | 268.10 | 245.84 | 139.96 |
| P | Monsoon | 19.89 | 0.32 | 0.02 | -0.17 | 22.19 | 1156.25 | 1509.78 | 431.39 |
| P | Post-monsoon | -4.71 | -0.31 | 0.03 | 0.06 | -5.72 | 160.08 | 111.19 | 91.31 |
| P | Annual | 7.44 | 0.16 | 0.22 | -0.16 | 6.39 | 1831.43 | 1985.38 | 436.96 |
| Tmax | Winter | -0.14 | -0.09 | 0.62 | 0.29 | -0.06 | 17.77 | 14.55 | 1.74 |
| Tmin | Winter | -0.05 | 0.11 | 0.53 | 0.35 | -0.11 | 4.22 | 3.70 | 1.52 |
| DTR | Winter | -0.04 | -0.24 | 0.16 | 0.65 | 0.03 | 11.62 | 10.85 | 2.01 |
| Tavg | Winter | -0.08 | -0.19 | 0.26 | 0.05 | -0.09 | 10.85 | 9.32 | 1.35 |
| Tmax | Pre-monsoon | 0.01 | -0.06 | 0.74 | -0.06 | 0.03 | 21.47 | 21.75 | 1.22 |
| Tmin | Pre-monsoon | 0.01 | 0.06 | 0.74 | -0.14 | 0.04 | 10.68 | 10.62 | 1.60 |
| DTR | Pre-monsoon | 0.01 | -0.14 | 0.38 | -0.18 | -0.01 | 10.86 | 11.10 | 1.61 |
| Tavg | Pre-monsoon | 0.03 | 0.03 | 0.83 | -0.07 | 0.03 | 15.56 | 16.18 | 1.18 |
| Tmax | Monsoon | 0.07 | 0.29 | 0.08 | 0.21 | 0.07 | 22.47 | 23.97 | 0.75 |
| Tmin | Monsoon | 0.00 | 0.018 | 0.94 | 0.31 | -0.01 | 15.85 | 15.78 | 0.63 |
| DTR | Monsoon | 0.08 | 0.17 | 0.33 | 0.15 | 0.08 | 6.60 | 8.19 | 0.95 |
| Tavg | Monsoon | 0.03 | 0.25 | 0.14 | 0.34 | 0.03 | 19.24 | 19.87 | 0.51 |
| Tmax | Post-monsoon | -0.02 | -0.15 | 0.38 | 0.09 | 0.02 | 19.75 | 19.61 | 1.37 |
| Tmin | Post-monsoon | -0.01 | -0.02 | 0.92 | 0.05 | -0.01 | 9.81 | 9.60 | 0.76 |
| DTR | Post-monsoon | 0.01 | -0.09 | 0.58 | 0.19 | 0.03 | 9.29 | 10.01 | 1.87 |
| Tavg | Post-monsoon | -0.01 | -0.09 | 0.58 | -0.23 | 0.00 | 14.59 | 14.61 | 0.59 |
| Tmax | Annual | 0.01 | 0.02 | 0.92 | 0.20 | 0.02 | 19.78 | 20.17 | 0.99 |
| Tmin | Annual | -0.04 | -0.21 | 0.21 | 0.08 | -0.05 | 11.17 | 10.52 | 0.77 |
| Tavg | Annual | -0.01 | 0.00 | 1.00 | -0.16 | -0.01 | 15.59 | 15.36 | 0.64 |
| DTR | Annual | 0.06 | 0.00 | 1.00 | 0.55 | 0.07 | 8.21 | 9.66 | 1.24 |
| Maize | Annual | 43.26 | 0.38 | 0.01 | 0.08 | 50.30 | 2986.64 | 3624.92 | 647.37 |
| Millet | Annual | -6.83 | -0.22 | 0.14 | 0.23 | -9.84 | 1185.25 | 1127.55 | 248.85 |
| Wheat | Annual | 21.66 | 0.27 | 0.07 | 0.37 | 20.30 | 1059.28 | 1297.02 | 290.34 |
| Potato | Annual | 690.68 | 0.41 | 0.01 | 0.68 | 821.93 | 15,801.89 | 24,279.03 | 7429.86 |
Fig. 3.
Annual precipitation (a) and standardized precipitation anomaly (b) for the period from 1980 to 2014. Precipitation data showed missing records from May 1990 to September 1994."
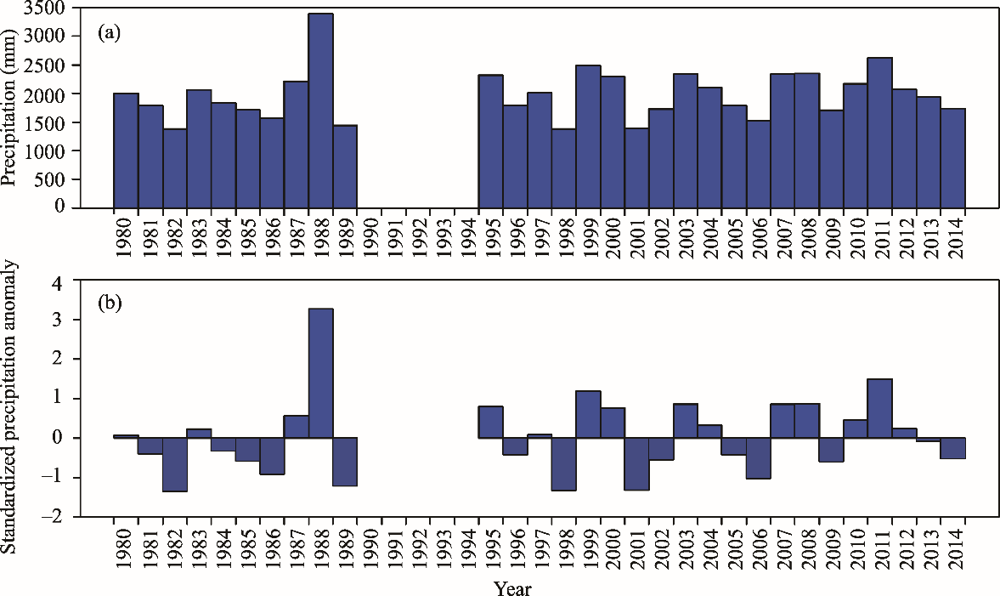

Fig. 4.
Annual average temperature and annual average DTR (a) and annual distribution of temperature deviation (b) from 1990 to 2014. Temperature records were missing from August 1991 to September 1994 and the whole year of 1998."
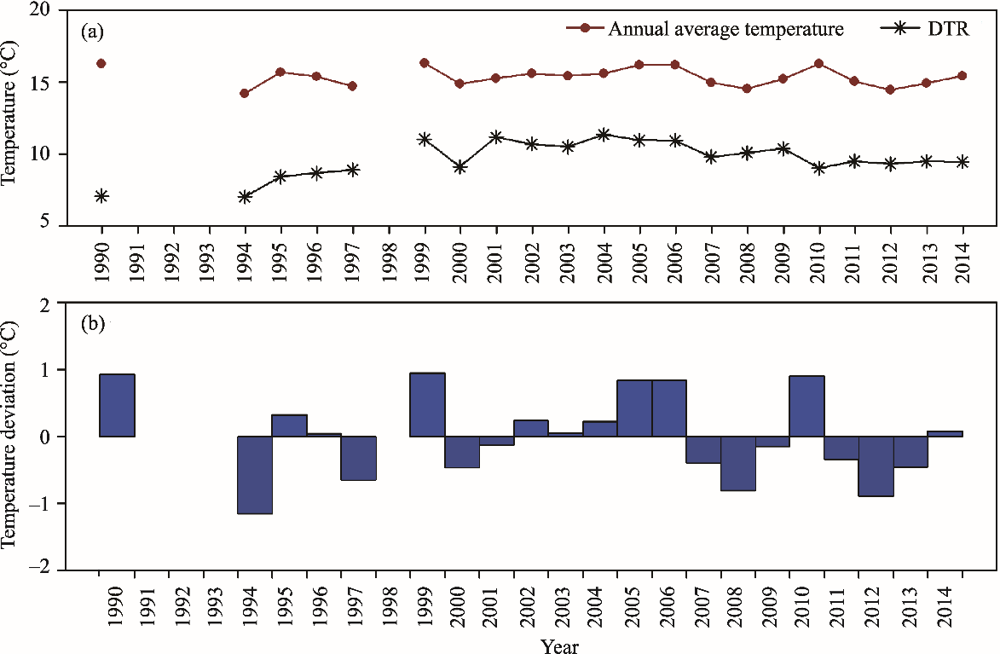

Fig. 5.
Comparison of observed climate data with ERA5 and APHRODITE datasets for the period of 1990-2014. (a), precipitation; (b), temperature."

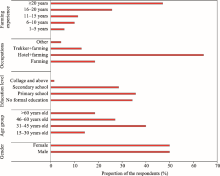
Fig. 6.
Socioeconomic background of the respondents in the study area."
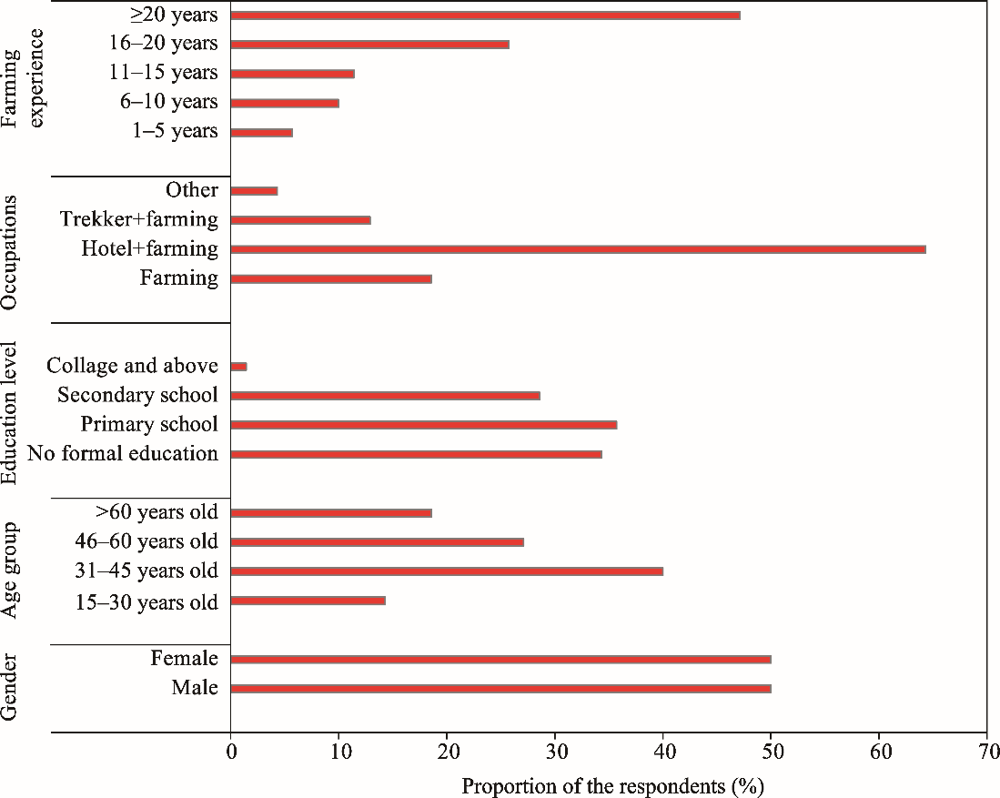
Table 2
Statistical analysis of people’s perceptions of climate change on agriculture production"
| Perceptions of climate change | Proportion of the respondents (%) | Proportion of the respondents by age group (%) | |||
|---|---|---|---|---|---|
| 15-30 years old | 30-45 years old | 45-60 years old | >60 years old | ||
| Have not heard | 62.86 | 50.00 | 64.29 | 63.16 | 61.54 |
| Heard but not clear | 30.00 | 30.00 | 32.14 | 36.84 | 23.08 |
| Clear understanding | 7.14 | 20.00 | 3.57 | 0.00 | 15.38 |
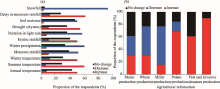
Fig. 7.
People’s perceptions of climate change (a) and people’s perceptions of agricultural information (b)."

Table 3
Crop calendar based on major changes in cropping time."
| Crop | Earlier time periods | Recent years | ||
|---|---|---|---|---|
| Cropping time | Ripening time | Cropping time | Ripening time | |
| Maize | 3rd week of March | 1st week of September | 1st week of April | 3rd week of August |
| Wheat | 3rd week of September | 3rd week of March | 2nd week of September | 2nd week of April |
| Millet | 4th week of May | 3rd week of November | 4th week of June | 1st week of November |
| Potato | 1st week of February | 3rd week of June | 1st week of April | 1st week of August |
| Soybean | 3rd week of June | 2nd week of November | 4th week of June | 1st week of November |
| [1] | Arkin, H., Colton, R.R., 1963. Tables for statisticians. New York: Barnes and Noble, 136-137. |
| [2] |
Boos, W.R., Kuang, Z., 2010. Dominant control of the South Asian monsoon by orographic insulation versus plateau heating. Nature. 463(7278), 218-222.
doi: 10.1038/nature08707 |
| [3] | Central Bureau of Statistics, 2019. National Economic Census 2018, Nepal. [2022-06-05] https://cbs.gov.np/national-economic-census-2018/. |
| [4] |
Chen, Y., Sharma, S., Zhou, X., et al., 2021. Spatial performance of multiple reanalysis precipitation datasets on the southern slope of central Himalaya. Atmos. Res. 250, 105365, doi: 10.1016/j.atmosres.2020.105365.
doi: 10.1016/j.atmosres.2020.105365 |
| [5] | Dawadi, B., Acharya, R.H., Lamichhane, D., et al., 2020. A short note on linkage of climatic records between terai and midmountain of central Nepal. J. Geogr. Res. 3(04), 30-35. |
| [6] | Devkota, R., 2013. Indigenous knowledge for climate change induced flood adaptation in Nepal. International Journal of Climate Change: Impacts & Responses. 5(1), 35-46. |
| [7] |
Devkota, R.P., 2014. Climate change: trends and people’s perception in Nepal. J. Environ. Prot. 5(4), 255-265.
doi: 10.4236/jep.2014.54029 |
| [8] | Devkota, R., Khadka, K., Gartaula, H., et al., 2016. Gender and labour efficiency in finger millet production in Nepal. In: Jemimah, N., John, P., Amy K., (eds.). Transforming Gender and Food Security in the Global South (1st Edition). London: Routledge, 100-119. |
| [9] |
Devkota, R.P., Pandey, V.P., Bhattarai, U., et al., 2017. Climate change and adaptation strategies in Budhi Gandaki River Basin, Nepal: A perception-based analysis. Clim. Change. 140(2), 195-208.
doi: 10.1007/s10584-016-1836-5 |
| [10] |
Devkota, R.P., Bhattarai, U., Devkota, L., et al., 2020. Assessing the past and adapting to future floods: a hydro-social analysis. Clim. Change. 163(2), 1065-1082.
doi: 10.1007/s10584-020-02909-w |
| [11] |
Dhar, O.N., Nandargi, S., 2005. Areas of heavy precipitation in the Nepalese Himalayas. Weather. 60(12), 354-356.
doi: 10.1256/wea.35.05 |
| [12] |
Dhital, Y.P., Kayastha, R.B., 2013. Frequency analysis, causes and impacts of flooding in the Bagmati River Basin, Nepal. J. Flood Risk Manag. 6(3), 253-260.
doi: 10.1111/jfr3.12013 |
| [13] |
Dhital, Y.P., Tang, Q.H., Shi, J.C., 2013. Hydroclimatological changes in the Bagmati River basin, Nepal. J. Geogr. Sci. 23(4), 612-626.
doi: 10.1007/s11442-013-1032-8 |
| [14] | Department of Hydrology and Meteorology, Government of Nepal, 2017. Observed Climate Trend Analysis in the Districts and Physiographic Regions of Nepal (1971-2014). [2021-06-29]. https://www.dhm.gov.np/uploads/climatic/467608975Observed%20Climate%20Trend%20Analysis%20Report_2017_Final.pdf. |
| [15] | Department of Hydrology and Meteorology, Government of Nepal, 2021. Monsoon Onset and Withdrawal date information. [2022-06-29]. http://www.dhm.gov.np/publication/11. |
| [16] | Fagan, M., Huang, C., 2019. A Look at How People around the World View Climate Change. [2020-10-04]. https://www.pewresearch.org/fact-tank/2019/04/18/a-look-at-how-people-around-the-world-view-climate-change/. |
| [17] | Food and Agriculture Organization of the United Nations (FAO), 2019. Agriculture and climate change-Challenges and opportunities at the global and local-collaboration on Climate-Smart Agriculture. Rome: FAO, 52. |
| [18] |
Fujita, K., Thompson, L.G., Ageta, Y., et al., 2006. Thirty-year history of glacier melting in the Nepal Himalayas. J. Geophys. Res. 111(D3), D03109, doi: 10.1029/2005jd005894.
doi: 10.1029/2005jd005894 |
| [19] |
Gouvas, M.A., Sakellariou, N.K., Kambezidis, H.D., 2011. Estimation of the monthly and annual mean maximum and mean minimum air temperature values in Greece. Meteorol. Atmos. Phys. 110(3), 143-149.
doi: 10.1007/s00703-010-0111-y |
| [20] | Intergovernmental Panel on Climate Change (IPCC), 2021. Climate change 2021:The physical science basis. In: Masson-Delmotte, V., Zhai, A.P., Pirani, S.L., et al., (eds.). Contribution of Working Group I to the Sixth Assessment Report of the Intergovernmental Panel on Climate Change. Cambridge: Cambridge University Press. |
| [21] |
Joshi, B., Joshi, G.R., 2016. Climate change perception and determinants of adoption of agricultural practices in Rasuwa district of Nepal. Nepal J. Environ. Sci. 4, 63-70.
doi: 10.3126/njes.v4i0.22726 |
| [22] |
Karki, R., Talchabhadel, R., Aalto, J., 2016. New climatic classification of Nepal. Theor. Appl. Climatol. 125(3-4), 799-808.
doi: 10.1007/s00704-015-1549-0 |
| [23] |
Karki, R., Schickhoff, U., Scholten, T., et al., 2017. Rising precipitation extremes across Nepal. Climate. 5(1), 4, doi: 10.3390/cli5010004.
doi: 10.3390/cli5010004 |
| [24] |
Kattel, D.B., Yao, T., 2013. Recent temperature trends at mountain stations on the southern slope of the central Himalayas. J. Earth Syst. Sci. 122(1), 215-227.
doi: 10.1007/s12040-012-0257-8 |
| [25] |
Kattel, D.B., Yao, T., Yang, K., 2013. Temperature lapse rate in complex mountain terrain on the southern slope of the central Himalayas. Theor. Appl. Climatol. 113(3-4), 671-682.
doi: 10.1007/s00704-012-0816-6 |
| [26] | Kendall, M.G., 1975. Rank correlation measures. London: Charles Griffin, 15. |
| [27] |
Lobell, D.B., 2007. Changes in diurnal temperature range and national cereal yields. Agric. For. Meteorol. 145(3-4), 229-238.
doi: 10.1016/j.agrformet.2007.05.002 |
| [28] |
Malla, G., 2008. Climate change and its impact on Nepalese agriculture. Journal of agriculture and environment, 9, 62-71
doi: 10.3126/aej.v9i0.2119 |
| [29] | Mann, H.B., 1945. Nonparametric tests against trend. Econometrica: Journal of the econometric society. 245-259. |
| [30] | Martin, G., Reilly, K., Everitt, H., 2022. The impact of climate change awareness on children’s mental well-being and negative emotions-a scoping review. Child Adolesc. Ment. Health. 27(1), 59-72. |
| [31] | Ministry of Environment, 2010. Climate change vulnerability mapping for Nepal. Kathmandu, Nepal: Ministry of Environment, 32-34. |
| [32] | Nepal Disaster Report, 2015. Kathmandu: The Government of Nepal, Ministry of Home Affairs and Disaster Preparedness Network-Nepal. [2020-10-04] https://floodresilience.net/resources/item/nepal-disaster-report-2015/. |
| [33] |
Nayava, J.L., Adhikary, S., Bajracharya, O.R., 2017. Spatial and temporal variation of surface air temperature at different altitude zone in recent 30 years over Nepal. Mausam. 68(3), 417-428.
doi: 10.54302/mausam.v68i3.649 |
| [34] |
Neupane, B.K., Acharya, A., Thapa, L., 2019. Local people’s perception on climate change at kamalamai municipality, sindhuli. Geog. Base. 6, 21-31.
doi: 10.3126/tgb.v6i0.26164 |
| [35] |
Sapkota, D., Pokhrel, S., 2010. Community based maize seed production in the hills and mountains of Nepal: A review. Agronomy Journal of Nepal. 1, 107-112.
doi: 10.3126/ajn.v1i0.7550 |
| [36] | Sapkota, R., Rijal, K., 2016. Climate Change and its Impact in Nepal. PhD Dissertation. Katmandu: Institute of Science and Technology, Tribhuvan University, 9-11. |
| [37] |
Sen, P.K., 1968. Estimates of the regression coefficient based on Kendall’s tau. Am. Stat. Assoc. 63(324), 1379-1389.
doi: 10.1080/01621459.1968.10480934 |
| [38] |
Sharma, S., Hamal, K., Khadka, N., et al., 2020. Dominant pattern of year-to-year variability of summer precipitation in Nepal during 1987-2015. Theor. Appl. Climatol. 142(3), 1071-1084.
doi: 10.1007/s00704-020-03359-1 |
| [39] |
Shrestha, M.L., 2000. Interannual variation of summer monsoon rainfall over Nepal and its relation to Southern Oscillation Index. Meteorol. Atmos. Phys. 75(1-2), 21-28.
doi: 10.1007/s007030070012 |
| [40] |
Sigdel, M., Ikeda, M., 2010. Spatial and temporal analysis of drought in Nepal using standardized precipitation index and its relationship with climate indices. Journal of Hydrology and Meteorology. 7(1), 59-74.
doi: 10.3126/jhm.v7i1.5617 |
| [41] |
Sigdel, M., Ma, Y., 2017. Variability and trends in daily precipitation extremes on the northern and southern slopes of the central Himalaya. Theor. Appl. Climatol. 130(1-2), 571-581.
doi: 10.1007/s00704-016-1916-5 |
| [42] |
Talchabhadel, R., Karki, R., Thapa, B.R., et al., 2018. Spatio-temporal variability of extreme precipitation in Nepal. Int. J. Climatol. 38(11), 4296-4313.
doi: 10.1002/joc.5669 |
| [43] | Thakuri, S., Dahal, S., Shrestha, D., et al., 2019. Elevation-dependent warming of maximum air temperature in Nepal during 1976-2015. Atmos. Res. 228, 261-269. |
| [44] |
Tiwari, K.R., Awasthi, K.D., Balla, M.K., et al., 2010. Local people’s perception on climate change, its impact and adaptation practices in Himalaya to Terai regions of Nepal. J. Mater. Sci. Lett. doi: 10.1007/BF01730062.
doi: 10.1007/BF01730062 |
| [45] |
Yiridomoh, G.Y., Bonye, S.Z., Derbile, E.K., et al., 2022. Women farmers’ perceived indices of occurrence and severity of observed climate extremes in rural Savannah, Ghana. Environment, Development and Sustainability. 24(1), 810-831.
doi: 10.1007/s10668-021-01471-4 |
| [46] |
You, Q., Kang, S., Pepin, N., et al., 2010. Relationship between temperature trend magnitude, elevation and mean temperature in the Tibetan Plateau from homogenized surface stations and reanalysis data. Glob. Planet. Change. 71(1-2), 124-133.
doi: 10.1016/j.gloplacha.2010.01.020 |
| [47] |
Zhang, X., Vincent, L.A., Hogg, W.D., et al., 2000. Temperature and precipitation trends in Canada during the 20th century. Atmos.-Ocean. 38(3), 395-429.
doi: 10.1080/07055900.2000.9649654 |
| [1] | Ashma SUBEDI, Nani RAUT, Smriti GURUNG. How Himalayan communities are changing cultivation practices in the context of climate change [J]. Regional Sustainability, 2023, 4(4): 378-389. |
| [2] | Peng He, Lishuai Xu, Zhengchun Liu, Yaodong Jing, Wenbo Zhu. Dynamics of NDVI and its influencing factors in the Chinese Loess Plateau during 2002-2018 [J]. Regional Sustainability, 2021, 2(1): 36-46. |
| Viewed | ||||||
|
Full text |
|
|||||
|
Abstract |
|
|||||
 REGSUS Wechat
 新公网安备 65010402001202号