Regional Sustainability ›› 2023, Vol. 4 ›› Issue (2): 150-172.doi: 10.1016/j.regsus.2023.05.001cstr: 32279.14.j.regsus.2023.05.001
Previous Articles Next Articles
Subrata HALDARa, Somnath MANDALa, Subhasis BHATTACHARYAb, Suman PAULa,*( )
)
Received:2022-12-16
Accepted:2023-05-14
Published:2023-05-18
Online:2023-06-16
Contact:
Suman PAUL
E-mail:suman.krish.2007@gmail.com
Subrata HALDAR, Somnath MANDAL, Subhasis BHATTACHARYA, Suman PAUL. Dynamicity of Land Use/Land Cover (LULC): An analysis from peri-urban and rural neighbourhoods of Durgapur Municipal Corporation (DMC) in India[J]. Regional Sustainability, 2023, 4(2): 150-172.
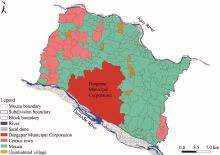
Fig. 1.
Overview of the study area."

Table 1
Information about satellite images used in the study."
| Product | Sensor | Date | Path/row | Band | Spatial resolution | |
|---|---|---|---|---|---|---|
| Landsat 5 | TM | 9 February, 1991 | 139/044 | Band 1 | Blue | 30 m |
| Band 2 | Green | |||||
| Band 3 | Red | |||||
| Band 4 | Near infrared | |||||
| Band 6 | Thermal infrared | |||||
| Landsat 5 | TM | 20 February, 2001 | 139/044 | Band 1 | Blue | 30 m |
| Band 2 | Green | |||||
| Band 3 | Red | |||||
| Band 4 | Near infrared | |||||
| Band 6 | Thermal Infrared | |||||
| Landsat 5 | ETM | 16 February, 2011 | 139/044 | Band 1 | Blue | 30 m |
| Band 2 | Green | |||||
| Band 3 | Red | |||||
| Band 4 | Near infrared | |||||
| Band 6 | Thermal infrared | |||||
| Landsat 8 | OLI-TIRS | 27 February, 2021 | 139/044 | Band 2 | Blue | 30 m |
| Band 3 | Green | |||||
| Band 4 | Red | |||||
| Band 5 | Near infrared | |||||
| Band 10 | Thermal Infrared Scanner-1 | |||||
| Band 11 | Thermal Infrared Scanner-2 | |||||
Table 2
Description of classification results from Kappa coefficient (Monserud and Leemans, 1992)."
| Kappa coefficient | Characteristics |
|---|---|
| <0.40 | Poor or very poor agreement |
| 0.40-0.55 | Fair agreement |
| 0.55-0.70 | Good agreement |
| 0.70-0.85 | Very good agreement |
| >0.85 | Excellent agreement |
Table 3
Area and percentage of Land Use/Land Cover (LULC) types in different years."
| Year | LULC types | |||||
|---|---|---|---|---|---|---|
| Agriculture land | Built-up land | Fallow land | ||||
| Area (km2) | Percentage (%) | Area (km2) | Percentage (%) | Area (km2) | Percentage (%) | |
| 1991 | 196.16 | 31.24 | 32.57 | 5.19 | 89.82 | 14.30 |
| 2001 | 230.13 | 36.64 | 61.96 | 9.86 | 110.15 | 17.54 |
| 2011 | 270.73 | 42.99 | 99.64 | 15.86 | 96.61 | 15.38 |
| 2021 | 247.93 | 39.33 | 128.03 | 20.39 | 46.95 | 7.47 |
| Year | Vegetated land | Mining area | Water bodies | |||
| Area (km2) | Percentage (%) | Area (km2) | Percentage (%) | Area (km2) | Percentage (%) | |
| 1991 | 299.99 | 47.76 | 0.88 | 0.14 | 9.02 | 1.44 |
| 2001 | 217.28 | 34.59 | 3.25 | 0.52 | 5.69 | 0.91 |
| 2011 | 149.86 | 23.86 | 8.35 | 1.33 | 3.27 | 0.52 |
| 2021 | 172.14 | 27.41 | 25.67 | 4.08 | 7.75 | 1.23 |
Table 4
Relative deviation (RD) of LULC types in different time periods."
| LULC types | RD (%) | |||
|---|---|---|---|---|
| 1991-2001 | 2001-2011 | 2011-2021 | 1991-2021 | |
| Agriculture land | 17.32 | 17.64 | -8.42 | 26.39 |
| Built-up land | 90.24 | 60.81 | 28.49 | 293.09 |
| Fallow land | 22.63 | -12.29 | -51.40 | -47.73 |
| Vegetated land | -27.57 | -31.03 | 14.87 | -42.62 |
| Mining area | 269.32 | 156.92 | 207.43 | 2817.05 |
| Water bodies | -36.92 | -42.53 | 137.00 | -14.08 |
Table 5
Accuracy assessment of LULC types in different years."
| Accuracy | LULC types | Year | |||
|---|---|---|---|---|---|
| 1991 | 2001 | 2011 | 2021 | ||
| Producer accuracy (%) | Agriculture land | 97.14 | 96.61 | 93.55 | 95.16 |
| Built-up land | 94.73 | 92.16 | 95.74 | 95.83 | |
| Fallow land | 90.63 | 93.55 | 96.67 | 96.67 | |
| Mining area | 90.48 | 90.48 | 90.00 | 94.74 | |
| Vegetated land | 100.00 | 98.00 | 97.96 | 100.00 | |
| Water bodies | 93.55 | 96.43 | 90.63 | 90.63 | |
| User accuracy (%) | Agriculture land | 97.14 | 95.00 | 96.67 | 98.33 |
| Built-up land | 90.00 | 94.00 | 90.00 | 92.00 | |
| Fallow land | 96.67 | 96.67 | 96.67 | 96.67 | |
| Mining area | 95.00 | 95.00 | 90.00 | 90.00 | |
| Vegetated land | 98.00 | 98.00 | 96.00 | 98.00 | |
| Water bodies | 96.67 | 90.00 | 96.67 | 96.67 | |
| Overall accuracy (%) | 95.83 | 95.01 | 94.58 | 95.83 | |
| Kappa coefficient | 0.95 | 0.94 | 0.93 | 0.95 | |
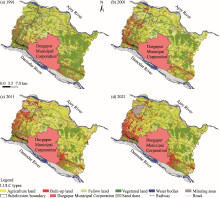
Fig. 2.
Spital distribution of Land Use/Land Cover (LULC) types in the peri-urban and rural neighborhoods of Durgapur Municipal Corporation in 1991 (a), 2001 (b), 2011 (c), and 2021 (d)."

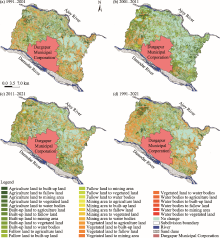
Fig. 3.
Spatial distribution of LULC transformations in the peri-urban and rural neighborhoods of Durgapur Municipal Corporation during 1991-2001 (a), 2001-2011 (b), 2011-2021 (c), and 1991-2021 (d)."

Table 6
Annual change intensity (ACI) and uniform intensity (UI) of LULC types in the peri-urban and rural neighborhoods of Durgapur Municipal Corporation during 1991-2021."
| Year | LULC types | |||||||||||
|---|---|---|---|---|---|---|---|---|---|---|---|---|
| Agriculture land | Built-up land | Fallow land | Vegetated land | Mining area | Water bodies | |||||||
| ACI (%) | UI (%) | ACI (%) | UI (%) | ACI (%) | UI (%) | ACI (%) | UI (%) | ACI (%) | UI (%) | ACI (%) | UI (%) | |
| 1991-2001 | 1.74 | 1.47 | 0.47 | 0.51 | 1.34 | 0.78 | 0.77 | 0.76 | 0.05 | 0.15 | 0.03 | 0.05 |
| 2001-2011 | 1.82 | 0.60 | 0.80 | 0.45 | 0.10 | 0.01 | ||||||
| 2011-2021 | 0.83 | 0.46 | 0.20 | 1.06 | 0.30 | 0.09 | ||||||
Table 7
Influence degree of LULC types based on the expert knowledge and understanding."
| LULC types | Agriculture land | Built-up land | Fallow land | Mining area | Vegetated land | Water bodies |
|---|---|---|---|---|---|---|
| Agriculture land | 0 | 3 | 1 | 4 | 0 | 0 |
| Built-up land | 0 | 0 | 0 | 2 | 0 | 0 |
| Fallow land | 1 | 3 | 0 | 4 | 0 | 0 |
| Mining area | 0 | 2 | 0 | 0 | 0 | 0 |
| Vegetated land | 2 | 4 | 3 | 4 | 0 | 1 |
| Water bodies | 2 | 4 | 3 | 4 | 1 | 0 |
Table 8
Total relation matrix for the weights of LULC type transformations."
| LULC types | Agriculture land | Built-up land | Fallow land | Mining area | Vegetated land | Water bodies |
|---|---|---|---|---|---|---|
| Agriculture land | 0.01 | 0.28 | 0.07 | 0.35 | 0.00 | 0.00 |
| Built-up land | 0.00 | 0.02 | 0.00 | 0.15 | 0.00 | 0.00 |
| Fallow land | 0.07 | 0.28 | 0.01 | 0.35 | 0.00 | 0.00 |
| Mining area | 0.00 | 0.15 | 0.00 | 0.02 | 0.00 | 0.00 |
| Vegetated land | 0.17 | 0.47 | 0.24 | 0.49 | 0.01 | 0.07 |
| Water bodies | 0.17 | 0.47 | 0.24 | 0.49 | 0.07 | 0.01 |

Fig. 4.
Relative positions of different LULC types (a) and relationships among LULC types measured by the Decision-Making Trial and Evaluation Laboratory (DEMATEL) (b). Establishing R and C as n×1 and 1×n vectors represent the sum of the rows and the sum of the columns of the total relation matrix T, respectively. Ri+Ci represents the overall system importance of factor I, while Ri-Ci represents the net influence of factor I on the system. Arrows indicate the directions of the impact of LULC types. The values on the arrow represent the weights of LULC type transformations."
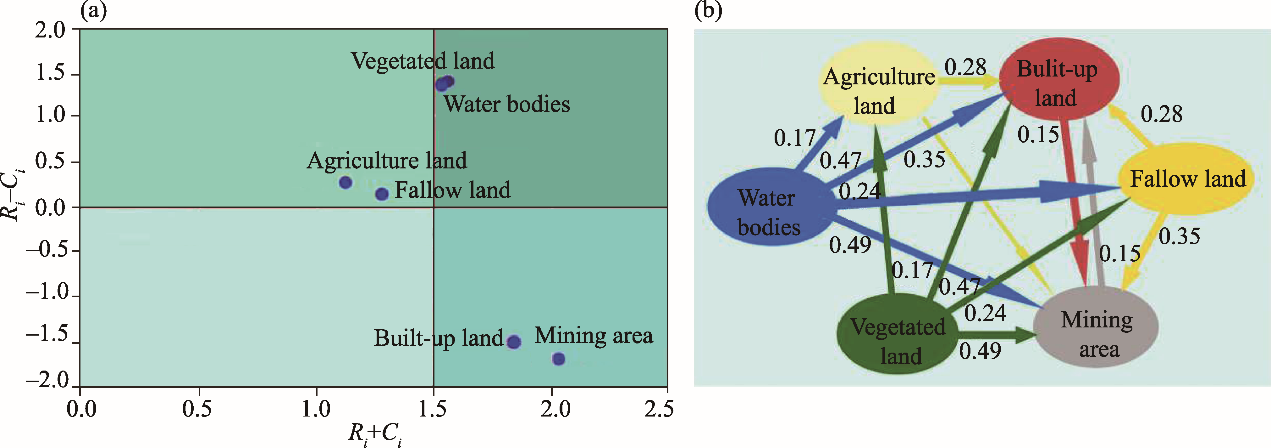
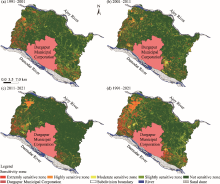
Fig. 5.
Spatial distribution of sensitivity zones in the peri-urban and rural neighborhoods of Durgapur Municipal Corporation during 1991-2201 (a), 2001-2011 (b), 2011-2021 (c), and 1991-2021 (d) by the using DEMATEL."

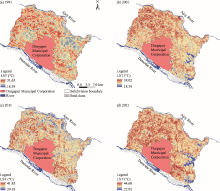
Fig. 6.
Spatial distribution of land surface temperature (LST) in the peri-urban and rural neighborhoods of Durgapur Municipal Corporation in 1991 (a), 2001 (b), 2011 (c), and 2021 (d)."

Table 9
Land surface temperature (LST) grades in 1991, 2001, 2011, and 2021."
| Grade | LST (°C) | |||
|---|---|---|---|---|
| 1991 | 2001 | 2021 | 2011 | |
| Grade 1 | <20.71 | <21.74 | <26.83 | <24.36 |
| Grade 2 | 20.71-21.98 | 21.74-23.19 | 26.83-28.85 | 24.36-25.74 |
| Grade 3 | 21.99-24.51 | 23.20-24.64 | 28.86-30.87 | 25.75-27.14 |
| Grade 4 | 24.52-25.77 | 24.65-26.10 | 30.88-32.89 | 27.15-28.54 |
| Grade 5 | 25.78-27.04 | 26.11-27.55 | 32.90-34.90 | 28.55-29.93 |
| Grade 6 | >27.04 | >27.55 | >34.90 | >29.93 |

Fig. 7.
Proportion of LST grades for different LULC types in 1991 (a), 2001 (b), 2011 (c), and 2021 (d)."
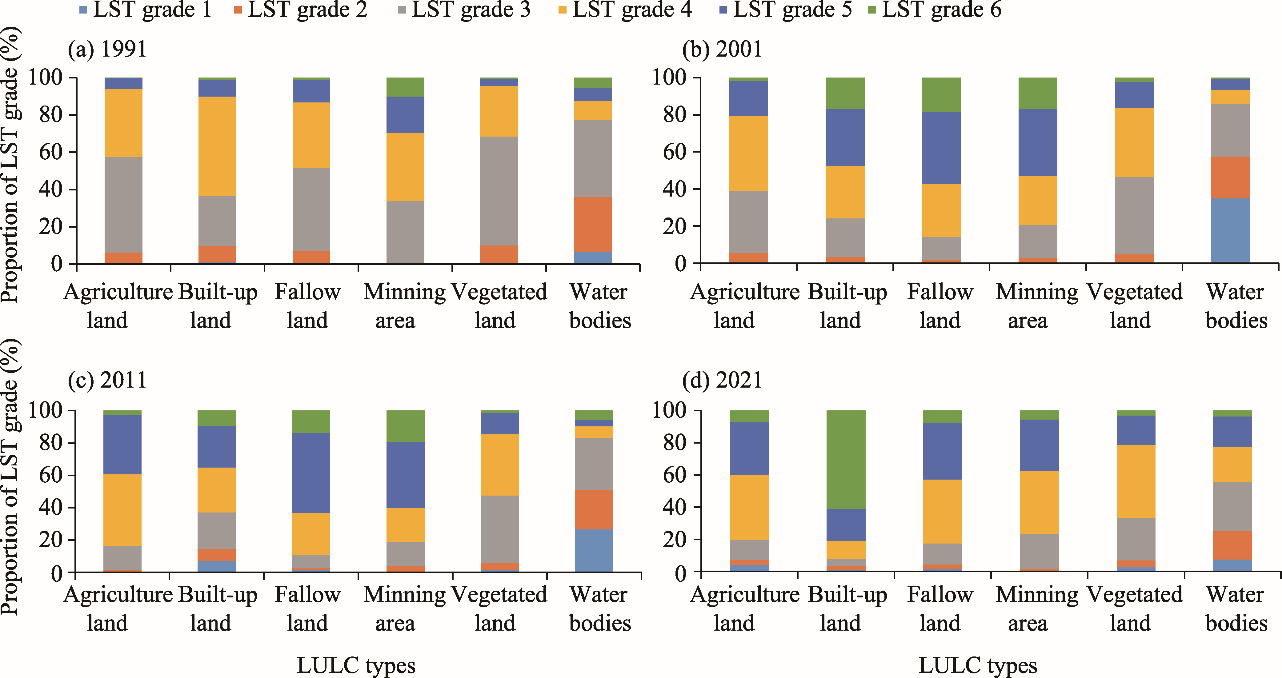
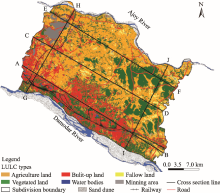
Fig. 8.
Five cross section lines (AB, CD, EF, GH, and IJ) showing LULC types in 2021 in the peri-urban and rural neighborhoods of Durgapur Municipal Corporation."

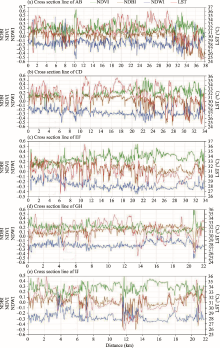
Fig. 9.
Variations of Normalized Differenced Built-up Index (NDBI), Normalized Difference Water Index (NDVI), Normalized Difference Water Index (NDWI), and LST in different cross sections in the peri-urban and rural neighborhoods of Durgapur Municipal Corporation. (a), cross section line of AB; (b), cross section line of CD; (c), cross section line of EF; (d), cross section line of GH; (e), cross section line of IJ."


Fig. 10.
LULC changes and transformation in 7 random points (A, B, C, D, E, F, and G, with 1 km buffer, respectively) selected from the spatial distribution of LST in the peri-urban and rural neighborhoods of Durgapur Municipal Corporation in 2011 and 2021. (a), spatial distribution of LST in 2011-2021; (b), zone A in 2011; (c), zone A in 2021; (d), zone B in 2011; (e), zone B in 2021; (f), zone C in 2011; (g), zone C in 2021; (h), zone D in 2011; (i), zone D in 2021; (j), zone E in 2011; (k), zone E in 2021; (l), zone F in 2011; (m), zone F in 2021; (n), zone G in 2011; (o), zone G in 2021."

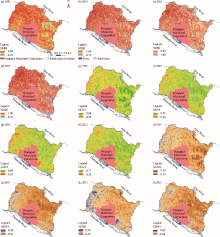
Fig. 11.
Spatial distribution of NDBI (a, b, c, d), NDVI (e, f, g, h), and NDWI (i, j, k, l) in the peri-urban and rural neighborhoods of Durgapur Municipal Corporation in 1991, 2001, 2011 and 2021."

Table 10
Pearson correlations among LST, spectral indices (Normalized Differenced Built-up Index (NDBI), Normalized Difference Vegetation Index (NDVI), and Normalized Difference Water Index (NDWI)), and environmental sensitivity in the peri-urban and rural neighborhood of Durgapur Municipal Corporation during 1991-2021."
| LST | NDBI | NDWI | NDVI | Environmental sensitivity | |
|---|---|---|---|---|---|
| LST | 1.000 | ||||
| NDBI | 0.817 (<0.001) | 1.000 | |||
| NDWI | -0.227 (0.106) | -0.158 (0.048) | 1.000 | ||
| NDVI | -0.123 (0.046) | -0.237 (0.102) | -0.819 (<0.001) | 1.000 | |
| Environmental sensitivity | 0.341 (0.017) | 0.210 (0.107) | 0.320 (0.025) | -0.210 (0.108) | 1.000 |
| [1] | ADDA Asansol Durgapur Development Authority, 1980. Asansol Durgapur Development Authority. [2022-02-21]. http://addaonline.in/. |
| [2] | Amirtham L.R., Devadas M.D., 2009. Analysis of land surface temperature and land use/land cover types using remote sensing imagery-a case in Chennai city, India. In: The Seventh International Conference on Urban Climate. ICUC. Yokohama, Japan. |
| [3] |
Anselm N., Brokamp G., Schütt B., 2018. Assessment of land cover change in peri-urban high Andean environments South of Bogotá, Colombia. Land. 7(2), 75, doi: 10.3390/land7020075.
doi: 10.3390/land7020075 |
| [4] |
Appiah D.O., Forkuo E.K., Bugri J.T., et al., 2017. Geospatial analysis of land use andland cover transitions from 1986-2014 in a Peri-Urban Ghana. Geosci. J. 7(4), 125, doi: 10.3390/geosciences7040125.
doi: 10.3390/geosciences7040125 |
| [5] |
Ashwini K., Sil B.S., 2022. Impacts of land use and land cover changes on land surface temperature over Cachar Region, Northeast India—A case study. Sustainability. 14(21), 14087, doi: 10.3390/su142114087.
doi: 10.3390/su142114087 |
| [6] |
Budiyantini Y., Pratiwi V., 2016. Peri-urban typology of Bandung Metropolitan area. Procedia-Social and Behavioral Sciences. 227, 833-837.
doi: 10.1016/j.sbspro.2016.06.152 |
| [7] |
Butt A.S., Shabbir R., Ahmad S., et al., 2015. Land use change mapping and analysis using Remote Sensing and GIS: A case study of Simly watershed, Islamabad, Pakistan. The Egyptian Journal of Remote Sensing and Space Science. 18(2), 251-259.
doi: 10.1016/j.ejrs.2015.07.003 |
| [8] |
Carlson T.N., Arthur S.T., 2000. The impact of land use—land cover changes due to urbanization on surface microclimate and hydrology: A satellite perspective. Glob Planet Change. 25(1-2), 49-65.
doi: 10.1016/S0921-8181(00)00021-7 |
| [9] | Census of India, 1991. District Census Handbook, Barddhaman, Village and Town Directory, Directorate of Census Operations. West Bengal. [2023-04-07]. https://censusindia.gov.in. |
| [10] | Census of India, 2001. District Census Handbook, Barddhaman, Village and Town Directory, Directorate of Census Operations. West Bengal. [2023-04-07]. https://censusindia.gov.in. |
| [11] | Census of India, 2011. District Census Handbook, Barddhaman, Village and Town Directory, Directorate of Census Operations. West Bengal. [2023-04-07]. https://censusindia.gov.in. |
| [12] |
Chen L.P., Sun Y.J., Saeed S., 2018. Monitoring and predicting land use and land cover changes using remote sensing and GIS techniques—A case study of a hilly area, Jiangle, China. PLoS One. 13(7), e0200493, doi: 10.1371/journal.pone.0200493.
doi: 10.1371/journal.pone.0200493 |
| [13] |
Choudhury D., Das K., Das A., 2019. Assessment of land use land cover changes and its impact on variations of land surface temperature in Asansol-Durgapur Development Region. The Egyptian Journal of Remote Sensing and Space Science. 22(2), 203-218.
doi: 10.1016/j.ejrs.2018.05.004 |
| [14] |
Das N., Mondal P., Sutradhar S., et al., 2021. Assessment of variation of land use/land cover and its impact on land surface temperature of Asansol subdivision. The Egyptian Journal of Remote Sensing and Space Science. 24(1), 131-149.
doi: 10.1016/j.ejrs.2020.05.001 |
| [15] |
Dimyati M., Mizuno K., Kitamura T., 1996. An analysis of land use/cover change using the combination of MSS Landsat and land use map: a case study in Yogyakarta, Indonesia. Int. J. Remote Sens. 17, 931-944.
doi: 10.1080/01431169608949056 |
| [16] |
Estoque R.C., Murayama Y., 2015. Intensity and spatial pattern of urban land changes in the megacities of Southeast Asia. Land Use Pol. 48, 213-222.
doi: 10.1016/j.landusepol.2015.05.017 |
| [17] |
Ghosh S., Guchhait S.K., Hu X.F., 2015. Characterization and evolution of primary and secondary laterites in northwestern Bengal Basin, West Bengal, India. J. Palaeogeogr. 4(2), 203-230.
doi: 10.3724/SP.J.1261.2015.00074 |
| [18] |
Ghosh S., Chatterjee N.D., Dinda S., 2021. Urban ecological security assessment and forecasting using integrated DEMATEL-ANP and CA-Markov models: A case study on Kolkata Metropolitan Area, India. Sust. Cities Soc. 68, 102773, doi: 10.1016/j.scs.2021.102773.
doi: 10.1016/j.scs.2021.102773 |
| [19] |
Grover A., Singh R.B., 2015. Analysis of urban heat island (UHI) in relation to normalized difference vegetation index (NDVI): A comparative study of Delhi and Mumbai. Environments. 2(2), 125-138.
doi: 10.3390/environments2020125 |
| [20] | Gwet K., 2002. Kappa statistic is not satisfactory for assessing the extent of agreement between raters. Statistical Methods for Inter-Rater Reliability Assessment. 1(6), 1-6. |
| [21] |
Haldar S., Mandal S., Bhattacharya S., et al., 2023. Assessing and mapping spatial accessibility of peri-urban and rural neighborhood of Durgapur Municipal Corporation, India: A tool for transport planning. Case Stud. Transp. Policy. 12, doi: 10.1016/j.cstp.2023.100990.
doi: 10.1016/j.cstp.2023.100990 |
| [22] |
Hashim B.M., Maliki A.A., Sultan M.A., et al., 2022. Effect of land use land cover changes on land surface temperature during 1984-2020: A case study of Baghdad city using landsat image. Nat. Hazards. 112(2), 1223-1246.
doi: 10.1007/s11069-022-05224-y |
| [23] | Hussain S., Karuppannan S., 2021. Land use/land cover changes and their impact on land surface temperature using remote sensing technique in district Khanewal, Punjab Pakistan. Geology, Ecology, and Landscapes. 1-13. |
| [24] | Jalan S., Sharma K., 2014. Spatio-temporal assessment of land use/land cover dynamics and urban heat island of Jaipur city using satellite data. The International Archives of Photogrammetry, Remote Sensing and Spatial Information Sciences. 40(8), 9-12. |
| [25] |
Jensen R.R., Gatrell J.D., Boulton J., et al., 2004. Using remote sensing and geographic information systems to study urban quality of life and urban forest amenities. Ecol. Soc. 9(5), doi: 10.5751/es-01201-090505.
doi: 10.5751/es-01201-090505 |
| [26] |
Karakuş C.B., 2019. The impact of land use/land cover (LULC) changes on land surface temperature in Sivas city center and its surroundings and assessment of urban heat island. Asia-Pac. J. Atmos. Sci. 55(4), 669-684.
doi: 10.1007/s13143-019-00109-w |
| [27] |
Kullo E.D., Forkuo E.K., Biney E., et al., 2021. The impact of land use and land cover changes on socioeconomic factors and livelihood in the AtwimaNwabiagya district of the Ashanti region, Ghana. Environmental Challenges. 5, 100226, doi: 10.1016/j.envc.2021.100226.
doi: 10.1016/j.envc.2021.100226 |
| [28] |
Kumar S., Jain K., 2020. A multi-temporal Landsat data analysis for land-use/land-cover change in Haridwar Region using remote sensing techniques. Procedia Computer Science. 171, 1184-1193.
doi: 10.1016/j.procs.2020.04.127 |
| [29] | Li C.W., Tzeng G.H., 2009. Identification of a threshold value for the DEMATEL method using the maximum mean de-entropy algorithm to find critical services provided by a semiconductor intellectual property mall. Expert Syst. Appl. 36(6), 9891-9898. |
| [30] | Mallick J., Kant Y., Bharath B.D., 2008. Estimation of land surface temperature over Delhi using Landsat-7 ETM+. J. Ind. Geophys. Union. 12(3), 131-140. |
| [31] |
Mathan M., Krishnaveni M., 2020. Monitoring spatio-temporal dynamics of urban and peri-urban land transitions using ensemble of remote sensing spectral indices—a case study of Chennai Metropolitan Area, India. Environ. Monit. Assess. 192(1), doi: 10.1007/s10661-019-7986-y.
doi: 10.1007/s10661-019-7986-y |
| [32] |
Mohammad P., Goswami A., Chauhan S., et al., 2022. Machine learning algorithm based prediction of land use land cover and land surface temperature changes to characterize the surface urban heat island phenomena over Ahmedabad city, India. Urban Clim. 42, 101116, doi: 10.1016/j.uclim.2022.101116.
doi: 10.1016/j.uclim.2022.101116 |
| [33] | Mondal G.C., Singh A.K., Singh T.B., 2018. Damodar river basin:storehouse of Indian coal. In: SinghD., (ed.). The Indian Rivers:Scientific and Socio-economic Aspects. Singapore: Springer, 259-272. |
| [34] | Mondal D., Sen S., 2020. Methodological dimensions of delineating peri-urban areas: The case of Kolkata metropolis. Environ. Urban. ASIA. 11(2), 183-194. |
| [35] |
Mondal M., Biswas A., Haldar S., et al., 2022. Rural livelihood risk to hydro-meteorological extreme events: Empirical evidence from Indian Sundarban applying IPCC-AR5 and DEMATEL methodology. Int. J. Disaster Risk Reduct. 77, 103100, doi: /10.1016/j.ijdrr.2022.103100.
doi: /10.1016/j.ijdrr.2022.103100 |
| [36] |
Monserud R.A., Leemans R., 1992. Comparing global vegetation maps with the Kappa statistic. Ecol. Model. 62(4), 275-293.
doi: 10.1016/0304-3800(92)90003-W |
| [37] |
Morabito M., Crisci A., Messeri A., et al., 2016. The impact of built-up surfaces on land surface temperatures in Italian urban areas. Sci. Total Environ. 551-552, 317-326.
doi: 10.1016/j.scitotenv.2016.02.029 |
| [38] |
Mostafa E., Li X.X., Sadek M., et al., 2021. Monitoring and forecasting of urban expansion using machine learning-based techniques and remotely sensed data: A case study of Gharbia Governorate, Egypt. J. Remote Sens. 13(22), 4498, doi: 0.3390/rs13224498.
doi: 0.3390/rs13224498 |
| [39] |
Naim M.N.H., Kafy A.A., 2021. Assessment of urban thermal field variance index and defining the relationship between land cover and surface temperature in Chattogram city: A remote sensing and statistical approach. Environmental Challenges. 4, 100107, doi: 10.1016/j.envc.2021.100107.
doi: 10.1016/j.envc.2021.100107 |
| [40] | Nichol J.E., 1994. A GIS-based approach to microclimate monitoring in Singapore’s high-rise housing estates. Photogramm. Eng. Remote Sens. 60, 1225-1232. |
| [41] |
Pal S., Ziaul S., 2017. Detection of land use and land cover change and land surface temperature in English Bazar urban centre. The Egyptian Journal of Remote Sensing and Space Science. 20(1), 125-145.
doi: 10.1016/j.ejrs.2016.11.003 |
| [42] | Paul S., 2012. Monitoring urban growth patternand its impact on neighbouring villages: A case study on Rajarhat Region, West Bengal. Int. J. Curr. Res. 4, 221-226. |
| [43] | Qu Y., Liu Y.J., 2015. Risk factors analysis for logistics information integration based on the improved AHP-DEMATEL method. In: International Conference on Machine Learning and Cybernetics. Institute of Electrical and Electronics Engineers. Guangzhou, China. |
| [44] |
Rahaman S., Kumar P., Chen R., et al., 2020. Remote sensing assessment of the impact of land use and land cover change on the environment of Barddhaman District, West Bengal, India. Front. Environ. Sci. 8, doi: 10.3389/fenvs.2020.00127.
doi: 10.3389/fenvs.2020.00127 |
| [45] | Ramachandra T.V., Aithal B.H., Sanna D., 2012. Land surface temperature analysis in an urbanising landscape through multi-resolution data. Research & Reviews: Journal of Space Science & Technology. 1(1), 1-10. |
| [46] |
Rawat J., Kumar M., 2015. Monitoring land use/cover change using remote sensing and GIS techniques: A case study of Hawalbagh block, district Almora, Uttarakhand, India. The Egyptian Journal of Remote Sensing and Space Science. 18(1), 77-84.
doi: 10.1016/j.ejrs.2015.02.002 |
| [47] |
Ray R., Das A., Hasan M.S.U., et al., 2023. Quantitative analysis of land use and land cover dynamics using geoinformatics techniques: A case study on Kolkata Metropolitan Development Authority (KMDA) in West Bengal, India. Remote Sens. 15(4), 959, doi: 10.3390/rs15040959.
doi: 10.3390/rs15040959 |
| [48] |
Shieh J., Wu H., Huang K., 2010. A DEMATEL method in identifying key success factors of hospital service quality. Knowledge-Based Syst. 23(3), 277-282.
doi: 10.1016/j.knosys.2010.01.013 |
| [49] |
Siddique M.A., Liu D.Y., Li P.L., et al., 2020. Assessment and simulation of land use and land cover change impacts on the land surface temperature of Chaoyang District in Beijing, China. Peer J. 8, 9115, doi: 10.7717/peerj.9115.
doi: 10.7717/peerj |
| [50] |
Singh N.P., Mukherjee T.K., Shrivastava B.B.P., 1997. Monitoring the impact of coal mining and thermal power industry on landuse pattern in and around Singrauli coalfield using remote sensing data and GIS. J. Indian Soc. Remote Sens. 25, 61-72.
doi: 10.1007/BF02995419 |
| [51] |
Song Y., Ma M.G., 2011. A statistical analysis of the relationship between climatic factors and the Normalized Difference Vegetation Index in China. Int. J. Remote Sens. 32(14), 3947-3965.
doi: 10.1080/01431161003801336 |
| [52] |
Subasinghe S., Estoque R.C., Murayama Y., 2016. Spatiotemporal analysis of urban growth using GIS and remote sensing: A case study of the Colombo Metropolitan Area, Sri Lanka. ISPRS Int. J. Geo-Inf. 5(11), 197, doi: 10.3390/ijgi5110197.
doi: 10.3390/ijgi5110197 |
| [53] |
Taloor A.K., Manhas D.S., Kothyari G.C., 2021. Retrieval of land surface temperature, normalized difference moisture index, normalized difference water index of the Ravi basin using Landsat data. Applied Computing and Geosciences. 9, doi: 10.1016/j.acags.2020.100051.
doi: 10.1016/j.acags.2020.100051 |
| [54] |
Tan Z., Guan Q.Y., Lin J.K., et al., 2020. The response and simulation of ecosystem services value to land use/land cover in an oasis, Northwest China. Ecol. Indic. 118, 106711, doi: 10.1016/j.ecolind.2020.106711.
doi: 10.1016/j.ecolind.2020.106711 |
| [55] |
Tran D.X., Pla F., Latorre-Carmona P., et al., 2017. Characterizing the relationship between land use land cover change and land surface temperature. ISPRS-J. Photogramm. Remote Sens. 124, 119-132.
doi: 10.1016/j.isprsjprs.2017.01.001 |
| [56] | Tzeng G.H., Chiang C.H., Li C.W., 2007. Evaluating intertwined effects in e-learning programs: A novel hybrid MCDM model based on factor analysis and DEMATEL. Expert Syst. Appl. 32(4), 1028-1044. |
| [57] | United Nations, 2018. 68% of the World Population Projected to Live in Urban Areas by 2050. [2022-04-02]. https://www.un.org/development/desa/en/news/population/2018-revision-of-world-urbanization-prospects.html. |
| [58] | Viera A.J., Garrett J.M., 2005. Understanding interobserver agreement: The kappa statistic. Fam. Med. 37(5), 360-363. |
| [59] |
Wang S.W., Gebru B.M., Lamchin M., et al., 2020. Land use and land cover change detection and prediction in the Kathmandu District of Nepal using remote sensing and GIS. Sustainability. 12(9), 3925, doi: 10.3390/su12093925.
doi: 10.3390/su12093925 |
| [60] | Weng Q.H., Lu D.S., Schubring J., 2004. Estimation of land surface temperature-vegetation abundance relationship for urban heat island studies. Remote Sens. Environ. 89(4), 467-483. |
| [61] | Xian G., Crane M., 2006. An analysis of urban thermal characteristics and associated land cover in Tampa Bay and Las Vegas using Landsat satellite data. Remote Sens. Environ. 104(2), 147-156 |
| [62] |
Zhao Z.Q., He B.J., Li L.G., et al., 2017. Profile and concentric zonal analysis of relationships between land use/land cover and land surface temperature: Case study of Shenyang, China. Energy Build. 155, 282-295.
doi: 10.1016/j.enbuild.2017.09.046 |
| [63] | Zope P.E., Eldho T.I., Jothiprakash V., 2016. Impacts of land use-land cover change and urbanization on flooding: A case study of Oshiwara River Basin in Mumbai, India. Catena. 145, 142-154. |
| No related articles found! |
| Viewed | ||||||
|
Full text |
|
|||||
|
Abstract |
|
|||||
 REGSUS Wechat
 新公网安备 65010402001202号