Regional Sustainability ›› 2026, Vol. 7 ›› Issue (3): 100353.doi: 10.1016/j.regsus.2026.100353
• Research article • Previous Articles Next Articles
Saul NGARAVA*( )
)
Received:2025-01-23
Revised:2026-01-24
Accepted:2026-05-07
Published:2026-06-30
Online:2026-05-22
Contact:
*E-mail address: SNgarava@lincoln.ac.uk (Saul NGARAVA).
Saul NGARAVA. Impact of regional agriculture on economic development: A reflection from Lincolnshire, the United Kingdom[J]. Regional Sustainability, 2026, 7(3): 100353.
Table 1
Description of variables used in this study."
| GVA for agriculture in the United Kingdom (UK) | GVA for agriculture in Lincolnshire | GDP in the UK | ATB in the UK | |
|---|---|---|---|---|
| Mean (×109 GBP) | 11.18 | 0.57 | 1490.01 | -15.30 |
| Standard deviation (×109 GBP) | 2.15 | 0.20 | 563.13 | 8.66 |
| Kurtosis | -0.60 | 1.09 | -0.81 | -0.15 |
| Skewness | -0.19 | 1.15 | 0.32 | -0.65 |
| Minimum (×109 GBP) | 7.41 | 0.32 | 670.80 | -37.34 |
| Maximum (×109 GBP) | 15.91 | 1.10 | 2717.32 | -5.02 |
| t-statistic | 30.35 | 14.90 | 15.43 | -10.30 |
| Number of observations | 34 | 27 | 34 | 34 |
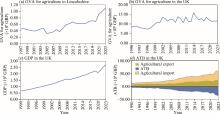
Fig. 1.
GVA for agriculture in Lincolnshire during 1997-2023 (a), and GVA for agriculture in the United Kingdom (UK; b), GDP in the UK (c), and ATB in the UK (d) during 1990-2023. GVA, Gross Value Added; GDP, gross domestic product; ATB, agricultural trade balance."

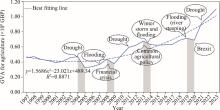
Fig. 2.
Structural breaks in GVA for agriculture in Lincolnshire during 1997-2023."
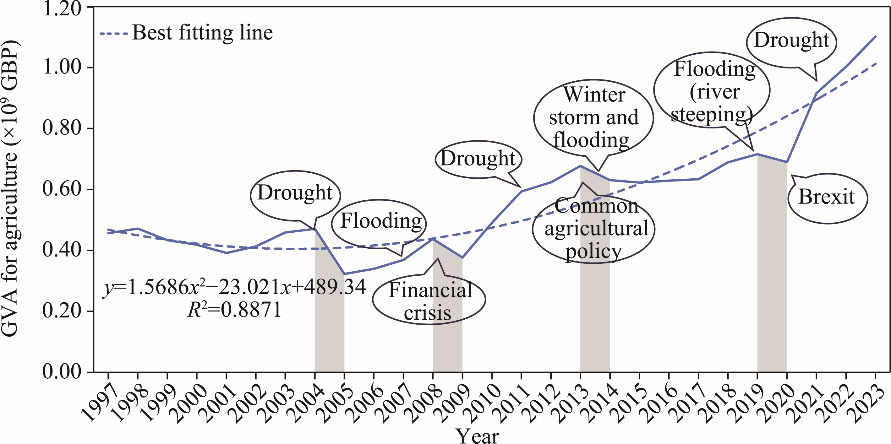
Table 2
Chow test for structural breaks of GVA for agriculture in Lincolnshire."
| Year | Statistic | Statistical value | P-value |
|---|---|---|---|
| 2004 | F-statistic | 3.654 | 0.023 |
| Log likelihood ratio | 15.405 | 0.004 | |
| Wald test statistic | 14.616 | 0.006 | |
| 2008 | F-statistic | 8.126 | 0.001 |
| Log likelihood ratio | 26.924 | 0.000 | |
| Wald test statistic | 32.503 | 0.000 | |
| 2013 | F-statistic | 2.599 | 0.069 |
| Log likelihood ratio | 11.782 | 0.019 | |
| Wald test statistic | 10.394 | 0.034 |
Table 3
Unit root test and optimal lag selection results."
| lnGVAUK per capita | lnGVAL per capita | lnGDPUK per capita | lnATBUK per capita | |||||||
|---|---|---|---|---|---|---|---|---|---|---|
| t-statistic | P-value | t-statistic | P-value | t-statistic | P-value | t-statistic | P-value | |||
| At the level | ADF test statistic | -0.830 | 0.950 | -1.910 | 0.620 | -1.940 | 0.610 | -0.170 | 0.930 | |
| Critical value | 1% level | -4.290 | -4.360 | -4.260 | -3.650 | |||||
| 5% level | -3.560 | -3.600 | -3.550 | -2.960 | ||||||
| 10% level | -3.220 | -3.230 | -3.210 | -2.617 | ||||||
| At the 1st difference | ADF test statistic | -6.500 | 0.000 | -5.350 | 0.000 | -4.740 | 0.000 | -13.070 | 0.000 | |
| Critical value | 1% level | -4.290 | -4.370 | -4.270 | -3.650 | |||||
| 5% level | -3.560 | -3.600 | -3.560 | -2.960 | ||||||
| 10% level | -3.220 | -3.240 | -3.210 | -2.620 | ||||||
| Lag | AIC | SIC | ||||||||
| Optimal lag structure | 0 | -3.970 | -3.770 | |||||||
| 1 | -8.350* | -7.380* | ||||||||
| 2 | -7.770 | -6.020 | ||||||||
Table 4
Vector Autoregressive (VAR) model results for different variables."
| General VAR model | Parsimonious VAR model | |||||||
|---|---|---|---|---|---|---|---|---|
| d(lnGVAUK per capita) | d(lnGVAL per capita) | d(lnGDPUK per capita) | d(lnATBUK per capita) | d(lnGVAUK per capita) | d(lnGVAL per capita) | d(lnGDPUK per capita) | d(lnATBUK per capita) | |
| d(lnGVAUK per capita (-1)) | -0.577** (0.241) [-2.400] | -0.026 (0.225) [-0.116] | -0.074 (0.054) [-1.367] | -0.109 (0.219) [-0.498] | -0.573*** (0.208) [-2.751] | - | -0.061 (0.049) [-1.227] | - |
| d(lnGVAUK per capita (-2)) | -0.425* (0.245) [-1.737] | 0.191 (0.229) [0.834] | 0.044 (0.055) [0.796] | -0.108 (0.222) [-0.485] | -0.435** (0.217) [-1.998] | 0.187 (0.189) [0.990] | 0.045 (0.051) [0.890] | - |
| d(lnGVAL per capita (-1)) | -0.033 (0.270) [-0.124] | -0.156 (0.253) [-0.616] | -0.068 (0.061) [-1.117] | -0.068 (0.246) [-0.278] | - | -0.153 (0.232) [-0.662] | -0.061 (0.058) [-1.064] | - |
| d(lnGVAL per capita (-2)) | -0.119 (0.233) [-0.509] | 0.047 (0.218) [0.215] | 0.021 (0.052) [0.407] | -0.134 (0.212) [-0.633] | -0.134 (0.210) [-0.637] | - | - | -0.125 (0.178) [-0.705] |
| d(lnGDPUK per capita (-1)) | 0.652 (1.106) [0.589] | -1.114 (1.035) [-1.075] | 0.321 (0.248) [1.298] | 1.501 (1.005) [1.494] | 0.623 (1.082) [0.576] | -1.202 (0.944) [-1.274] | 0.313 (0.233) [1.340] | 1.549* (0.797) [1.943] |
| d(lnGDPUK per capita (-2)) | 0.411 (1.524) [0.270] | -2.501* (1.427) [-1.753] | -0.374 (0.341) [-1.098] | 0.265 (1.385) [0.192] | - | -2.474** (1.214) [-2.039] | -0.355 (0.314) [-1.130] | - |
| d(lnATBUK per capita (-1)) | 0.102 (0.287) [0.357] | 0.458* (0.268) [1.706] | 0.077 (0.064) [1.198] | -0.538** (0.261) [-2.065] | - | 0.447* (0.245) [1.825] | 0.077 (0.061) [1.262] | -0.512** (0.207) [-2.476] |
| d(lnATBUK per capita (-2)) | 0.095 (0.270) [0.352] | 0.167 (0.252) [0.662] | 0.082 (0.060) [1.362] | -0.170 (0.245) [-0.695] | - | 0.209 (0.218) [0.960] | 0.064 (0.054) [1.185] | -0.195 (0.214) [-0.915] |
| Constant | -0.034 (0.062) [-0.547] | 0.111* (0.058) [1.918] | 0.027* (0.014) [1.940] | 0.048 (0.056) [0.853] | -0.027 (0.050) [-0.528] | 0.109** (0.053) [2.068] | 0.029** (0.013) [2.174] | 0.051 (0.042) [1.212] |
| R2 | 0.379 | 0.376 | 0.321 | 0.393 | 0.371 | 0.373 | 0.290 | 0.377 |
| Adjusted R2 | 0.047 | 0.043 | -0.042 | 0.069 | 0.197 | 0.164 | -0.003 | 0.246 |
| Durbin Watson statistic | 1.684 | 2.160 | 2.086 | 1.552 | 1.730 | 2.070 | 2.070 | 1.593 |
| Log(likelihood) | 117.675 | |||||||
| AIC | -6.806 | |||||||
| SIC | -5.039 | |||||||
Table 5
Autocorrelation, normality, and heteroscedasticity diagnostic tests."
| Lag | Likelihood ratio error statistic | Probability | Rao F-statistic | Probability | |
|---|---|---|---|---|---|
| Autocorrelation test | At lag 1 | 29.461 | 0.021 | 2.359 | 0.026 |
| At lag 2 | 18.384 | 0.302 | 1.213 | 0.324 | |
| At lag 3 | 8.820 | 0.921 | 0.496 | 0.926 | |
| At lag 1 | 29.461 | 0.021 | 2.359 | 0.026 | |
| At lags 1-2 | 49.506 | 0.025 | 1.967 | 0.074 | |
| Normality test | Jarque-Bera | 22.479 | |||
| Probability | 0.004 | ||||
| Heteroscedasticity test | Chi-square | 163.114 | |||
| Probability | 0.417 | ||||
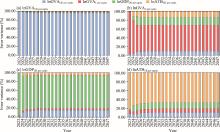
Fig. 3.
Error variance of lnGVAUK per capita (a), lnGVAL per capita (b), lnGDPUK per capita (c), and lnATBUK per capita (d) during 2023-2047. lnGVAUK per capita, logarithmic value of GVA per capita in the UK; lnGVAL per capita, logarithmic value of GVA per capita in Lincolnshire; lnGDPUK per capita, logarithmic value of GDP per capita in the UK; lnATBUK per capita, logarithmic value of ATB per capita in the UK."

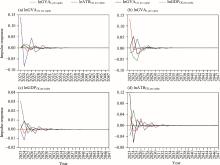
Fig. 4.
Impulse responses of lnGVAUK per capita (a), lnGVAL per capita (b), lnGDPUK per capita (c), and lnATBUK per capita (d) during 2023-2047. The impulse response shows the time required to reach equilibrium after an impulse (or shock) in the system."
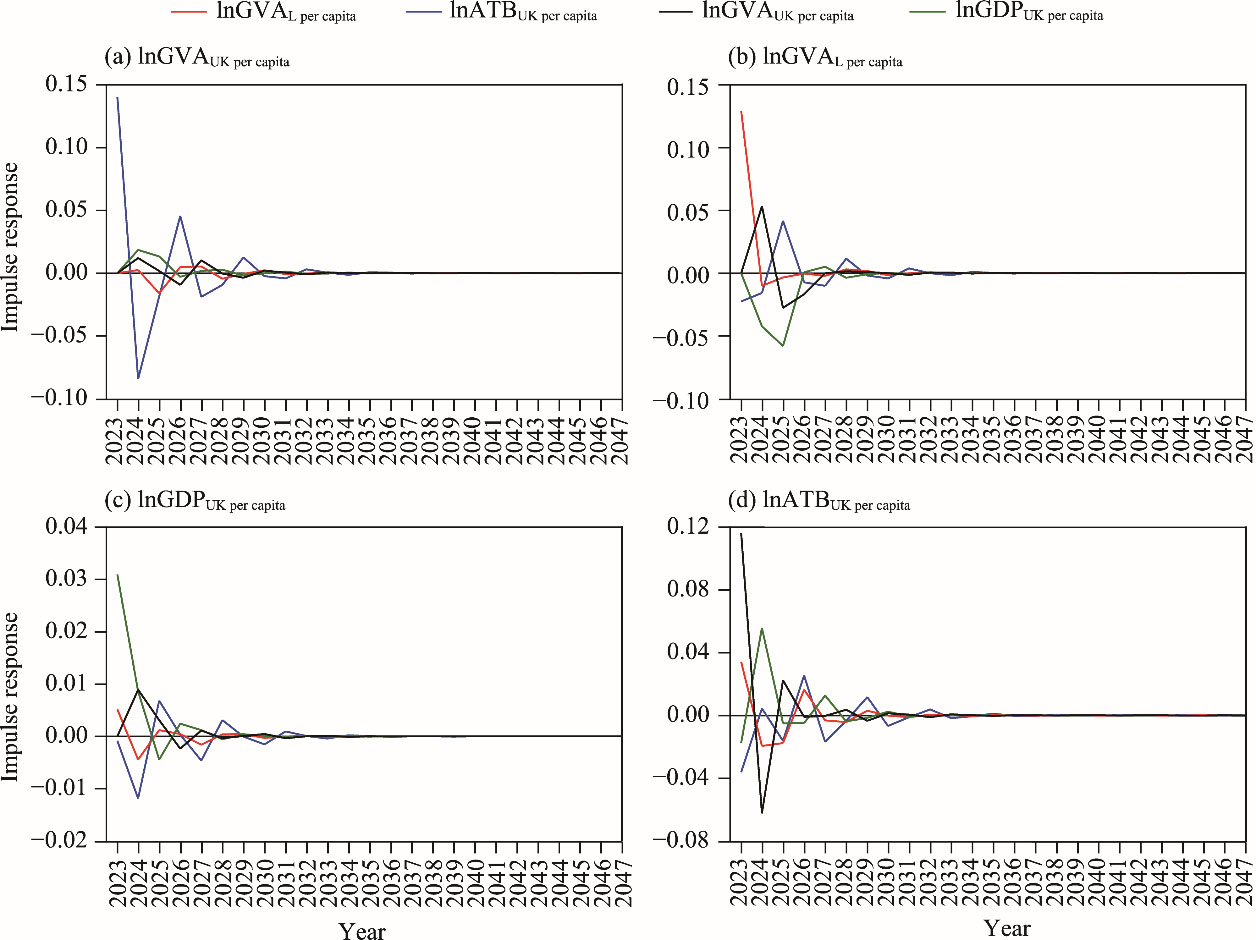
Table S1
Vector autoregressive (VAR) model results for the variables."
| General VAR model | Parsimonious VAR model | |||||||
|---|---|---|---|---|---|---|---|---|
| d(lnGVAUK per capita) | d(lnGVAL per capita) | d(lnGDPUK per capita) | d(lnATBUK per capita) | d(lnGVAUK per capita) | d(lnGVAL per capita) | d(lnGDPUK per capita) | d(lnATBUK per capita) | |
| d(lnGVAUK per capita) | 0.177 (0.213) [0.831] | 0.123 (0.199) [0.616] | 0.012 (0.047) [0.260] | -0.413** (0.177) [-2.329] | 0.008 (0.084) [0.093] | 0.093 (0.177) [0.527] | 0.012 (0.047) [0.260] | -0.413** (0.177) [-2.329] |
| d(lnGVAL per capita (-1)) | 1.263 (1.002) [1.260] | -1.731* (0.936) [-1.850] | 0.193 (0.219) [0.879] | 1.801** (0.835) [2.158] | 1.173 (0.843) [1.390] | -1.661* (0.861) [-1.928] | 0.193 (0.219) [0.879] | 1.801** (0.835) [2.158] |
| d(lnGDPUK per capita (-1)) | 0.070 (0.223) [0.313] | 0.043 (0.208) [0.206] | -0.033 (0.049) [-0.669] | -0.083 (0.186) [-0.448] | -0.033 (0.049) [-0.669] | -0.083 (0.186) [-0.448] | ||
| d(lnATBUK per capita (-1)) | -0.371* (0.199) [-1.861] | -0.179 (0.186) [-0.960] | -0.082* (0.044) [-1.881] | -0.090 (0.166) [-0.544] | -0.346** (0.174) [-1.982] | -0.187 (0.175) [-1.066] | -0.082* (0.044) [-1.881] | -0.090 (0.166) [-0.544] |
| Constant | -0.046 (0.045) [-1.029] | 0.078* (0.042) [1.877] | 0.028*** (0.010) [2.923] | 0.028 (0.037) [0.766] | -0.038 (0.038) [-1.002] | 0.081** (0.039) [2.059] | 0.028*** (0.010) [2.923] | 0.028 (0.037) [0.766] |
| R2 | 0.226 | 0.224 | 0.165 | 0.342 | 0.160 | 0.217 | 0.165 | 0.342 |
| Adjusted R2 | 0.071 | 0.069 | -0.002 | 0.211 | 0.070 | 0.110 | -0.002 | 0.211 |
| Durbin Watson statistic | 2.239 | 2.122 | 0.030 | 2.193 | 2.195 | 2.070 | 1.865 | 2.193 |
| Log(likelihood) | 114.376 | |||||||
| AIC | -7.550 | |||||||
| SIC | -6.575 | |||||||
| [1] | Agboola, M.O., Bekun, F.V., Osundina, O.A., et al., 2023. Revisiting the economic growth and agriculture nexus in Nigeria: Evidence from asymmetric cointegration and frequency domain causality approaches. Journal of Public Affairs. 22(1), e2271, doi: 10.1002/pa.2271. |
| [2] | Alam, F., Myovella, G., 2017. Causality between agricultural exports and GDP and its implications for Tanzanian economy. Journal of Economics and Finance. 8(6), 36-49 |
| [3] | Anwar, M.M., Farooqi, S., Khan, G.Y., 2015. Agriculture sector performance: An analysis through the role of agriculture sector share in GDP. Journal of Agricultural Economics, Extension and Rural Development. 3(3), 270-275. |
| [4] | ARS (Agricultural Recruitment Specialists), 2023. Main Challenges Facing the UK Agricultural Sector. [2024-11-05]. https://www.agrirs.co.uk/blog/2022/09/main-challenges-facing-the-uk-agricultural-sector?source=google.com. |
| [5] | Asom, S.T., Ijirshar, V.U., 2016. Impact of agriculture value added on the growth of Nigerian economy. Nigerian Journal of Management Sciences. 5(1), 238-245. |
| [6] | Beck, L., Elliot-Gibbs, S., Maslin, E., 2022. New Map Predicts Areas of Lincolnshire Could Be totally Submerged in Water in 80 Years’ Time. [2024-11-23]. https://www.lincolnshirelive.co.uk/news/local-news/new-map-predicts-areas-lincolnshire-7855395. |
| [7] | Berry, R., Vigani, M., Urquhart, J., 2022. Economic resilience of agriculture in England and Wales: A spatial analysis. Journal of Maps. 18(1), 70-78. |
| [8] | Bretan, J., 2018. It’s 11 Years since Devastating 2007 Flooding in Lincolnshire. [2024-11-23]. https://www.lincolnshirelive.co.uk/news/local-news/its-11-years-devastating-2007-1717866. |
| [9] | Collins and Associates, 2014. Greater Lincolnshire Agri-food Sector Plan 2014-2020. [2024-11-23]. https://www.greaterlincolnshirelep.co.uk/assets/documents/Agri-food_sector_plan_final.pdf. |
| [10] | Curry, N., 2023. Community development and community food in Lincolnshire, United Kingdom: The limitations of neoclassical economics. Community Development. 54(2), 257-270. |
| [11] | DEFRA (Department for Environment, Food and Rural Affairs), 2015. Lincolnshire Leads the Way in Innovation with Exciting New 3D Technology which Tells Farmers when Crops Are Ripe for Harvesting. [2024-11-23]. https://www.gov.uk/government/news/lincolnshire-leads-the-way-in-innovation-with-exciting-new-3d-technology-which-tells-farmers-when-crops-are-ripe-for-harvesting. |
| [12] | DEFRA, 2022. Number of Commercial Holdings and Area by Farm Type and Farm Size: Areas of Land Use, Arable Crops and Horticulture; Number of Livestock and Labor in England by Country. [2024-11-23]. https://www.gov.uk/government/statistical-data-sets/structure-of-the-agricultural-industry-in-england-and-the-uk-at-june. |
| [13] | DEFRA, 2024a. United Kingdom Food Security Report 2024: Theme 2:UK Food Supply Sources. [2024-11-23]. https://www.gov.uk/government/statistics/united-kingdom-food-security-report-2024/united-kingdom-food-security-report-2024-theme-2-uk-food-supply-sources#:-:text=Consumers%20continue%20to%20demand%20both,on%20fruit%20and%20vegetable%20imports. |
| [14] | DEFRA, 2024b. Farming Evidence - Key Statistics (Accessible Version). [2024-11-23]. https://www.gov.uk/government/publications/farming-evidence-pack-a-high-level-overview-of-the-uk-agricultural-industry/farming-evidence-key-statistics-accessible-version. |
| [15] | DEFRA, 2024c. UK Food Security Report 2024 [2024-11-23]. https://assets.publishing.service.gov.uk/media/6756e355d89258d2868dae76/United_Kingdom_Food_Security_Report_2024_11dec2024_web_accessible.pdf. |
| [16] | Dockerty, T., Lovett, A., Appleton, K., et al., 2006. Developing scenarios and visualisations to illustrate potential policy and climatic influences on future agricultural landscapes. Agriculture, Ecosystem, and Environment. 114(1), 103-120. |
| [17] | Doyle, B., 2024. Arable Farming in Lincolnshire. [2024-11-23]. https://lincolnshire.org/lincolnshire-arable-farming/. |
| [18] | Elalaoui, O., Fadlaoui, A., Maatala, N., et al., 2021. Agriculture and GDP causality nexus in Morocco: Empirical evidence from a VAR approach. International Journal of Agricultural Economics. 6(4), 198-207. |
| [19] | Environmental, Agency, 2013. Tidal Surge Event-Coastal Surge. [2024-11-23]. https://lincolnshire.moderngov.co.uk/documents/s7054/Tidal%20Surge%20Event%20-%20Coastal%20Surge%20-%20Appendix%20A3.pdf. |
| [20] | Environmental, Agency, 2023. Creating a Better Place: The Fens-Preserving the ‘Breadbasket of Britain’. [2024-12-23]. https://environmentagency.blog.gov.uk/2023/07/17/the-fens-preserving-the-breadbasket-of-britain/. |
| [21] | FAO (Food and Agriculture Organization of the United Nations), 2011. The Future of Food and Farming. London: FAO. |
| [22] | FAOSTAT (Food and Agriculture Organization of the United Nations), 2024. Imports and Exports of Crop and Livestock Production in UK. [2024-12-16]. https://www.fao.org/faostat/en/#data/TCL. |
| [23] | FarmProgress, 2008. Financial Crisis Impact on Agriculture. [2024-10-16]. https://www.farmprogress.com/farm-business/financial-crisis-impact-on-agriculture. |
| [24] | Franks, J.R., 2022. UK agriculture at a crossroads. Outlook on Agriculture. 51(4), 448-459. |
| [25] | Gall, E., Laff, B.W., 2022. Economic factors in agriculture. In: Gall, E., Benkeblia, N., (eds.). Mycoagroecology: Integrating Fungi into Agroecosystems. Boka Raton: CRC Press, 16. |
| [26] | Garcia, M.J., 2022. Post-Brexit trade policy in the UK: placebo policy-making? Journal of European Public Policy. 30(11), 2492-2518. |
| [27] | Gould, I.J., Wright, I., Collison, M., et al., 2020. The impact of coastal flooding on agriculture: A case‐study of Lincolnshire, United Kingdom. Land Degradation and Development. 31(12), 1545-1559. |
| [28] | Grantham, 2019. Brexit: Make or Break for Lincolnshire. [2024-11-23]. https://www.coversure.co.uk/grantham/brexit-make-or-break-for-lincolnshire/. |
| [29] | Gravey, V., 2022. Brexit and the Common Agricultural Policy:there and back again. In: Antonopoulos, I., Bell, M., Čavoški, A., (eds.). The Governance of Agriculture in Post-Brexit UK. London: Routledge, 97-116. |
| [30] | Greater Lincolnshire Local Enterprise Partnership, 2014. Ambitious Plans Set Out for County’s Food Industry. [2024-11-23]. https://www.greaterlincolnshirelep.co.uk/whats-new/ambitious-plans-set-out-for-countys-food-industry/. |
| [31] | Greater Lincolnshire Local Enterprise Partnership, 2018. Brexit Economic Analysis. [2024-11-23]. https://www.greaterlincolnshirelep.co.uk/assets/documents/GLLEP_-_Implications_of_Brexit.pdf. |
| [32] | Griffith, R., O’Connell, M., Smith, K., 2013. Food Expenditure and Nutritional Quality over the Great Recession. [2024-12-23]. https://ifs.org.uk/sites/default/files/output_url_files/bn143.pdf. |
| [33] | Jenkins, K., Nicholls, R.J., Sayers, P.B., et al., 2024. The UK Fens Climate Change Risk Assessment: Big Challenges and Strategic Solutions. [2024-12-23]. https://awinovationhub.co.uk/project/future-fens-integrated-adaptation-ffia/. |
| [34] | Jouanjean, M., 2019. Digital Opportunities for Trade in the Agriculture and Food Sectors. Paris: Organization for Economic Co-operation and Development (OECD) Publishing. |
| [35] | Kaur, R., Sidhu, A.S., 2014. Causal relationship between exports and agricultural GDP in India. Global Business Review. 15(1), 105-120. |
| [36] | Lincolnshire City Council, 2023. Lincolnshire Agricultural Sector Support Report by Scrutiny Panel B on Behalf of the Environment and Economy Scrutiny Committee. [2024-11-23]. https://lincolnshire.moderngov.co.uk/documents/s57083/5.1%20Appendix%20A%20-%20Scrutiny%20Panel%20B%20Final%20Report.pdf. |
| [37] | Lincolnshire Local Enterprise Partnership, 2021. Agri-Food Sector. [2024-11-19]. https://www.greaterlincolnshirelep.co.uk/priorities-and-plans/sectors/agri-food-sector/. |
| [38] | Lincolnshire, Pride, 2023. Farming in Lincolnshire. [2024-11-23]. https://www.pridemagazines.co.uk/lincolnshire/heart-of-the-county/farming-in-lincolnshire/08-2023. |
| [39] | Lloyd, I.L., Thomas, V., Ofoegbu, C., et al., 2023. State of knowledge on UK agricultural peatlands for food production and the net zero transition. Sustainability. 5(23), 16347, doi: 10.3390/su152316347. |
| [40] | Lord, J., Macintosh, A., Partington, A., 2011. The Historic Landscape Characterisation Project for Lincolnshire. The Historic Character of the County of Lincolnshire English Heritage. [2024-11-23]. https://www.n-kesteven.gov.uk/sites/default/files/2023-03/HEV002%20LincsHLC_Report-1.pdf. |
| [41] | Memon, M.H., Baig, W.S., Ali, M., 2008. Causal Relationship Between Exports and Agricultural GDP in Pakistan. [2024-11-23]. https://mpra.ub.uni-muenchen.de/11845/. |
| [42] | Met, Office, 2014. Winter Storms, December 2013 to January 2014. [2024-11-23]. https://www.metoffice.gov.uk/binaries/content/assets/metofficegovuk/pdf/weather/learn-about/uk-past-events/interesting/2013/winter-storms-december-2013-to-january-2014---met-office.pdf. |
| [43] | Mohialden, Y.M., Hussien, N.M., Salman, S.A., et al., 2024. Enhancing agriculture crop classification with deep learning. Babylonian Journal of Artificial Intelligence. 2024, 20-26. |
| [44] | Mulya, S.P., Hudalah, D., 2024. Agricultural intensity for sustainable regional development: A case study in peri-urban areas of Karawang Regency, Indonesia. Regional Sustainability. 5(1), 100117, doi: 10.1016/j.regsus.2024.100117. |
| [45] | Natural, England, 2010. Agricultural Land Classification Map East Midlands Region (ALC005). [2024-11-23]. https://publications.naturalengland.org.uk/publication/143027?category=5954148537204736. |
| [46] | Newman, T., Kaduk, J., Page, S., 2021. Insights into the Carbon Dynamics of a Wasted Peatland under Long Term Drainage and Intensive Agriculture. [2024-11-23]. https://doi.org/10.5194/egusphere-egu21-12670. |
| [47] | Ngarava, S., 2021. Long term relationship between food, energy and water inflation in South Africa. Water-Energy Nexus. 4, 123-133. |
| [48] | Ngarava, S., Zhou, L., Nyambo, P., et al., 2023. Aquaculture production, GHG emission and economic growth in Sub-Sahara Africa. Environmental Challenges. 12, 100737, doi: 10.1016/j.envc.2023.100737. |
| [49] | Nielsen, T., Schünemann, F., McNulty, E., et al., 2015. The Food-Energy-Water Security Nexus:Definitions, Policies, and Methods in an Application to Malawi and Mozambique. Washington DC.: International Food Policy Research Institute. |
| [50] | Odero, E.E., 2017. Analysing the causal relationship between agricultural value addition and economic growth in Namibia. European Journal of Basic and Applied Sciences. 4(2), 1-8. |
| [51] | Office of National Statistics, 2014. GVA UKF3 Lincolnshire Agriculture Raw Total £m. [2024-11-16]. https://www.ons.gov.uk/economy/grossvalueaddedgva/timeseries/r4s6/ragv. |
| [52] | Office of National Statistics, 2024a. Gross Domestic Product at Market Prices: Current Price:Seasonally Adjusted £m. [2024-11-15]. https://www.ons.gov.uk/economy/grossdomesticproductgdp/timeseries/ybha/qna. |
| [53] | Office of National Statistics, 2024b. Mid-Year Population Estimates Relate to the usually Resident Population. [2024-12-16]. https://www.ons.gov.uk/generator?format=xls&uri=/peoplepopulationandcommunity/populationandmigration/populationestimates/timeseries/ukpop/pop. |
| [54] | Osama, A., Walid, S., 2018. Studying the volatility effect of agricultural exports on agriculture share of GDP: The case of Egypt. African Journal of Agricultural Research. 13(8), 345-352. |
| [55] | Peacock, M., Ridley, L.M., Evans, C.D., et al., 2017. Management effects on greenhouse gas dynamics in fen ditches. Science of the Total Environment. 578, 601-612. |
| [56] | Posit, Team, 2025. RStudio:Integrated Development Environment for R. Boston: PBC company. |
| [57] | Poyda, A., Reinsch, T., Kluß, C., et al., 2016. Greenhouse gas emissions from fen soils used for forage production in northern Germany. Biogeosciences. 13(18), 5221-5244. |
| [58] | Rahman, Z., Hossain, M.E., 2014. Role of agriculture in economic growth of Bangladesh: A VAR approach. Journal of Business. 7, 163-185. |
| [59] | Réti, M., Bak, K., 2016. The Common Agricultural Policy with and without the United Kingdom-CAP Brexit. ELTE Law Journal. 1, 163-184. |
| [60] | Sawyer, M., 2019. Shifting industrial structures and industrial policies in the UK. Africa Development Group Economic Governance and Knowledge Management. 3(3), 1-22. |
| [61] | Simmons, I.G., Foster, M.R., 2024. Both ‘firmer’ and ‘queachy’: Drainage of the lands along the Lincolnshire Wash in the seventeenth century. Water History. 15, 315-35. |
| [62] | Statistica, 2024. Gross Value Added of the Agriculture, Forestry and Fishing Sector in the United Kingdom from 1990 to 2023. [2024-11-16]. https://www.statista.com/statistics/285063/agriculture-forestry-and-fishing-gva/. |
| [63] | Storper, D., 2017. Huge Potential Economic Impact of Saline Flooding. [2024-11-23]. https://northsearegion.eu/salfar/news/huge-potential-economic-impact-of-saline-flooding/. |
| [64] | Sun, H., Li, D., 2020. An empirical study on fiscal science and technology expenditure and agricultural economic growth under digital economy. Scientific Journal of Economics and Management Research. 2(7), 9-17. |
| [65] | TAC (The Andersons Centre), 2024 Budget 2024 - Significant Challenges for UK Family Farms. [2024-12-20]. https://theandersonscentre.co.uk/budget-2024-significant-challenges-for-uk-family-farms/#:-:text=Following%20the%20recent%20Budget%2C%20UK,overall%20structure%20of%20UK%20agriculture. |
| [66] | Tanneberger, F., Birr, F., Couwenberg, J., et al., 2022. Saving soil carbon, greenhouse gas emissions, biodiversity and the economy: paludiculture as sustainable land use option in German fen peatlands. Regional Environmental Change. 22(2), 69, doi: 10.1007/s10113-022-01900-8. |
| [67] | Udoh, B.C., Adelaja, O.A., 2021. Impact of agricultural trade policies and export values of agricultural commodities on gross domestic product (GDP) in Nigeria. International Journal of Agricultural Policy and Research. 9(4), 111-117. |
| [68] | UK, Government, 2025. Total Income from Farming in the East Midlands. [2025-01-14]. https://www.gov.uk/government/statistics/total-income-from-farming-for-the-regions-of-england/total-income-from-farming-in-the-east-midlands#:-:text=Lincolnshire%20had%20the%20largest%20crop,million%20(3%25)%20from%202022. |
| [69] | Yu, Y.P., 2019. The influence of circulation services industry to agriculture in the New Normal—Take Henan Province as an Example. American Journal of Industrial and Business Management. 9(11), 2050-2063. |
| [70] | Zeng, G.L., Zhang, C.G., Li, S.X, et al., 2021. The dynamic impact of agricultural fiscal expenditures and gross agricultural output on poverty reduction: A VAR model analysis. Sustainability. 13(11), 5766, doi: 10.3390/su13115766. |
| [71] | Zhang, Q.Q., Lin, F.Q., Wang, X.Q., et al., 2024. When cobweb meets oligopoly. China Agricultural Economic Review. 16(4), 787-803. |
| [1] | Md. Shaddam HOSSAIN, Liton Chandra VOUMIK, Tahsin Tabassum AHMED, Mehnaz Binta ALAM, Zabin TASMIM. Impact of geopolitical risk, GDP, inflation, interest rate, and trade openness on foreign direct investment: Evidence from five Southeast Asian countries [J]. Regional Sustainability, 2024, 5(4): 100177-. |
| Viewed | ||||||
|
Full text |
|
|||||
|
Abstract |
|
|||||
 REGSUS Wechat
 新公网安备 65010402001202号