
Regional Sustainability ›› 2026, Vol. 7 ›› Issue (5): 100393.doi: 10.1016/j.regsus.2026.100393
• Research article • Previous Articles
CHEN Fenga,*( ), LAN Yaxina, REN Jiaob
Received:2025-06-17
Revised:2026-02-27
Accepted:2026-09-20
Published:2026-09-30
Online:2026-10-12
Contact:
CHEN Feng
E-mail:chenfeng@sxufe.edu.cn
CHEN Feng, LAN Yaxin, REN Jiao. Spatial evolutions and trends of the coupling coordinated development of environment-economy-tourism in China[J]. Regional Sustainability, 2026, 7(5): 100393.
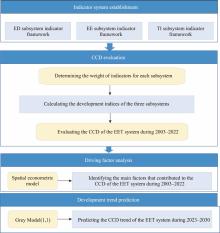
Fig. 1.
Analysis framework used in this study. EE, ecological environment; ED, economic development; TI, tourism industry; CCD, coupling coordination degree; EET, environment-economy-tourism."
Table 1
Evaluation index system used in this study."
| Subsystem | Dimension | Indicator | Causality | Subjective weight | Objective weight | Combined weight |
|---|---|---|---|---|---|---|
| Ecological environment (EE) | Ecological endowment | Per capita water resources | + | 0.094 | 0.409 | 0.251 |
| Forest coverage | + | 0.134 | 0.070 | 0.102 | ||
| Wetland area | + | 0.107 | 0.163 | 0.135 | ||
| Green coverage ratio | + | 0.121 | 0.117 | 0.119 | ||
| Per capita park green area | + | 0.102 | 0.017 | 0.060 | ||
| Environmental load | Per capita water consumption | - | 0.073 | 0.009 | 0.041 | |
| Total industrial SO2 emissions | - | 0.112 | 0.018 | 0.065 | ||
| Industrial solid waste generation | - | 0.086 | 0.010 | 0.048 | ||
| Collection volume of municipal solid waste | + | 0.076 | 0.080 | 0.078 | ||
| Total afforestation area | + | 0.095 | 0.106 | 0.100 | ||
| Economic development (ED) | Economic growth and structure | Gross regional product (GRP) per capita | + | 0.088 | 0.065 | 0.077 |
| Share of the secondary sector | + | 0.109 | 0.014 | 0.062 | ||
| Share of the tertiary sector | + | 0.097 | 0.041 | 0.069 | ||
| GRP index | + | 0.096 | 0.009 | 0.053 | ||
| Total value of imports and exports of goods | + | 0.069 | 0.207 | 0.138 | ||
| Residents’ life and consumption | Urban residents’ disposable income | + | 0.083 | 0.069 | 0.076 | |
| Rural household consumption expenditure | + | 0.065 | 0.072 | 0.069 | ||
| Total retail sales of consumer goods | + | 0.046 | 0.113 | 0.079 | ||
| Consumer price index | + | 0.058 | 0.014 | 0.036 | ||
| Government finance and investment | Total investment | + | 0.042 | 0.178 | 0.110 | |
| General public budget revenue | + | 0.088 | 0.107 | 0.097 | ||
| Tax revenue | + | 0.158 | 0.111 | 0.135 | ||
| Tourism industry (TI) | Tourism industry core | Number of star-rated hotels | + | 0.097 | 0.143 | 0.120 |
| Operating income of star-rated hotels | + | 0.166 | 0.294 | 0.230 | ||
| Total number of travel agencies | + | 0.297 | 0.167 | 0.232 | ||
| Cultural tourism foundation | Number of museums | + | 0.243 | 0.207 | 0.225 | |
| Passenger turnover | + | 0.197 | 0.189 | 0.193 |
Table 2
Variable definitions and descriptions."
| Research variable | Variable description | Unit | |
|---|---|---|---|
| Explained variable | CCD | Subsystem coupling coordination value | - |
| Explanatory variable | EE | Ecological environment index | - |
| ED | Economic development index | - | |
| TI | Tourism industry index | - | |
| Industrial structure (X1) | Ratio of tertiary‑industry output to secondary‑industry output | % | |
| Degree of openness (X2) | Ratio of foreign trade volume of goods to GRP | % | |
| Economic development level (X3) | GRP per capita | CNY/capita | |
| Government financial support (X4) | Ratio of fiscal expenditure to GRP | % | |
| Urbanization level (X5) | Proportion of urban population | % | |
| Innovation capacity (X6) | Number of patent authorizations | piece | |
Table 3
Specification test results for spatial econometric models."
| Test item | LM-statistic | P-value | Test item | LM-statistic | P-value |
|---|---|---|---|---|---|
| LM-Error | 27.683 | 0.000 | Robust LM-Lag | 59.598 | 0.000 |
| LM-Lag | 82.897 | 0.000 | Hausman test | 73.670 | 0.000 |
| Robust LM-Error | 4.384 | 0.036 |
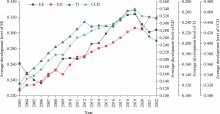
Fig. 2.
Average development level of the EE, ED, and TI subsystems and CCD from 2003 to 2022."
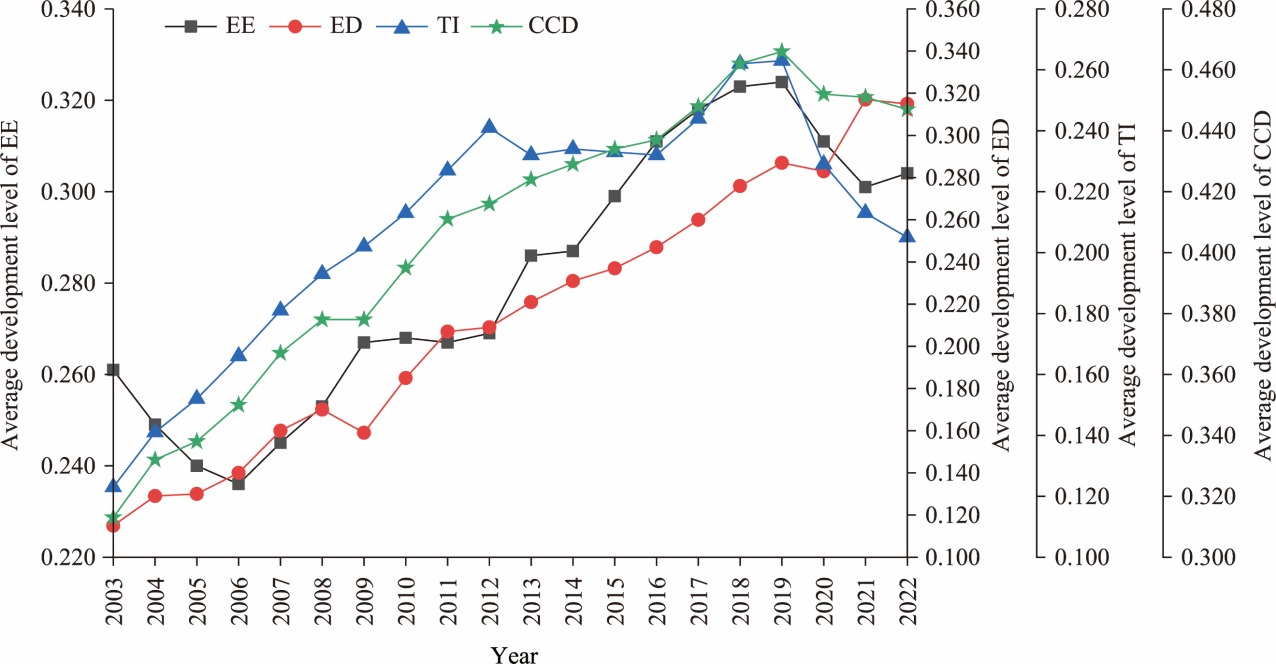
Fig. 3.
Trend of CCD across 31 provinces, municipalities, and autonomous regions of China from 2003 to 2022. Anhui, Anhui Province; Beijing, Beijing Municipality; Chongqing, Chongqing Municipality; Fujian, Fujian Province; Gansu, Gansu Province; Guangdong, Guangdong Province; Guangxi, Guangxi Zhuang Autonomous Region; Guizhou, Guizhou Province; Hainan, Hainan Province; Hebei, Hebei Province; Heilongjiang, Heilongjiang Province; Henan, Henan Province; Hubei, Hubei Province; Hunan, Hunan Province; Inner Mongolia, Inner Mongolia Autonomous Region; Jiangsu, Jiangsu Province; Jiangxi, Jiangxi Province; Jilin, Jilin Province; Liaoning, Liaoning Province; Ningxia, Ningxia Hui Autonomous Region; Qinghai, Qinghai Province; Shaanxi, Shaanxi Province; Shandong, Shandong Province; Shanghai, Shanghai Municipality; Shanxi, Shanxi Province; Sichuan, Sichuan Province; Tianjin, Tianjin Municipality; Xizang, Xizang Autonomous Region; Xinjiang, Xinjiang Uygur Autonomous Region; Yunnan, Yunnan Province; Zhejiang, Zhejiang Province."
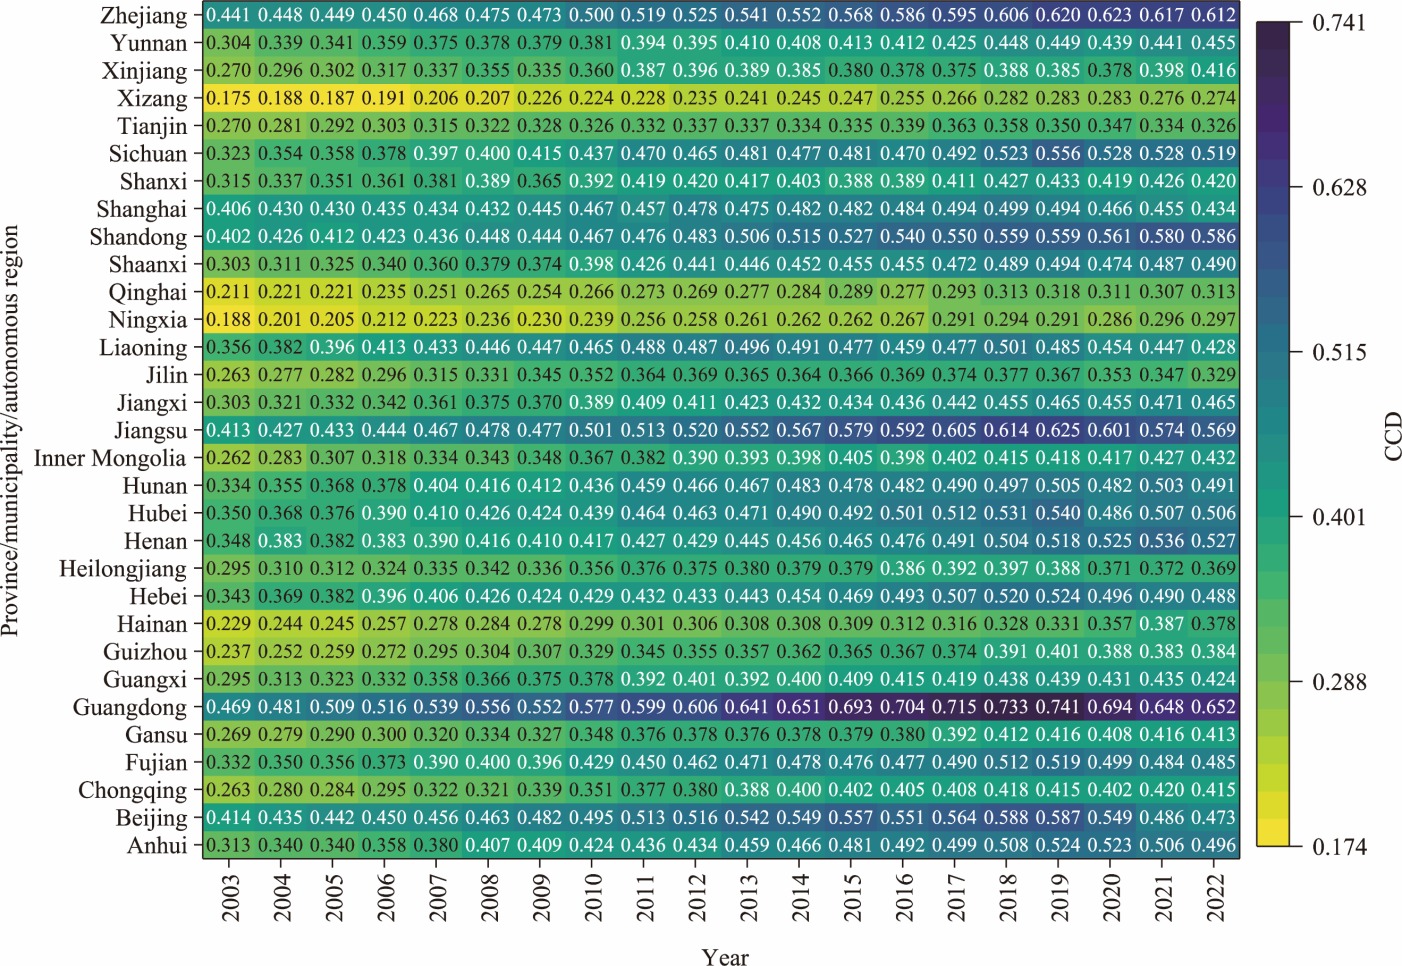
Fig. 4.
Spatial distributions of CCD in 31 provinces, municipalities, and autonomous regions of China in 2003 (a), 2007 (b), 2012 (c), 2017 (d), 2018 (e), 2019 (f), 2020 (g), 2021 (h), and 2022 (i). Note that the figures are based on the standard map (GS(2024)0650) from the National Platform for Common Geospatial Information Services (https://cloudcenter.tianditu.gov.cn/) issued by the Ministry of Natural Resources of the People’s Republic of China, and the boundary of the standard map has not been modified."
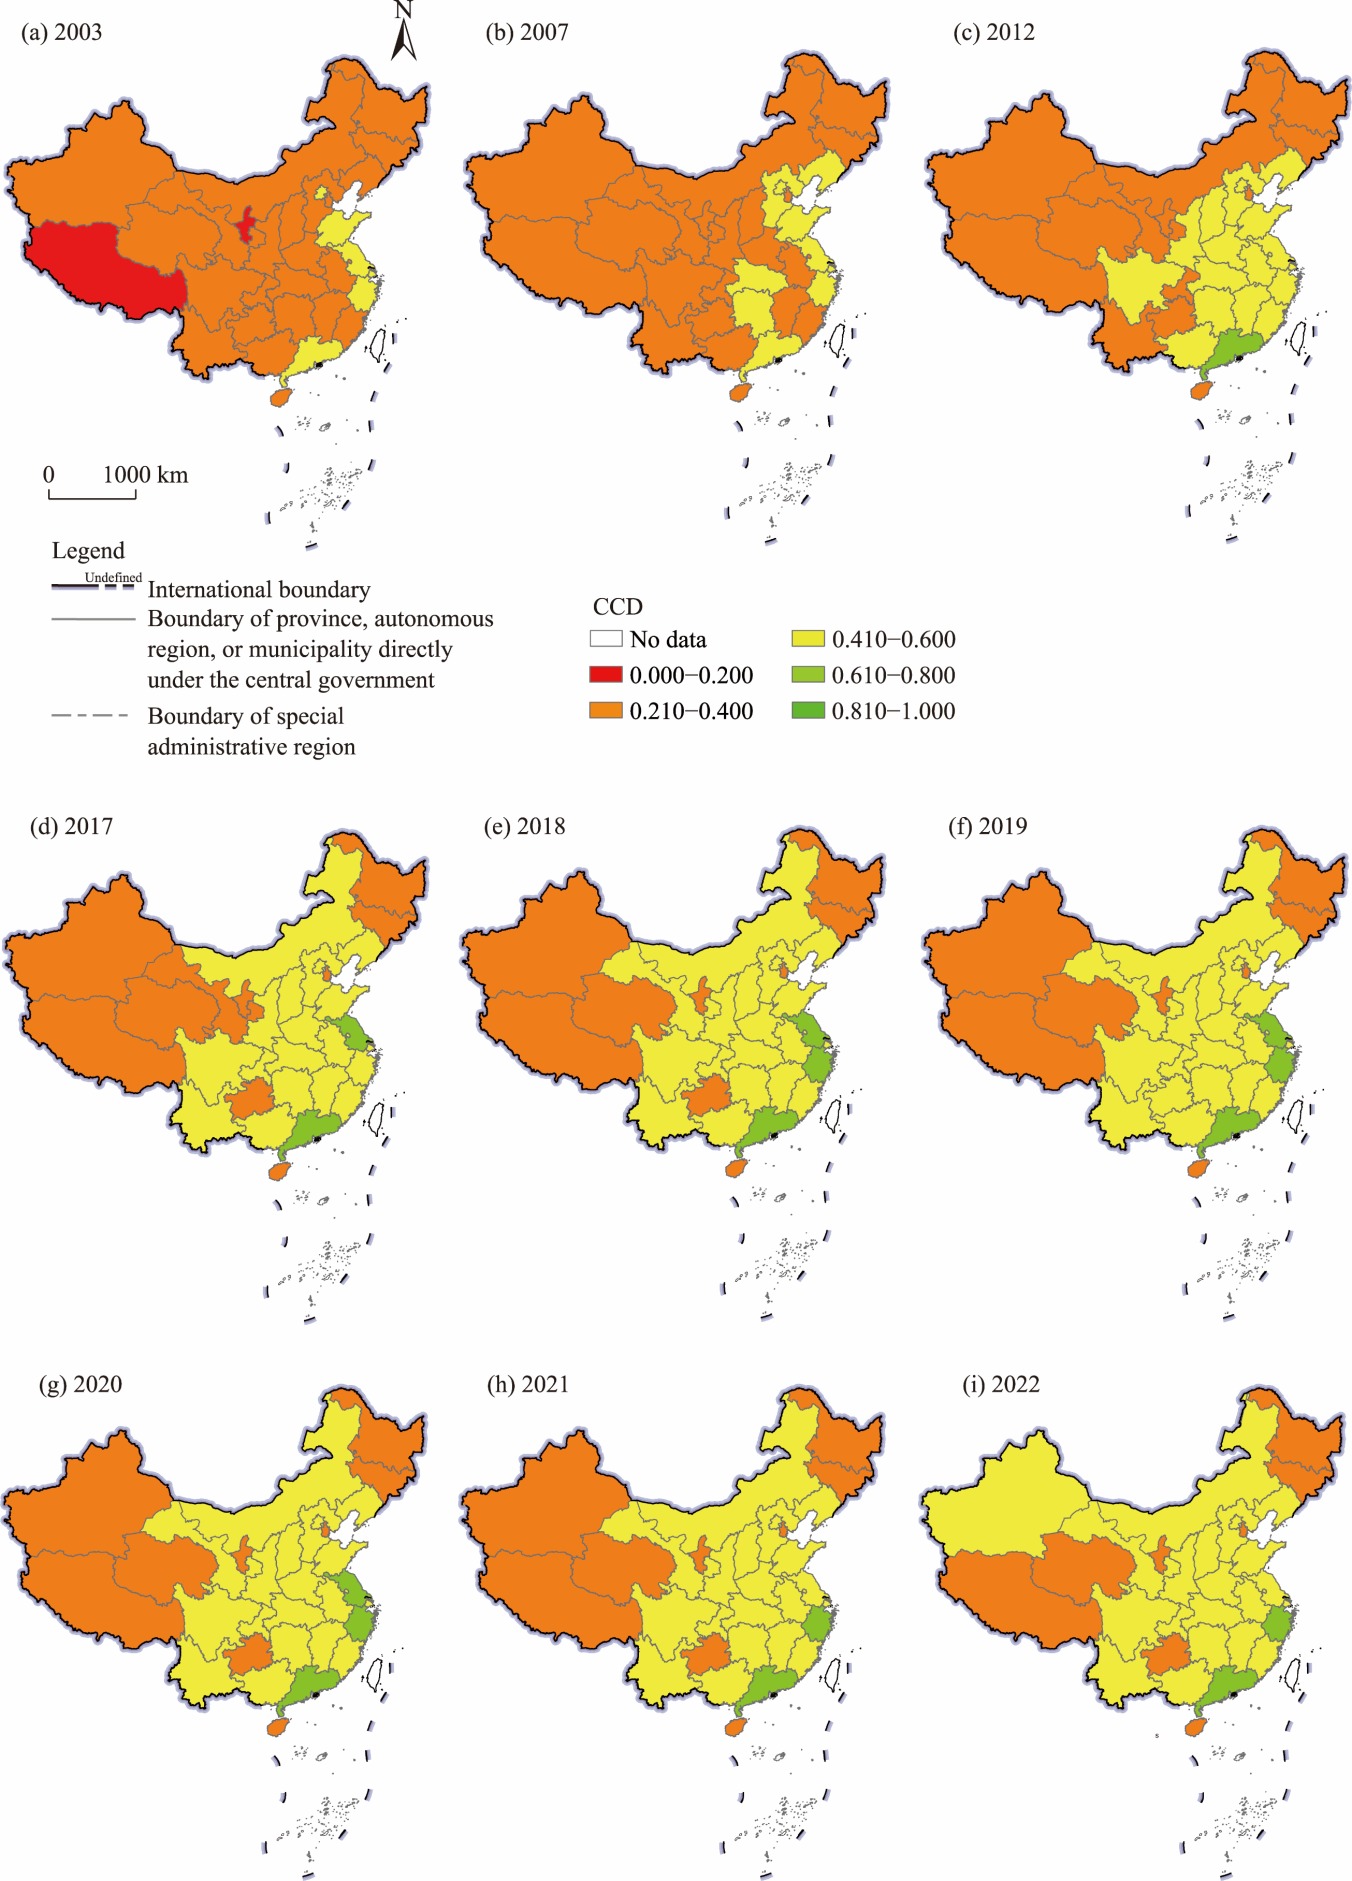
Table 4
Annual average CCD and annual growth rate across eastern, northeastern, central, and western regions in China during 2003-2022."
| Year | Annual average CCD | ||||
|---|---|---|---|---|---|
| Eastern region | Western region | Central region | Northeastern region | Entire study area | |
| 2003 | 0.372 | 0.259 | 0.327 | 0.305 | 0.313 |
| 2004 | 0.389 | 0.276 | 0.351 | 0.323 | 0.332 |
| 2005 | 0.395 | 0.284 | 0.358 | 0.330 | 0.338 |
| 2006 | 0.404 | 0.296 | 0.369 | 0.344 | 0.350 |
| 2007 | 0.419 | 0.315 | 0.388 | 0.361 | 0.367 |
| 2008 | 0.428 | 0.324 | 0.405 | 0.373 | 0.378 |
| 2009 | 0.430 | 0.326 | 0.398 | 0.376 | 0.378 |
| 2010 | 0.449 | 0.340 | 0.416 | 0.391 | 0.395 |
| 2011 | 0.459 | 0.359 | 0.436 | 0.409 | 0.411 |
| 2012 | 0.467 | 0.364 | 0.437 | 0.411 | 0.416 |
| 2013 | 0.482 | 0.368 | 0.447 | 0.414 | 0.424 |
| 2014 | 0.489 | 0.371 | 0.455 | 0.411 | 0.429 |
| 2015 | 0.499 | 0.374 | 0.456 | 0.407 | 0.434 |
| 2016 | 0.508 | 0.373 | 0.463 | 0.405 | 0.437 |
| 2017 | 0.520 | 0.384 | 0.474 | 0.414 | 0.448 |
| 2018 | 0.532 | 0.401 | 0.487 | 0.425 | 0.462 |
| 2019 | 0.535 | 0.406 | 0.498 | 0.413 | 0.466 |
| 2020 | 0.519 | 0.395 | 0.482 | 0.393 | 0.452 |
| 2021 | 0.506 | 0.401 | 0.491 | 0.388 | 0.451 |
| 2022 | 0.500 | 0.403 | 0.484 | 0.375 | 0.447 |
| Regional average value | 0.465 | 0.351 | 0.431 | 0.383 | 0.406 |
| Annual growth rate (%) | 1.016 | 1.024 | 1.021 | 1.011 | 1.019 |
Table 5
Global Moran’s I statistics and significance tests during 2003-2022."
| Year | Global Moran’s I statistic | P-value | z-score | Year | Global Moran’s I statistic | P-value | z-score |
|---|---|---|---|---|---|---|---|
| 2003 | 0.083 | 0.015 | 2.429 | 2013 | 0.071 | 0.029 | 2.185 |
| 2004 | 0.074 | 0.026 | 2.230 | 2014 | 0.074 | 0.025 | 2.235 |
| 2005 | 0.070 | 0.031 | 2.152 | 2015 | 0.069 | 0.031 | 2.161 |
| 2006 | 0.067 | 0.036 | 2.100 | 2016 | 0.074 | 0.024 | 2.251 |
| 2007 | 0.065 | 0.040 | 2.050 | 2017 | 0.076 | 0.021 | 2.303 |
| 2008 | 0.065 | 0.040 | 2.054 | 2018 | 0.060 | 0.051 | 1.953 |
| 2009 | 0.075 | 0.023 | 2.269 | 2019 | 0.058 | 0.056 | 1.908 |
| 2010 | 0.077 | 0.021 | 2.314 | 2020 | 0.072 | 0.028 | 2.199 |
| 2011 | 0.058 | 0.055 | 1.922 | 2021 | 0.074 | 0.025 | 2.235 |
| 2012 | 0.072 | 0.028 | 2.203 | 2022 | 0.057 | 0.060 | 1.883 |
Fig. 5.
Local spatial clustering patterns of CCD in 31 provinces, municipalities, and autonomous regions of China in 2003 (a), 2007 (b), 2012 (c), 2017 (d), 2018 (e), 2019 (f), 2020 (g), 2021 (h), and 2022 (i). HH cluster, high-high cluster; LL cluster, low-low cluster; HL outlier, high-low outlier; LH outlier, low‑high outlier. Note that the figures are based on the standard map (GS(2024)0650) from the National Platform for Common Geospatial Information Services (https://cloudcenter.tianditu.gov.cn/) issued by the Ministry of Natural Resources of the People’s Republic of China, and the boundary of the standard map has not been modified."
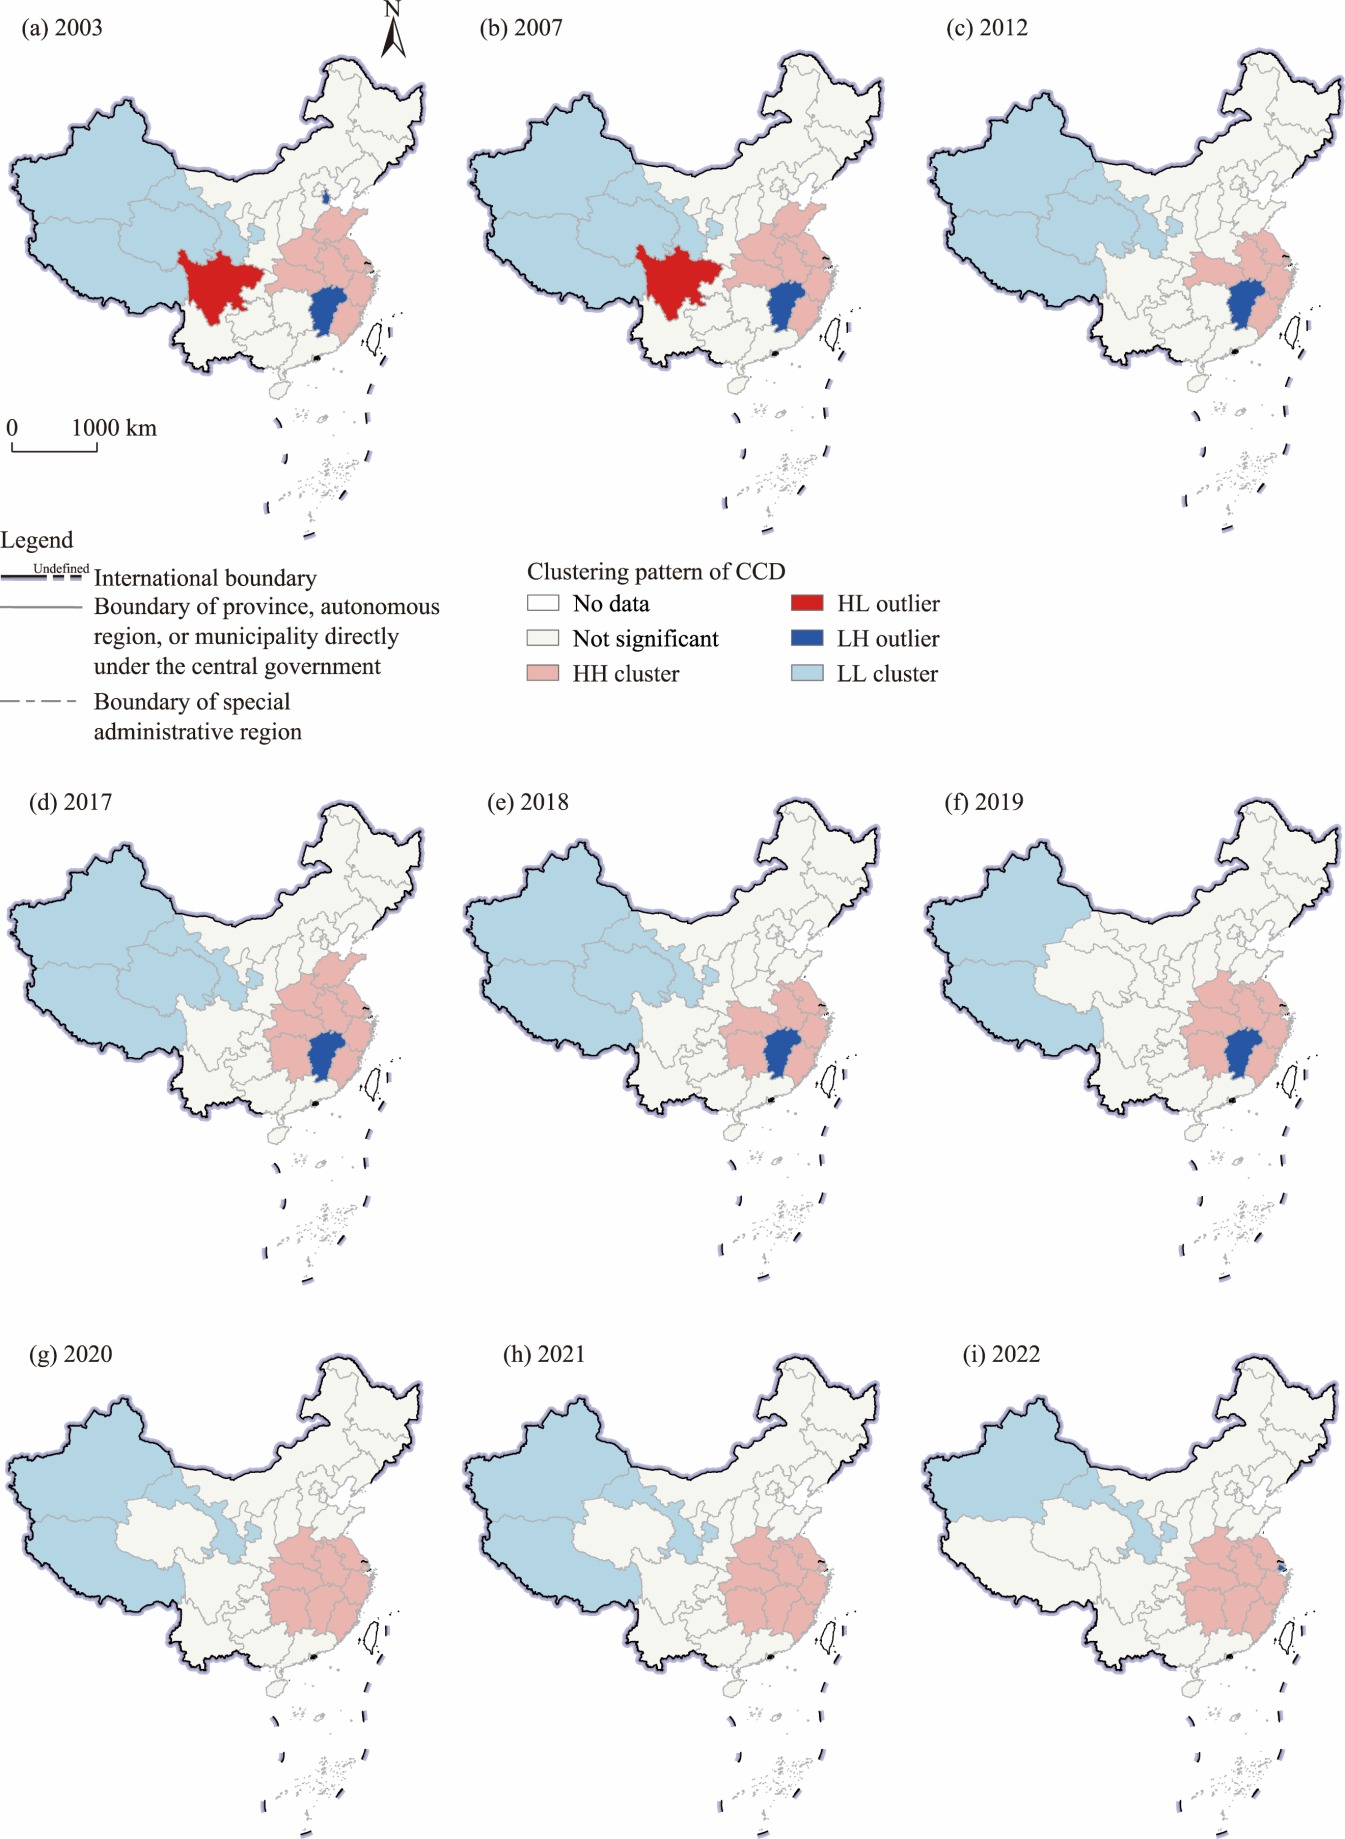
Table 6
Analysis results of spatial effects."
| Explanatory variable | OLS model | SAR model | SEM |
|---|---|---|---|
| EE | 0.156*** (5.04) | 0.078** (2.11) | 0.077** (2.07) |
| ED | 0.476*** (10.41) | 0.304*** (8.55) | 0.300*** (8.62) |
| TI | 0.433*** (21.35) | 0.234*** (10.26) | 0.235*** (10.34) |
| X1 | -0.003 (-0.97) | -0.028*** (-10.24) | -0.028*** (-9.88) |
| X2 | -0.039*** (-6.50) | 0.034*** (5.61) | 0.034*** (5.58) |
| X3 | 0.000 (0.93) | 8.330×10-7* (1.91) | 8.560×10-7* (1.93) |
| X4 | -0.089*** (-11.18) | -0.030** (-2.33) | -0.029** (-2.29) |
| X5 | -0.000*** (-3.15) | -0.001*** (-2.94) | -0.001*** (-2.95) |
| X6 | -0.000*** (-6.40) | -3.900×10⁻⁸** (-2.15) | -3.760×10⁻⁸** (-2.08) |
| log-likelihood | NA | 1811.3277 | 1811.1887 |
| Variance of the error term | NA | 0.0002*** (17.61) | 0.0002*** (17.61) |
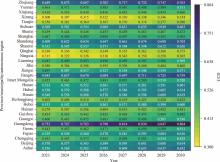
Fig. 6.
Projected CCD across 31 provinces, municipalities, and autonomous regions of China during 2023-2030."
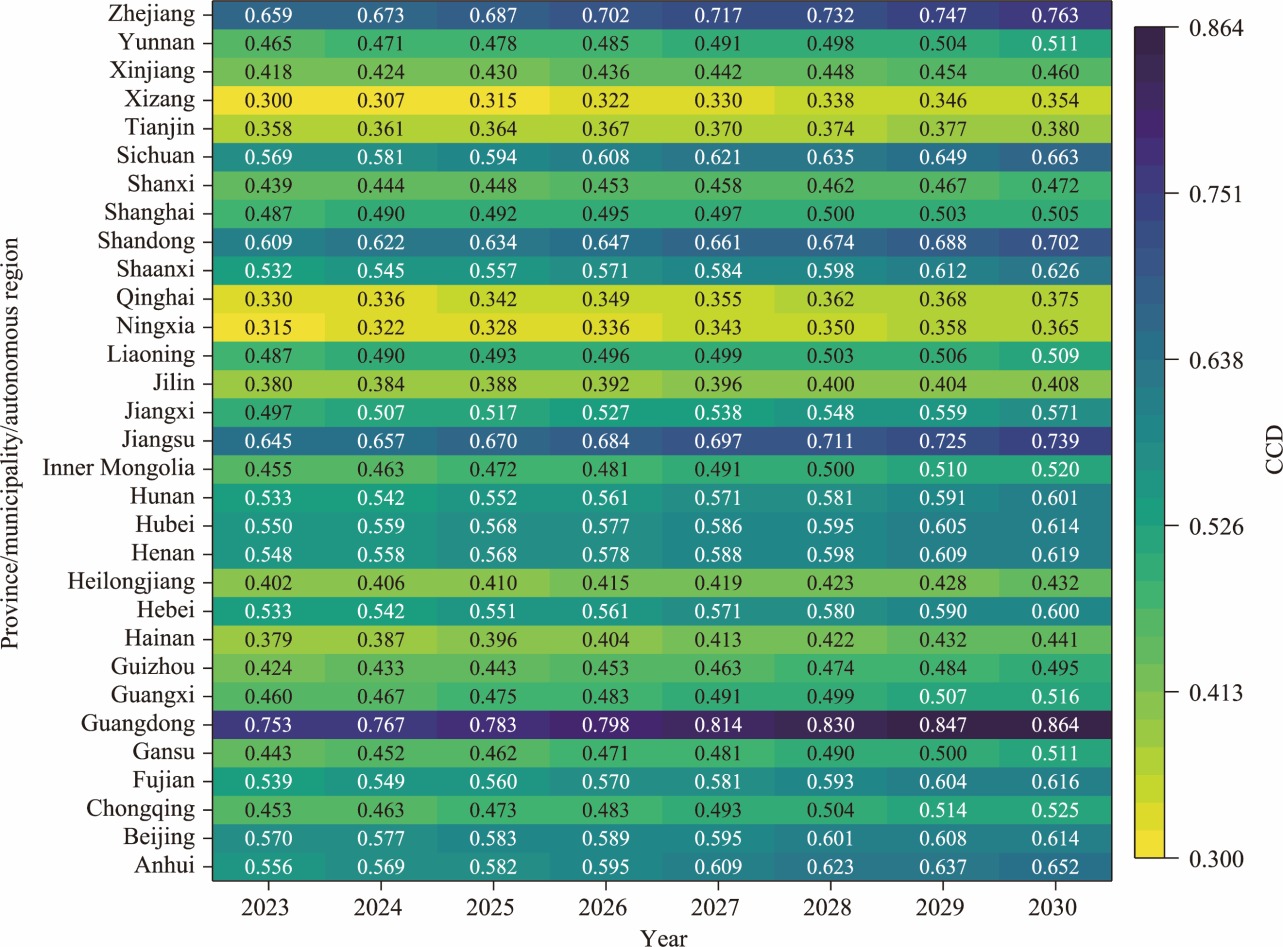
Table S1
Data sources of the statistical yearbooks of 31 provinces, municipalities, and autonomous regions in China."
| Province, municipality, and autonomous region | Data source |
|---|---|
| Beijing Municipality | Beijing Statistical Yearbook 2003-2022 (Beijing Municipal Bureau of Statistics and Survey Office of the National Bureau of Statistics in Beijing, 2004-2023) |
| Tianjin Municipality | Tianjin Statistical Yearbook 2003-2022 (Tianjin Municipal Bureau of Statistics and Survey Office of the National Bureau of Statistics in Tianjin, 2004-2023) |
| Hebei Province | Hebei Statistical Yearbook 2003-2022 (Hebei Provincial Bureau of Statistics and Survey Office of the National Bureau of Statistics in Hebei, 2004-2023) |
| Jiangsu Province | Jiangsu Statistical Yearbook 2003-2022 (Jiangsu Provincial Bureau of Statistics and Survey Office of the National Bureau of Statistics in Jiangsu, 2004-2023) |
| Zhejiang Province | Zhejiang Statistical Yearbook 2003-2022 (Zhejiang Provincial Bureau of Statistics and Survey Office of the National Bureau of Statistics in Zhejiang, 2004-2023) |
| Fujian Province | Fujian Statistical Yearbook 2003-2022 (Fujian Provincial Bureau of Statistics and Survey Office of the National Bureau of Statistics in Fujian, 2004-2023) |
| Shandong Province | Shandong Statistical Yearbook 2003-2022 (Shandong Provincial Bureau of Statistics and Survey Office of the National Bureau of Statistics in Shandong, 2004-2023) |
| Guangdong Province | Guangdong Statistical Yearbook 2003-2022 (Guangdong Provincial Bureau of Statistics and Survey Office of the National Bureau of Statistics in Guangdong, 2004-2023) |
| Shanghai Municipality | Shanghai Statistical Yearbook 2003-2022 (Shanghai Municipal Bureau of Statistics and Survey Office of the National Bureau of Statistics in Shanghai, 2004-2023) |
| Hainan Province | Hainan Statistical Yearbook 2003-2022 (Hainan Provincial Bureau of Statistics and Survey Office of the National Bureau of Statistics in Hainan, 2004-2023) |
| Liaoning Province | Liaoning Statistical Yearbook 2003-2022 (Liaoning Provincial Bureau of Statistics and Survey Office of the National Bureau of Statistics in Liaoning, 2004-2023) |
| Jilin Province | Jilin Statistical Yearbook 2003-2022 (Jilin Provincial Bureau of Statistics and Survey Office of the National Bureau of Statistics in Jilin, 2004-2023) |
| Heilongjiang Province | Heilongjiang Statistical Yearbook 2003-2022 (Heilongjiang Provincial Bureau of Statistics and Survey Office of the National Bureau of Statistics in Heilongjiang, 2004-2023) |
| Shanxi Province | Shanxi Statistical Yearbook 2003-2022 (Shanxi Provincial Bureau of Statistics and Survey Office of the National Bureau of Statistics in Shanxi, 2004-2023) |
| Anhui Province | Anhui Statistical Yearbook 2003-2022 (Anhui Provincial Bureau of Statistics and Survey Office of the National Bureau of Statistics in Anhui, 2004-2023) |
| Jiangxi Province | Jiangxi Statistical Yearbook 2003-2022 (Jiangxi Provincial Bureau of Statistics and Survey Office of the National Bureau of Statistics in Jiangxi, 2004-2023) |
| Henan Province | Henan Statistical Yearbook 2003-2022 (Henan Provincial Bureau of Statistics and Survey Office of the National Bureau of Statistics in Henan, 2004-2023) |
| Hubei Province | Hubei Statistical Yearbook 2003-2022 (Hubei Provincial Bureau of Statistics and Survey Office of the National Bureau of Statistics in Hubei, 2004-2023) |
| Hunan Province | Hunan Statistical Yearbook 2003-2022 (Hunan Provincial Bureau of Statistics and Survey Office of the National Bureau of Statistics in Hunan, 2004-2023) |
| Inner Mongolia Autonomous Region | Inner Mongolia Statistical Yearbook 2003-2022 (Inner Mongolia Autonomous Regional Bureau of Statistics, 2004-2023) |
| Guangxi Zhuang Autonomous Region | Guangxi Statistical Yearbook 2003-2022 (Guangxi Zhuang Autonomous Region Bureau of Statistics and Survey Office of the National Bureau of Statistics in Guangxi, 2004-2023) |
| Chongqing Municipality | Chongqing Statistical Yearbook 2003-2022 (Chongqing Municipal Bureau of Statistics and Survey Office of the National Bureau of Statistics in Chongqing, 2004-2023) |
| Sichuan Province | Sichuan Statistical Yearbook 2003-2022 (Statistical Bureau of Sichuan and Survey Office of the National Bureau of Statistics in Sichuan, 2004-2023) |
| Guizhou Province | Guizhou Statistical Yearbook 2003-2022 (Guizhou Provincial Bureau of Statistics and Survey Office of the National Bureau of Statistics in Guizhou, 2004-2023) |
| Yunnan Province | Yunnan Statistical Yearbook 2003-2022 (Yunnan Provincial Bureau of Statistics, 2004-2023) |
| Gansu Province | Gansu Statistical Yearbook 2003-2022 (Gansu Provincial Bureau of Statistics and Survey Office of the National Bureau of Statistics in Gansu, 2004-2023) |
| Shaanxi Province | Shaanxi Statistical Yearbook 2003-2022 (Shaanxi Provincial Bureau of Statistics and Survey Office of the National Bureau of Statistics in Shaanxi, 2004-2023) |
| Qinghai Province | Qinghai Statistical Yearbook 2003-2022 (Qinghai Provincial Bureau of Statistics and Survey Office of the National Bureau of Statistics in Qinghai, 2004-2023) |
| Ningxia Hui Autonomous Region | Ningxia Statistical Yearbook 2003-2022 (Ningxia Hui Autonomous Region Bureau of Statistics and Survey Office of the National Bureau of Statistics in Ningxia, 2004-2023) |
| Xizang Autonomous Region | Xizang Statistical Yearbook 2003-2022 (Xizang Autonomous Region Bureau of Statistics and Survey Office of the National Bureau of Statistics in Xizang, 2004-2023) |
| Xinjiang Uygur Autonomous Region | Xinjiang Statistical Yearbook 2003-2022 (Statistics Bureau of Xinjiang Uygur Autonomous Region and Survey Office of the National Bureau of Statistics in Xinjiang, 2004-2023) |
| [1] |
Acemoglu D., Aghion P., Bursztyn L., et al., 2012. The environment and directed technical change. American Economic Review. 102(1), 131-166.
pmid: 26719595 |
| [2] | Allen C., Metternicht G., Wiedmann T., 2018. Initial progress in implementing the Sustainable Development Goals (SDGs): A review of evidence from countries. Sustainability Science. 13, 1453-1467. |
| [3] |
Anselin L., 1995. Local indicators of spatial association—LISA. Geographical Analysis. 27(2), 93-115.
doi: 10.1111/gean.1995.27.issue-2 |
| [4] | Baloch Q.B., Shah S.N., Iqbal N., et al., 2023. Impact of tourism development upon environmental sustainability: A suggested framework for sustainable ecotourism. Environmental Science & Pollution Research. 30(3), 5917-5930. |
| [5] | Cassen R.H., 1987. Our common future: report of the World Commission on Environment and Development. International Affairs. 64(1), 126. |
| [6] | Chakraborty, D., Dey O., 2024. Trade, environment and climate change. In: ChakrabortyD., DeyO., (eds.). Influence of WTO and Global Dynamics on Trade Flows:A Machine-Generated Literature Overview. Singapore: Springer Nature, 289-347. |
| [7] | Chen L., Li X., Zhao J.Y., et al., 2024. Coupling and coordinated evolution characteristics of regional economy-energy-carbon emission multiple systems: A case study of main China’s basin. Journal of Environmental Sciences. 140, 204-218. |
| [8] | Cui D., Chen X., Xue Y.L., et al., 2019. An integrated approach to investigate the relationship of coupling coordination between social economy and water environment on urban scale: A case study of Kunming. Journal of Environmental Management. 234, 189-199. |
| [9] | Department of Urban Socio‑Economic Survey, National Bureau of Statistics of China,2004-2023. China City Statistical Yearbook ( 2003-2022). Beijing: China Statistics Press (in Chinese). |
| [10] | Esparza-Huamanchumo R.M., Botezan I., Sánchez-Jiménez R., et al., 2024. Ecotourism, sustainable tourism and nature based tourism: An analysis of emerging fields in tourism scientific literature. Geojournal of Tourism & Geosites. 54(2spl), 953-966. |
| [11] |
Fang C.L., Wang Z.B., Liu H.M., 2020. Beautiful China initiative: Human-nature harmony theory, evaluation index system and application. Journal of Geographical Sciences. 30(5), 691-704.
doi: 10.1007/s11442-020-1750-7 |
| [12] | Galanakis C.M., Brunori G., Chiaramonti D., et al., 2022. Bioeconomy and green recovery in a post-COVID-19 era. Science of The Total Environment. 808, 152180, doi: 10.1016/j.scitotenv.2021.152180. |
| [13] | Hu Y.H., 2002. The methods dealing with co-relation of indicators in comprehensive valuation system. Statistical Research. 3, 39-40 (in Chinese). |
| [14] |
Kan A.K., Li G.Q., Yang X., et al., 2018. Ecological vulnerability analysis of Tibetan towns with tourism-based economy: A case study of the Bayi District. Journal of Mountain Science. 15(5), 1101-1114.
doi: 10.1007/s11629-017-4789-x |
| [15] | Kandel A., 1983. The Analytic Hierarchy Process-Planning, Priority Setting, Resource Allocation, Thomas L. Saaty (Ed.), McGraw-Hill, Basel (1980), p. 287. Fuzzy Sets and Systems. 9(1-3), 216-217. |
| [16] | Lai Z.Z., Ge D.M., Xia H.B., et al., 2020. Coupling coordination between environment, economy and tourism: A case study of China. PLoS ONE. 15(2), e0228426, doi: 10.1371/journal.pone.0228426. |
| [17] | Li J.S., Sun W., Li M.Y., et al., 2021. Coupling coordination degree of production, living and ecological spaces and its influencing factors in the Yellow River Basin. Journal of Cleaner Production. 298, 126803, doi: 10.1016/j.jclepro.2021.126803. |
| [18] | Liu H.Y., Zhang X., Tao S.Y., et al., 2022. A coevolution model of the coupled society—water resources—environment systems: An application in a case study in the Yangtze River Economic Belt, China. Water. 14(15), 2449, doi: 10.3390/w14152449. |
| [19] |
Liu J.G., Dietz T., Carpenter S.R., et al, 2007. Complexity of coupled human and natural systems. Science. 317(5844), 1513-1516.
doi: 10.1126/science.1144004 pmid: 17872436 |
| [20] | Liu J.P., Tian Y., Huang K., et al., 2021. Spatial-temporal differentiation of the coupling coordinated development of regional energy-economy-ecology system: A case study of the Yangtze River Economic Belt. Ecological Indicators. 124, 107394, doi: 10.1016/j.ecolind.2021.107394. |
| [21] | Liu J.S., Li C., Tao J.Q., et al., 2019. Spatiotemporal coupling factors and mode of tourism industry, urbanization and ecological environment: A case study of Shaanxi, China. Sustainability. 11(18), 4923, doi: 10.3390/su11184923. |
| [22] | Liu M.L., Lu M.Y., Li Z.Y., 2024. Coupling coordination analysis on digital economy-tourism development-ecological environment. Journal of Cleaner Production. 470, 143320, doi: 10.1016/j.jclepro.2024.143320. |
| [23] | Liu Y.S., Zou L.L., Wang Y.S., 2020. Spatial-temporal characteristics and influencing factors of agricultural eco-efficiency in China in recent 40 years. Land Use Policy. 97, 104794, doi: 10.1016/j.landusepol.2020.104794. |
| [24] | Liu Z.B., Zhang X.H., Wang J.J., et al., 2023. Evaluation of coupling coordination development between digital economy and green finance: Evidence from 30 provinces in China. PLoS ONE. 18(10), e0291936, doi: 10.1371/journal.pone.0291936. |
| [25] | Ma K.P., Wei F.W., 2021. Ecological civilization: a revived perspective on the relationship between humanity and nature. National Science Review. 8(7), nwab112, doi: 10.1093/nsr/nwab112. |
| [26] | Ma M.Y., Tang J.X., 2022. Interactive coercive relationship and spatio-temporal coupling coordination degree between tourism urbanization and eco-environment: A case study in Western China. Ecological Indicators. 142, 109149, doi: 10.1016/j.ecolind.2022.109149. |
| [27] | Miao X.P., Xie X.M., 2023. Study on the analysis of the coordinated development trend of provincial and regional economy-ecological environment-tourism industry and obstacle degree. Hubei Agricultural Sciences. 62(8), 223-230 (in Chinese). |
| [28] | Ministry of Culture and Tourism of the People’s Republic of China, 2004-2023. The Yearbook of China Tourism Statistics (2003-2022). Beijing: China Travel and Tourism Press (in Chinese). |
| [29] |
Mol A.P.J., 2006. Environment and modernity in transitional China: Frontiers of ecological modernization. Development and Change. 37(1), 29-56.
doi: 10.1111/dech.2006.37.issue-1 |
| [30] |
Moran P.A.P., 1950. Notes on continuous stochastic phenomena. Biometrika. 37(1/2), 17-23.
doi: 10.1093/biomet/37.1-2.17 |
| [31] | National Bureau of Statistics of China, 2004-2023. China Statistical Yearbook (2003-2022). Beijing: China Statistics Press (in Chinese). |
| [32] | National Bureau of Statistics of China, Ministry of Ecology and Environment, 2004-2023. China Statistical Yearbook on Environment (2003-2022). Beijing: China Statistics Press (in Chinese). |
| [33] | Peng R.K., Huang H.C., Ge J.J., et al., 2023. Study on the coupling coordination and pattern evolution of green investment and ecological development: Based on spatial econometric model and China’s provincial panel data. Frontiers in Environmental Science. 10, 1095394, doi: 10.3389/fenvs.2022.1095394. |
| [34] |
Perry J.N., Dixon P.M., 2002. A new method to measure spatial association for ecological count data. Écoscience. 9(2), 133-141.
doi: 10.1080/11956860.2002.11682699 |
| [35] | Qin X.H., Li X.M., 2021. Evaluate on the decoupling of tourism economic development and ecological-environmental stress in China. Sustainability. 13(4), 2149, doi: 10.3390/su13042149. |
| [36] | Qu B., Jiang E.H., Li J.Q., et al., 2024. Coupling coordination relationship of water resources, eco-environment and socio-economy in the water-receiving area of the Lower Yellow River. Ecological Indicators. 160, 111766, doi: 10.1016/j.ecolind.2024.111766. |
| [37] |
Shannon C.E., 1948. A mathematical theory of communication. The Bell Systems Technical Journal. 27(3), 379-423.
doi: 10.1002/bltj.1948.27.issue-3 |
| [38] | Shen H.Y., Teng F., Song J.P., 2018. Evaluation of spatial balance of China’s regional development. Sustainability. 10(9), 3314, doi: 10.3390/su10093314. |
| [39] | Tan J.T., Hu X.H., Hassink R., et al., 2020. Industrial structure or agency: What affects regional economic resilience? Evidence from resource-based cities in China. Cities. 106, 102906, doi: 10.1016/j.cities.2020.102906. |
| [40] | Tao S., Yang S.Y., Zhang W., et al., 2020. Coupling coordination degree measurement and spatiotemporal heterogeneity between economic development and ecological environment: Empirical evidence from tropical and subtropical regions of China. Journal of Cleaner Production. 244, 118739, doi: 10.1016/j.jclepro.2019.118739. |
| [41] | Wang J.K., Han Q., Du Y.H., 2022. Coordinated development of the economy, society and environment in urban China: A case study of 285 cities. Environment, Development & Sustainability. 24(11), 12917-12935. |
| [42] |
Wang S.J., Kong W., Ren L., et al., 2021. Research on misuses and modification of coupling coordination degree model in China. Journal of Natural Resources. 36(3), 793-810 (in Chinese).
doi: 10.31497/zrzyxb.20210319 |
| [43] | Xu F., Wang H., Chi G.Q., 2025. Does market-oriented land conveyance affect regional economic resilience? A spatial and mediation analysis based on 287 Chinese cities. Land Use Policy. 150, 107457, doi: 10.1016/j.landusepol.2024.107457. |
| [44] |
Yang F., Liu L.M., Zhang Z.X., et al., 2025. Research on coupling coordination and influencing factors of ecological environment and tourism economy in Inner Mongolia. Areal Research and Development. 44(6), 124-129 (in Chinese).
doi: 10.3969/j.issn.1003-2363.2025.06.014 |
| [45] | Yang G.H., Yan Y., Yang H.Z., 2020. Application of improved GM(1,1) grey prediction model. Journal of Nanjing University of Science & Technology. 44(5), 575-582 (in Chinese). |
| [46] | Yang Y., Wang R., Tan J.L., 2021. Coupling coordination and prediction research of tourism industry development and ecological environment in China. Discrete Dynamics in Nature & Society. 2021, 6647781, doi: 10.1155/2021/6647781. |
| [47] | Yu J., Wu Q.R., 2024. Research on the coupled and coordinated development of tourism economy and ecological civilization in the Yellow River Basin. Journal of Arid Land Resources and Environment. 38(5), 181-189 (in Chinese). |
| [48] | Zhang H.L., Shen L., Zhong S., et al., 2020. Coal resource and industrial structure nexus in energy-rich area: the case of the contiguous area of Shanxi and Shaanxi Provinces, and Inner Mongolia Autonomous Region of China. Resources Policy. 66, 101646, doi: 10.1016/j.resourpol.2020.101646. |
| [49] | Zhang K.Z., Shen J.Q., He R., et al., 2019. Dynamic analysis of the coupling coordination relationship between urbanization and water resource security and its obstacle factor. International Journal of Environmental Research & Public Health. 16(23), 4765, doi: 10.3390/ijerph16234765. |
| [50] | Zhou C., Feng X.G., Tang R., 2016. Analysis and forecast of coupling coordination development among the regional economy-ecological environment-tourism industry: A case study of provinces along the Yangtze Economic Zone. Economic Geography. 36(3), 186-193 (in Chinese). |
| [51] | Zhou X.X., Cai Z.M., Tan K.H., et al., 2021. Technological innovation and structural change for economic development in China as an emerging market. Technological Forecasting & Social Change. 167(1), 120671, doi: 10.1016/j.techfore.2021.120671. |
| [1] | YAO Shiyu, WANG Haoyue, ZHAO Zhengyuan, ZHANG Yunlong, LYU Yihe, LIU Shiliang, WU Gang, WU Xing. Spatiotemporal heterogeneity of ecosystem health and its divergent responses to multidimensional urbanization in the Jialing River Basin (JRB), China [J]. Regional Sustainability, 2026, 7(5): 100388-. |
| Viewed | ||||||
|
Full text |
|
|||||
|
Abstract |
|
|||||
 REGSUS Wechat
 新公网安备 65010402001202号