Regional Sustainability ›› 2025, Vol. 6 ›› Issue (4): 100245.doi: 10.1016/j.regsus.2025.100245cstr: 32279.14.REGSUS.2025025
• Full Length Article • Previous Articles Next Articles
Franziska OLLENDORFa,*( ), Claudia CORALb, Constant Yves ADOU YAOc, Stefan SIEBERa,d, Katharina LÖHRa,e
Received:2024-08-21
Revised:2025-06-16
Published:2025-08-30
Online:2025-09-15
Contact:
Franziska OLLENDORF
E-mail:franziska.ollendorf@zalf.de
Franziska OLLENDORF, Claudia CORAL, Constant Yves ADOU YAO, Stefan SIEBER, Katharina LÖHR. Leveraging farm heterogeneity to enhance living incomes: A gender-sensitive typology of cocoa farming systems in Côte d’Ivoire[J]. Regional Sustainability, 2025, 6(4): 100245.
Table 1
Overview of final set of variables."
| Category | Variable | Description |
|---|---|---|
| Farm characteristic | Total farm size | |
| Number of cash crops | Four cash crops (including coffee, rubber, oil palm, and cashew) were coded using a binomial code: 0.00=absence and 1.00=presence, and the results are then summed. | |
| Number of staple food crops | Four staple food crops (including corn, rice, manioc, and banana) were coded using a binomial code: 0.00=absence and 1.00=presence, and the results are then summed. | |
| Number of horticulture crops | Five horticulture crops (including okra, eggplant, pepper, cabbage, and carrot) were coded using a binomial code: 0.00=absence and 1.00=presence, and the results are then summed. | |
| Number of fruit trees | Five fruit tree species (including orange, avocado, mango, papaya, and grapefruit) were coded using a binomial code: 0.00=absence and 1.00=presence, and the results are then summed. | |
| Farmer characteristic | Age of household head | The age of household head was classified into 4 options: 1.00=20-40 years, 2.00=41-60 years, 3.00=61-80 years, and 4.00=more than 81 years. |
| Years of cocoa experience | ||
| Share of cocoa income in household income | The share of cocoa income in household income was classified into 5 options: 0.00=household income does not come from cocoa income at all, 0.25=25% of household income comes from cocoa income, 0.50=50% of household income comes from cocoa income, 0.75=75% of household income comes from cocoa income, and 1.00=all household income comes from cocoa income. |
Table 2
Descriptive statistics of model-constituting variables for the four farm types."
| Typology WARD variable (WARD_ALL) | Minimum | Maximum | Mean | Standard deviation | |
|---|---|---|---|---|---|
| Type 1 | Total farm size (hm2) | 1.00 | 40.00 | 8.14 | 6.65 |
| Number of cash crops | 0.00 | 4.00 | 1.17 | 0.91 | |
| Number of staple food crops | 1.00 | 4.00 | 2.83 | 0.83 | |
| Number of horticulture crops | 0.00 | 4.00 | 2.72 | 0.70 | |
| Number of fruit trees | 0.00 | 5.00 | 3.54 | 1.13 | |
| Age of household head | 2.00 | 4.00 | 2.88 | 0.53 | |
| Years of cocoa farming experience (a) | 5.00 | 50.00 | 19.55 | 8.84 | |
| Share of cocoa in household income | 0.25 | 1.00 | 0.63 | 0.20 | |
| Type 2 | Total farm size (hm2) | 1.00 | 21.00 | 6.73 | 4.10 |
| Number of cash crops | 0.00 | 3.00 | 0.80 | 0.81 | |
| Number of staple food crops | 0.00 | 4.00 | 1.49 | 1.15 | |
| Number of horticulture crops | 0.00 | 3.00 | 0.40 | 0.87 | |
| Number of fruit trees | 0.00 | 5.00 | 1.67 | 1.46 | |
| Age of household head | 2.00 | 4.00 | 2.98 | 0.67 | |
| Years of cocoa farming experience (a) | 0.00 | 47.00 | 18.40 | 8.71 | |
| Share of cocoa in household income | 0.25 | 1.00 | 0.62 | 0.25 | |
| Type 3 | Total farm size (hm2) | 1.00 | 9.40 | 5.12 | 2.49 |
| Number of cash crops | 0.00 | 2.00 | 0.43 | 0.58 | |
| Number of staple food crops | 0.00 | 4.00 | 2.35 | 1.06 | |
| Number of horticulture crops | 0.00 | 3.00 | 2.54 | 0.91 | |
| Number of fruit trees | 0.00 | 5.00 | 1.87 | 1.41 | |
| Age of household head | 2.00 | 4.00 | 3.33 | 0.52 | |
| Years of cocoa farming experience (a) | 9.00 | 52.00 | 29.04 | 11.82 | |
| Share of cocoa in household income | 0.50 | 1.00 | 0.82 | 0.14 | |
| Type 4 | Total farm size (hm2) | 1.00 | 15.00 | 5.02 | 2.85 |
| Number of cash crops | 0.00 | 2.00 | 0.48 | 0.66 | |
| Number of staple food crops | 0.00 | 4.00 | 2.26 | 1.27 | |
| Number of horticulture crops | 0.00 | 4.00 | 1.85 | 1.41 | |
| Number of fruit trees | 0.00 | 5.00 | 1.98 | 1.86 | |
| Age of household head | 2.00 | 4.00 | 3.20 | 0.73 | |
| Years of cocoa farming experience (a) | 3.00 | 47.00 | 21.02 | 10.37 | |
| Share of cocoa in household income | 0.25 | 1.00 | 0.68 | 0.22 | |
Table 3
Results of odds ratios and standard errors for the binary logistic regression model."
| Farm type | Household items: radio | Household items: smartphone | GAP: pruning | GAP: twig removal | GAP: sanitary harvest | GAP: crop protection |
|---|---|---|---|---|---|---|
| Type 1 | 3.498*** (0.396) | 11.422*** (0.626) | 3.067*** (0.360) | 1.742 (0.386) | 2.661*** (0.376) | 1.880 (0.440) |
| Type 2 | 2.296** (0.403) | 10.674*** (0.638) | 3.059*** (0.380) | 2.172* (0.402) | 3.181*** (0.394) | 2.263* (0.455) |
| Type 3 | 1.582 (0.444) | 2.573 (0.725) | 2.508** (0.426) | 2.917** (0.446) | 2.397** (0.440) | 2.359* (0.500) |
| Constant | 1.444 (0.307) | 0.070 (0.597) | 0.567 (0.304) | 0.343 (0.335) | 0.382 (0.326) | 0.205 (0.388) |
| Hired labor task: planting | Hired labor task: input application | Hired labor task: input fertilizer | Hired labor task: sanitary harvest | Hired labor task: harvest | Hired labor task: pod collection | |
| Type 1 | 0.580 (0.398) | 0.366** (0.454) | 0.574 (0.406) | 0.203*** (0.455) | 0.462* (0.456) | 0.237*** (0.441) |
| Type 2 | 0.482* (0.430) | 0.374** (0.478) | 0.536 (0.438) | 0.218*** (0.478) | 0.349** (0.478) | 0.407* (0.465) |
| Type 3 | 0.215*** (0.564) | 0.117*** (0.563) | 0.300** (0.565) | 0.136*** (0.555) | 0.347* (0.539) | 0.241*** (0.530) |
| Constant | 1.118 (0.334) | 3.500 (0.401) | 0.800 (0.335) | 3.500 (0.401) | 3.500 (0.401) | 3.000 (0.385) |
| Hired labor task: pod breaking | Hired labor task: fermentation | Hired labor task: drying | Hired labor task: transport | Agroforestry | ||
| Type 1 | 0.329*** (0.429) | 0.185*** (0.456) | 0.249*** (0.431) | 0.442* (0.402) | 0.249*** (0.431) | |
| Type 2 | 0.360** (0.453) | 0.204*** (0.479) | 0.294*** (0.454) | 0.510 (0.428) | 0.294*** (0.454) | |
| Type 3 | 0.212*** (0.529) | 0.157*** (0.549) | 0.212*** (0.529) | 0.248*** (0.532) | 0.212*** (0.529) | |
| Constant | 2.600 (0.372) | 3.500 (0.401) | 2.600 (0.372) | 1.400 (0.338) | 2.560 (0.372) |
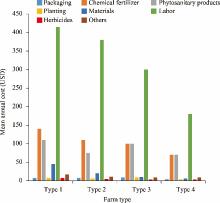
Fig. 1.
Cocoa farming expenses of different farm types."
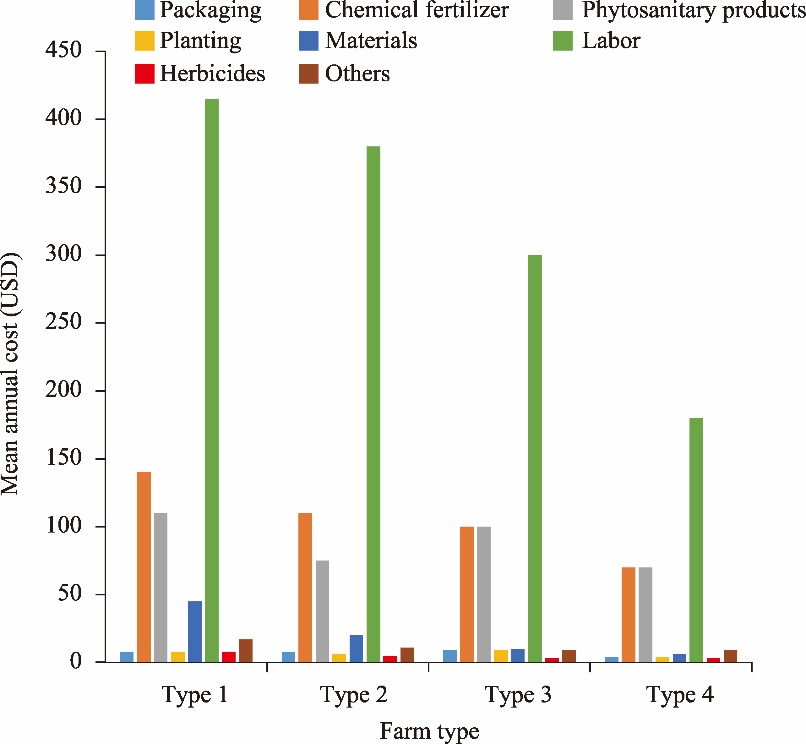
Table 4
Mean annual income from different cash crops and livestock."
| Farm type | Mean annual income from cash crop (USD) | Mean annual income from livestock (USD) | |||
|---|---|---|---|---|---|
| Coffee | Rubber | Oil | Cashew | ||
| Type 1 | 109±280 | 506±1904 | 256±1144 | 23±97 | 552±1570 |
| Type 2 | 91±245 | 523±1758 | 157±495 | 40±309 | 375±884 |
| Type 3 | 80±288 | 13±51 | 35±188 | 12±72 | 244±723 |
| Type 4 | 1±5 | 0±0 | 19±13 | 53±28 | 109±352 |
| Total | 83±250 | 353±1539 | 153±778 | 23±179 | 321±882 |
Table 5
Correlations between living income (LI) gap and various development indicators."
| Farm type | Number of cocoa plots | Size of cocoa plots | Number of other plots | Size of other plots | Cocoa yield during the main harvest season | Cocoa yield during the minor harvest season | Cocoa productivity | Total expenditure on cocoa farms |
|---|---|---|---|---|---|---|---|---|
| Type 1 | -0.40** | -0.46** | -0.27** | -0.29** | -0.75** | -0.59** | -0.36** | -0.47** |
| Type 2 | -0.13 | -0.31** | 0.00 | -0.08 | -0.62** | -0.54** | -0.41* | -0.21 |
| Type 3 | -0.27 | -0.36* | -0.29 | -0.34* | -0.83** | -0.65** | -0.41 | -0.33* |
| Type 4 | -0.15 | -0.73** | 0.07 | 0.14 | -0.88** | -0.76** | -0.34 | -0.15 |
| Income from cash crops | Income from staple food crops | Income from horticulture crops | Income from fruit trees | Income from livestock | Household items: television | Number of household items | ||
| Type 1 | -0.25** | -0.21* | -0.02 | 0.06 | -0.35** | -0.33** | -0.28** | |
| Type 2 | -0.43** | -0.26* | 0.04 | 0.02 | -0.41** | -0.30* | -0.18 | |
| Type 3 | -0.44** | -0.29 | -0.18 | 0.19 | -0.39* | -0.12 | -0.03 | |
| Type 4 | 0.03 | -0.43** | -0.38* | -0.07 | -0.41* | -0.36* | -0.41* |
Table 6
Correlations between variables for the respective LI situations."
| Number of cocoa plots | Size of cocoa plots | Number of other plots | Size of other plots | Total expenditure on cocoa farms | Number of cash crops | Number of staple food crops | Number of horticulture crops | Number of livestock | Number of household items | Use of labor | |
|---|---|---|---|---|---|---|---|---|---|---|---|
| Number of cocoa plots | 1.00 | ||||||||||
| Size of cocoa plots | 0.34** | 1.00 | |||||||||
| Number of other plots | 0.07 | 0.14* | 1.00 | ||||||||
| Size of other plots | 0.04 | 0.11 | 0.76** | 1.00 | |||||||
| Total expenditure on cocoa farms | 0.21** | 0.33** | 0.20** | 0.09 | 1.00 | ||||||
| Number of cash crops | 0.02 | 0.16** | 0.45** | 0.42** | 0.02 | 1.00 | |||||
| Number of staple food crops | 0.11 | 0.12* | 0.07 | 0.07 | 0.16** | 0.15** | 1.00 | ||||
| Number of horticulture crops | 0.07 | 0.05 | 0.08 | -0.02 | -0.01 | 0.17* | 0.44** | 1.00 | |||
| Number of livestock | 0.08 | 0.22** | 0.16** | 0.10 | 0.23** | 0.16** | 0.25** | 0.14* | 1.00 | ||
| Number of household items | 0.09 | 0.17** | 0.15* | 0.16** | 0.11 | 0.17** | -0.01 | -0.03 | 0.13* | 1.00 | |
| Use of labor | 0.15** | 0.20** | 0.08 | 0.08 | 0.22** | 0.05 | -0.06 | -0.12* | -0.05 | 0.14* | 1.00 |
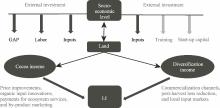
Fig. 2.
Relationships between development variables and possible entry points for actions. LI, living income; GAP, good agricultural practices. Dark grey words together with dark grey lines and arrows represent significant correlations (P<0.05), and light grey words and arrows represent recommendations."
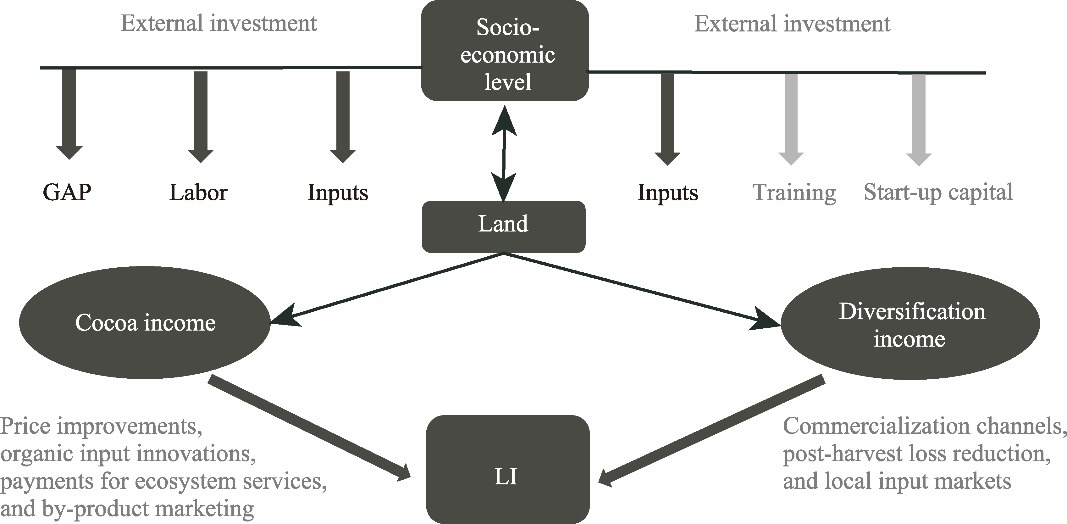
Table S1
Variables with significant differences between farm types."
| Category | Variable | Nature of the variable | Test |
|---|---|---|---|
| Land access and ownership | Number of other plots | Continuous | Kruskal Wallis test |
| Size of other plots | Continuous | Kruskal Wallis test | |
| Socio-economic indicator | Household item: radio | Binary | Binary logistic regression |
| Household item: smartphone | Binary | Binary logistic regression | |
| Farming practice | Hired labor task: planting | Binary | Binary logistic regression |
| Hired labor task: input application | Binary | Binary logistic regression | |
| Hired labor task: fertilizer application | Binary | Binary logistic regression | |
| Hired labor task: sanitary harvest | Binary | Binary logistic regression | |
| Hired labor task: harvest | Binary | Binary logistic regression | |
| Hired labor task: pod collection | Binary | Binary logistic regression | |
| Hired labor task: pod breaking | Binary | Binary logistic regression | |
| Hired labor task: fermentation | Binary | Binary logistic regression | |
| Hired labor task: drying | Binary | Binary logistic regression | |
| Hired labor task: transport | Binary | Binary logistic regression | |
| GAP: pruning | Binary | Binary logistic regression | |
| GAP: twig removal | Binary | Binary logistic regression | |
| GAP: sanitary harvest | Binary | Binary logistic regression | |
| GAP: crop protection | Binary | Binary logistic regression | |
| Agroforestry | Binary | Binary logistic regression | |
| Economic indicator | Cocoa revenue per year | Continuous | Kruskal Wallis test |
| Income from crop diversification | Continuous | Kruskal Wallis test | |
| Total household income | Continuous | Kruskal Wallis test | |
| Expenses for materials | Continuous | Kruskal Wallis test | |
| Income from cash crops | Continuous | Kruskal Wallis test | |
| Income from staple food crops | Continuous | Kruskal Wallis test | |
| Income from horticulture crops | Continuous | Kruskal Wallis test | |
| Income from fruit trees | Continuous | Kruskal Wallis test | |
| Income from livestock | Continuous | Kruskal Wallis test | |
| Income from oilpalm | Continuous | Kruskal Wallis test | |
| Cocoa yield during the main harvest season | Continuous | Kruskal Wallis test | |
| Cocoa yield during the minor harvest season | Continuous | Kruskal Wallis test | |
| Cocoa revenue per year | Continuous | Kruskal Wallis test | |
| Total income from on-farm diversification | Continuous | Kruskal Wallis test | |
| Total household on-farm income | Continuous | Kruskal Wallis test | |
| Living income gap | Continuous | Kruskal Wallis test |
Table S2
Descriptive statistics for land variables."
| Typology WARD variable | Minimum | Maximum | Mean | Standard deviation | |
|---|---|---|---|---|---|
| Type 1 | Number of cocoa plots | 1.00 | 6.00 | 1.63 | 0.96 |
| Size of cocoa plots (hm2) | 1.00 | 32.00 | 5.05 | 4.73 | |
| Number of other plots | 0.00 | 8.00 | 1.63 | 1.48 | |
| Size of other plots (hm2) | 0.00 | 21.00 | 3.09 | 3.73 | |
| Type 2 | Number of cocoa plots | 1.00 | 6.00 | 1.45 | 0.83 |
| Size of cocoa plots (hm2) | 1.00 | 17.00 | 4.17 | 2.95 | |
| Number of other plots | 0.00 | 6.00 | 1.29 | 1.25 | |
| Size of other plots (hm2) | 0.00 | 10.00 | 2.56 | 2.57 | |
| Type 3 | Number of cocoa plots | 1.00 | 4.00 | 1.59 | 0.75 |
| Size of cocoa plots (hm2) | 0.00 | 8.00 | 3.78 | 2.04 | |
| Number of other plots | 0.00 | 4.00 | 0.96 | 0.88 | |
| Size of other plots (hm2) | 0.00 | 5.00 | 1.33 | 1.25 | |
| Type 4 | Number of cocoa plots | 1.00 | 3.00 | 1.34 | 0.52 |
| Size of cocoa plots (hm2) | 1.00 | 15.00 | 3.50 | 2.42 | |
| Number of other plots | 0.00 | 3.00 | 0.85 | 0.89 | |
| Size of other plots (hm2) | 0.00 | 10.00 | 1.54 | 1.94 | |
Table S3
Descriptive statistics for socio-economic indicators."
| Typology WARD variable | Minimum | Maximum | Mean | Standard deviation | |
|---|---|---|---|---|---|
| Type 1 | Years of school attendance (a) | 0.00 | 15.00 | 6.05 | 5.03 |
| Number of household items | 1.00 | 5.00 | 2.76 | 0.99 | |
| Access to cocoa information | 1.00 | 5.00 | 1.97 | 0.93 | |
| Household size | 1.00 | 30.00 | 7.53 | 4.66 | |
| Type 2 | Years of school attendance (a) | 0.00 | 15.00 | 6.18 | 5.30 |
| Number of household items | 0.00 | 11.00 | 2.85 | 1.42 | |
| Access to cocoa information | 1.00 | 5.00 | 1.99 | 0.98 | |
| Household size | 1.00 | 26.00 | 8.27 | 5.03 | |
| Type 3 | Years of school attendance (a) | 0.00 | 15.00 | 5.76 | 5.29 |
| Number of household items | 0.00 | 12.00 | 2.37 | 1.79 | |
| Access to cocoa information | 1.00 | 4.00 | 2.17 | 1.06 | |
| Household size | 1.00 | 21.00 | 7.65 | 5.12 | |
| Type 4 | Years of school attendance (a) | 0.00 | 15.00 | 5.20 | 4.88 |
| Number of household items | 1.00 | 4.00 | 2.09 | 0.91 | |
| Access to cocoa information | 1.00 | 5.00 | 1.88 | 1.01 | |
| Household size | 1.00 | 17.00 | 6.74 | 4.16 | |
Table S4
Descriptive statistics for farming practices."
| Typology WARD variable | Minimum | Maximum | Mean | Standard deviation | |
|---|---|---|---|---|---|
| Type 1 | Number of input types applied | 0.00 | 4.00 | 1.41 | 1.01 |
| Number of hired tasks | 1.00 | 11.00 | 5.59 | 3.41 | |
| On-farm work time (h/d) | 1.00 | 3.00 | 1.82 | 0.59 | |
| Number of secondary crops | 1.00 | 4.00 | 2.22 | 0.93 | |
| Type 2 | Number of input types applied | 0.00 | 3.00 | 1.24 | 0.79 |
| Number of hired tasks | 1.00 | 11.00 | 5.69 | 3.51 | |
| On-farm work time (h/d) | 1.00 | 3.00 | 1.70 | 0.60 | |
| Number of secondary crops | 1.00 | 3.00 | 1.99 | 0.70 | |
| Type 3 | Number of input types applied | 0.00 | 3.00 | 1.16 | 0.88 |
| Number of hired tasks | 1.00 | 11.00 | 5.00 | 3.09 | |
| On-farm work time (h/d) | 1.00 | 3.00 | 1.74 | 0.53 | |
| Number of secondary crops | 1.00 | 4.00 | 2.06 | 0.73 | |
| Type 4 | Number of input types applied | 0.00 | 2.00 | 1.02 | 0.68 |
| Number of hired tasks | 1.00 | 11.00 | 7.54 | 3.09 | |
| On-farm work time (h/d) | 1.00 | 3.00 | 1.67 | 0.63 | |
| Number of secondary crops | 0.00 | 4.00 | 2.03 | 0.92 | |
Table S5
Descriptive statistics for economic performance."
| Typology WARD variable | Minimum | Maximum | Mean | Standard deviation | |
|---|---|---|---|---|---|
| Type 1 | Cocoa yield during the main harvest season (kg) | 140 | 12,000 | 1944 | 2201 |
| Cocoa yield during the minor harvest season (kg) | 0 | 9000 | 686 | 1041 | |
| Cocoa productivity (kg/hm2) | 100 | 2750 | 581 | 444 | |
| Total expenditure on cocoa farm (USD/a) | 15 | 11,467 | 808 | 1593 | |
| Cocoa gross margin (USD/a) | 0 | 18,801 | 3004 | 3393 | |
| Total income from cash crops (USD/a) | 0 | 13,753 | 918 | 2406 | |
| Total income from staple food crops (USD/a) | 0 | 5055 | 478 | 831 | |
| Total income from horticulture crops (USD/a) | 0 | 7245 | 203 | 807 | |
| Total income from fruit trees (USD/a) | 0 | 320 | 28 | 59 | |
| Total income from livestock (USD/a) | 0 | 12,680 | 567 | 1612 | |
| Total income from diversification (USD/a) | 0 | 18,552 | 2196 | 3615 | |
| Total on-farm income (USD/a) | 255 | 26,396 | 5204 | 5235 | |
| Living income gap (USD/a) | -20,350 | 5789 | 840 | 5235 | |
| Type 2 | Cocoa yield during the main harvest season (kg) | 70 | 7000 | 1512 | 1383 |
| Cocoa yield during the minor harvest season (kg) | 0 | 2100 | 427 | 441 | |
| Cocoa productivity (kg/hm2) | 85 | 1625 | 478 | 390 | |
| Total expenditure on cocoa farm (USD/a) | 32 | 10,910 | 659 | 1380 | |
| Cocoa gross margin (USD/a) | 0 | 9941 | 2113 | 2432 | |
| Total income from cash crops (USD/a) | 0 | 13,143 | 833 | 1974 | |
| Total income from staple food crops (USD/a) | 0 | 2017 | 209 | 393 | |
| Total income from horticulture crops (USD/a) | 0 | 7582 | 154 | 872 | |
| Total income from fruit trees (USD/a) | 0 | 320 | 23 | 56 | |
| Total income from livestock (USD/a) | 0 | 4212 | 386 | 908 | |
| Total income from diversification (USD/a) | 0 | 13,143 | 1622 | 2647 | |
| Total on-farm income (USD/a) | 1095 | 17,906 | 3976 | 3782 | |
| Living income gap (USD/a) | -11,860 | 7140 | 2068 | 3782 | |
| Type 3 | Cocoa yield during the main harvest season (kg) | 300 | 6000 | 1510 | 1105 |
| Cocoa yield during the minor harvest season (kg) | 40 | 2500 | 499 | 464 | |
| Cocoa productivity (kg/hm2) | 140 | 1600 | 607 | 344 | |
| Total expenditure on cocoa farm (USD/a) | 3 | 3800 | 581 | 819 | |
| Cocoa gross margin (USD/a) | 343 | 9785 | 2393 | 1856 | |
| Total income from cash crops (USD/a) | 0 | 2022 | 143 | 394 | |
| Total income from staple food crops (USD/a) | 0 | 1676 | 238 | 356 | |
| Total income from horticulture crops (USD/a) | 0 | 876 | 75 | 152 | |
| Total income from fruit trees (USD/a) | 0 | 337 | 23 | 59 | |
| Total income from livestock (USD/a) | 0 | 3989 | 251 | 743 | |
| Total income from diversification (USD/a) | 0 | 4825 | 730 | 1101 | |
| Total on-farm income (USD/a) | 4474 | 11,655 | 3187 | 2373 | |
| Living income gap (USD/a) | -5609 | 5610 | 2857 | 2373 | |
| Type 4 | Cocoa yield during the main harvest season (kg) | 0 | 3500 | 924 | 884 |
| Cocoa yield during the minor harvest season (kg) | 0 | 2000 | 356 | 413 | |
| Cocoa productivity (kg/hm2) | 70 | 1015 | 426 | 273 | |
| Total expenditure on cocoa farm (USD/a) | 4 | 1530 | 469 | 380 | |
| Cocoa gross margin (USD/a) | -122 | 7583 | 1420 | 1685 | |
| Total income from cash crops (USD/a) | 0 | 185 | 8 | 32 | |
| Total income from staple food crops (USD/a) | 0 | 1685 | 204 | 336 | |
| Total income from horticulture crops (USD/a) | 0 | 1482 | 90 | 255 | |
| Total income from fruit trees (USD/a) | 0 | 67 | 4 | 12 | |
| Total income from livestock (USD/a) | 0 | 2199 | 110 | 357 | |
| Total income from diversification (USD/a) | 0 | 3194 | 416 | 670 | |
| Total on-farm income (USD/a) | 56 | 8727 | 1898 | 1913 | |
| Living income gap (USD/a) | -2681 | 5990 | 4147 | 1900 | |
| [1] | Abdulai I., Jassogne L., Graefe S., et al., 2018. Characterization of cocoa production, income diversification and shade tree management along a climate gradient in Ghana. PLoS One. 13(4), e0195777, doi: 10.1371/journal.pone.0195777. |
| [2] | Alvarez S., Paas W., Descheemaeker K., et al., 2014. Typology Construction, A Way of Dealin with Farm Diversity: General Guidelines for Humidtropics. Wageningen: Wageningen University. |
| [3] | Alvarez S., Timler C.J., Michalscheck M., et al., 2018. Capturing farm diversity with hypothesis-based typologies: An innovative methodological framework for farming system typology development. PLoS One. 13(5), e0194757, doi: 10.1371/journal.pone.0194757. |
| [4] |
Andersen E., Elbersen B., Godeschalk F., et al., 2007. Farm management indicators and farm typologies as a basis for assessments in a changing policy environment. J. Environ. Manage. 82(3), 353-362.
pmid: 17126987 |
| [5] | Asumang-Yeboah D., Ameyaw J.A.S., Acheampong E., et al., 2025. Access or exclusion to land: An overview of evolving trends in cocoa landscapes in Ghana. World Dev. Perspect. 37, 100651, doi: 10.1016/j.wdp.2024.100651. |
| [6] | Bah A., Laven A., 2019. Closing the income gap of cocoa households in Côte d’Ivoire - taking a gender-sensitive household approach. [2024-07-25]. https://www.kakaoforum.de/fileadmin/Redaktion/Studien/2019_KIT_Closing_the_income_gap_of_cocoa_households_in_Cote_d_Ivoire_-_taking_a_gender-sensitive_household_approac.pdf. |
| [7] | Bahrun A., Fahimuddin M.Y., Rakian T.C., et al., 2018. Cocoa pod husk biochar reduce watering frequency and increase cocoa seedlings growth. International Journal of Environment, Agriculture and Biotechnology. 3(5), 1635-1639. |
| [8] | Bartkowski B., Schüßler C., Müller B., 2022. Typologies of European farmers: approaches, methods and research gaps. Reg. Envir. Chang. 22(2), 43, doi: 10.1007/s10113-022-01899-y. |
| [9] | Bisseleua D.H.D., Idrissou L., Ogunniyi A., et al., 2018. Diversification and livelihood strategies in the cocoa belt of West Africa: The need for fundamental change. World Dev. Perspect. 10-12, 73-79. |
| [10] | Busquet M., Bosma N., Hummels H., 2021. A multidimensional perspective on child labor in the value chain: The case of the cocoa value chain in West Africa. World Dev. 146, 105601, doi: 10.1016/j.worlddev.2021.105601. |
| [11] | Bymolt R., Laven A., Tyszler M., 2018. Demystifying the cocoa sector in Ghana and Côte d’Ivoire. In: KIT Royal Tropical Institute. Amsterdam, Nerherlands. |
| [12] | Carr E.R., 2008. Men’s crops and women’s crops: The importance of gender to the understanding of agricultural and development outcomes in Ghana’s central region. World Dev. 36(5), 900-915. |
| [13] | Danso-Abbeam G., Baiyegunhi L.J.S., Ojo T.O., 2020. Gender differentials in technical efficiency of Ghanaian cocoa farms. Heliyon. 6(5), e04012, doi: 10.1016/j.heliyon.2020.e04012. |
| [14] | Dixon J., Gulliver A., Gibbon D., et al., 2001. Farming Systems and Poverty: Improving Farmers’ Livelihoods in a Changing World. Rome and Washington: FAO and World Bank. |
| [15] | Djokoto J.G., Afari-Sefa V., Addo-Quaye A., 2017. Vegetable diversification in cocoa-based farming systems Ghana. Agric. Food Secur. 6(1), 6, doi: 10.1186/s40066-016-0082-4. |
| [16] | Duguma B., Gockowski J., Bakala J., 2001. Smallholder Cacao (Theobroma cacao Linn.) cultivation in agroforestry systems of West and Central Africa: challenges and opportunities. Agrofor. Syst. 51(3), 177-188. |
| [17] | Ferry Y., Herman M., Tarigan E.B., et al., 2022. Improvements of soil quality and cocoa productivity with agricultural waste biochar. IOP Conference Series: Earth and Environmental Science. 974(1), 12045, doi: 10.1088/1755-1315/974/1/012045. |
| [18] | Fontaine A., Hütz-Adams F., 2022. Cocoa Barometer. [2024-07-05]. https://voicenetwork.cc/cocoa-barometer/. |
| [19] | Fountain A.C., 2023. Good Purchasing Practices in Cocoa, a Barometer Consultation Paper. [2024-07-05]. https://voicenetwork.cc/resources/?_categorie_resources=sustainability-research-database. |
| [20] |
Friedman R., Hirons M.A., Boyd E., 2019. Vulnerability of Ghanaian women cocoa farmers to climate change: a typology. Clim. Dev. 11(5), 446-458.
doi: 10.1080/17565529.2018.1442806 |
| [21] | GEFAK(Gesellschaft Für Angewandte Kommunalforschung) , 2015. Study on the state of farmer cooperatives in the cocoa sector of Côte d’Ivoire. [2024-07-25]. https://www.readkong.com/page/study-on-the-state-of-farmer-cooperatives-in-the-cocoa-7563626. |
| [22] | Huber R., Bartkowski B., Brown C., et al., 2024. Farm typologies for understanding farm systems and improving agricultural policy. Agric. Syst. 213, 103800, doi: 10.1016/j.agsy.2023.103800. |
| [23] | Ingram V., Van Rijn F., Waarts Y., et al., 2018. The impacts of cocoa sustainability initiatives in West Africa. Sustainability. 10(11), 4249, doi: 10.3390/su10114249. |
| [24] | International Cocoa Organization, 2023. November 2023 Quarterly Bulletin of Cocoa Statistics. [2024-06-30]. https://www.icco.org/november-2023-quarterly-bulletin-of-cocoa-statistics/. |
| [25] | Kasim N., Mustari K., Iswari I., et al., 2021. Effect of the application of chicken manure compost tea on the growth of certified cocoa (Theobroma cacao L.) seedlings. IOP Conference Series: Earth and Environmental Science. 807(4), 42050, doi: 10.1088/1755-1315/807/4/042050. |
| [26] | Knudsen M.H., Agergaard J., 2015. Ghana’s cocoa frontier in transition: the role of migration and livelihood diversification. Geogr. Ann. Ser. B-Human Geogr. 97(4), 325-342. |
| [27] | Koné M., 2011. Teaching Guide to Understand, Ask the Right Questions, and Take Action on Land Issues in West Africa. [2024-06-30]. http://www.socioeco.org/bdf_fiche-document-510_fr.html (in French). |
| [28] | Kruskal W.H., Wallis W.A., 1952. Use of ranks in one-criterion variance analysis. J. Am. Stat. Assoc. 47(260), 583-621. |
| [29] | Kuhn M., Tennhardt L., Lazzarini G.A., 2023. Gender inequality in the cocoa supply chain: Evidence from smallholder production in Ecuador and Uganda. World Development Sustainability. 2, 100034, doi: 10.1016/j.wds.2022.100034. |
| [30] | LeBaron G., Gore E., 2020. Gender and forced labour: Understanding the links in global cocoa supply chains. The Journal of Development Studies. 56(6), 1095-1117. |
| [31] | Löhr K., Aruqaj B., Baumert D., et al., 2021. Social cohesion as the missing link between natural resource management and peacebuilding: Lessons from cocoa production in Côte d’Ivoire and Colombia. Sustainability. 13(23), 13002, doi: 10.3390/su132313002. |
| [32] | Merem E.C., Twumasi Y.A., Wesley J., et al., 2020. Exploring cocoa farm land use in the West African region. International Journal of Agriculture and Forestry. 10(1), 19-39. |
| [33] | Molenaar J.W., Hütz-Adams F., Kessler J.J., et al., 2022. Price in Global Commodity Value Chains: Key to Achieving LI and Living Wage. [2024-07-10]. https://www.suedwind-institut.de/fileadmin/Suedwind/Publikationen/2023/2023_06_Price_in_Global_Commodity_Value_Chains_Key_to_Achieving_Living_Income_and_Living_Wage.pdf. |
| [34] | Najafabadi H.A., Ozalp N., Davis R.A., 2021. Biochar from cocoa shell pyrolysis: Potential sorbent for CO2 capture. Journal of Energy Resources Technology. 143(2), 022302, doi: 10.1115/1.4047765. |
| [35] | Njuki J., Eissler S., Malapit H., et al., 2022. A review of evidence on gender equality, women’s empowerment, and food systems. Global Food Security. 33, 100622, doi: 10.1016/j.gfs.2022.100622. |
| [36] | Ollendorf F., Coral C., Adou Y., et al., 2023. Different households-different challenges? Understanding the impacts of cocoa producers’ household characteristics on needs and ability to apply sustainable production techniques. In: International Symposium on Cocoa Research-ISCR 2022. Montpellier: International Symposium on Cocoa Research. |
| [37] | Ollendorf F., 2024. The Transformative Potential of Corporate Social Responsibility in the Global Cocoa-Chocolate Chain: Insights from Sustainability Certification in Ghana. Wiesbaden: Springer. |
| [38] | Osorio M., Gallina A., Jaskiewicz K., et al., 2019. Changing the terms of Women’s Engagement in Cocoa and Coffee Supply Chains. Rome and Amsterdam: FAO and KIT Royal Tropical Institute. |
| [39] | Pierotti R.S., Friedson-Ridenour S., Olayiwola O., 2022. Women farm what they can manage: How time constraints affect the quantity and quality of labor for married women’s agricultural production in southwestern Nigeria. World Dev. 152, 105800, doi: 10.1016/j.worlddev.2021.105800. |
| [40] | ProForest, 2022. EU Regulation on Deforestation-Free Products: Operational Guidance for Cocoa Producers and Importers. [2024-07-22]. https://www.proforest.net/resources/publications/deforestation-due-diligence-reference-document-for-cocoa-producers-and-importers/. |
| [41] | Ruf F., Galo Kla A.G., Dja K., et al., 2015. Chicken Manure in the Cocoa Plantations of Côte d’Ivoire. An Agro-ecological and Social Revolution. [2024-07-22]. https://www.inter-reseaux.org/wp-content/uploads/ruf_chicken_manure_in_the_cocoa_plantations_of_cote_d_ivoire.pdf/. |
| [42] | Ruf F., Schroth G., 2015. Economics and Ecology of Diversification. Netherlands: Springer. |
| [43] | Ruf F., 2022. Covid-19, living income differential and decline in cocoa producers’ incomes in Côte d’Ivoire. Cah. Agric. 31, 25, doi: 10.1051/cagri/2022022(in French). |
| [44] | Sennuga S.O., Isola E.O., Dahunsi O.M., et al., 2024. Assessing the socio-economic implication of fragmented land holdings on smallholder farming communities in Ile-Oluji/Okeigbo local government area, Ondo State, Nigeria. Nigeria Journal of Development and Society, Faculty of Social Science. 6(1), 50-67. |
| [45] |
Shukla R., Agarwal A., Gornott C., et al., 2019. Farmer typology to understand differentiated climate change adaptation in Himalaya. Sci Rep. 9(1), 20375, doi: 10.1038/s41598-019-56931-9.
pmid: 31889158 |
| [46] | Tham-Agyekum E.K., Boansi D., Wongnaa C.A., et al., 2023. A gender differential analysis of determinants of pesticide application in cocoa system farming of Ghana. Cogent Soc. Sci. 9(2), 2256512, doi: 10.1080/23311886.2023.2256512. |
| [47] | The Living Income Community of Practice, 2024. The Concept. [2024-07-05]. https://www.living-income.com/. |
| [48] | Tittonell P., Muriuki A., Shepherd K.D., et al., 2010. The diversity of rural livelihoods and their influence on soil fertility in agricultural systems of East Africa - A typology of smallholder farms. Agric. Syst. 103(2), 83-97. |
| [49] | Tyszler M., Laven A., Bymolt R., 2019. Analysis of the income gap of cocoa producing households in Côte d’Ivoire. In: KIT Royal Tropical Institute. Amsterdam, Nerherlands. |
| [50] | van de Ven, G.W.J., Marinus W., et al., 2021. Living income benchmarking of rural households in low-income countries. Food Secur. 13(3), 729-749. |
| [51] | van Vliet J.A., Slingerland M.A., Waarts Y.R., et al., 2021. A living income for cocoa producers in Côte d’Ivoire and Ghana? Front. Sustain. Food Syst. 5, 732831, doi: 10.3389/fsufs.2021.732831. |
| [52] | Voora V., Bermúdez S., Larrea C., 2019. Global Market Report:Cocoa. Winnipeg: International Institute for Sustainable Development. |
| [53] | Waarts Y., Janssen V., Koster T., et al., 2024. Unlocking Targeted Approaches to Improve Household Resilience of Cocoa Farmers. The Hague: Wageningen Economic Research. |
| [54] | Waarts Y.R., Janssen V., Aryeetey R., et al., 2021. Multiple pathways towards achieving a living income for different types of smallholder tree-crop commodity farmers. Food Secur. 13(6), 1467-1496. |
| No related articles found! |
| Viewed | ||||||
|
Full text |
|
|||||
|
Abstract |
|
|||||
 REGSUS Wechat
 新公网安备 65010402001202号