Regional Sustainability ›› 2025, Vol. 6 ›› Issue (4): 100244.doi: 10.1016/j.regsus.2025.100244cstr: 32279.14.REGSUS.2025024
• Full Length Article • Previous Articles Next Articles
MA Shenglia,b, XU Mingxiangc,*( )
)
Received:2024-10-09
Accepted:2025-08-18
Published:2025-08-30
Online:2025-09-15
Contact:
XU Mingxiang
E-mail:xumx@nwsuaf.edu.cn
MA Shengli, XU Mingxiang. Adaptive conservation of natural resources determines the sustainable livelihood strategies of farmers in the semi-arid Loess Plateau region of China[J]. Regional Sustainability, 2025, 6(4): 100244.
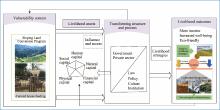
Fig. 1.
Household livelihood adaptation mechanism framework."
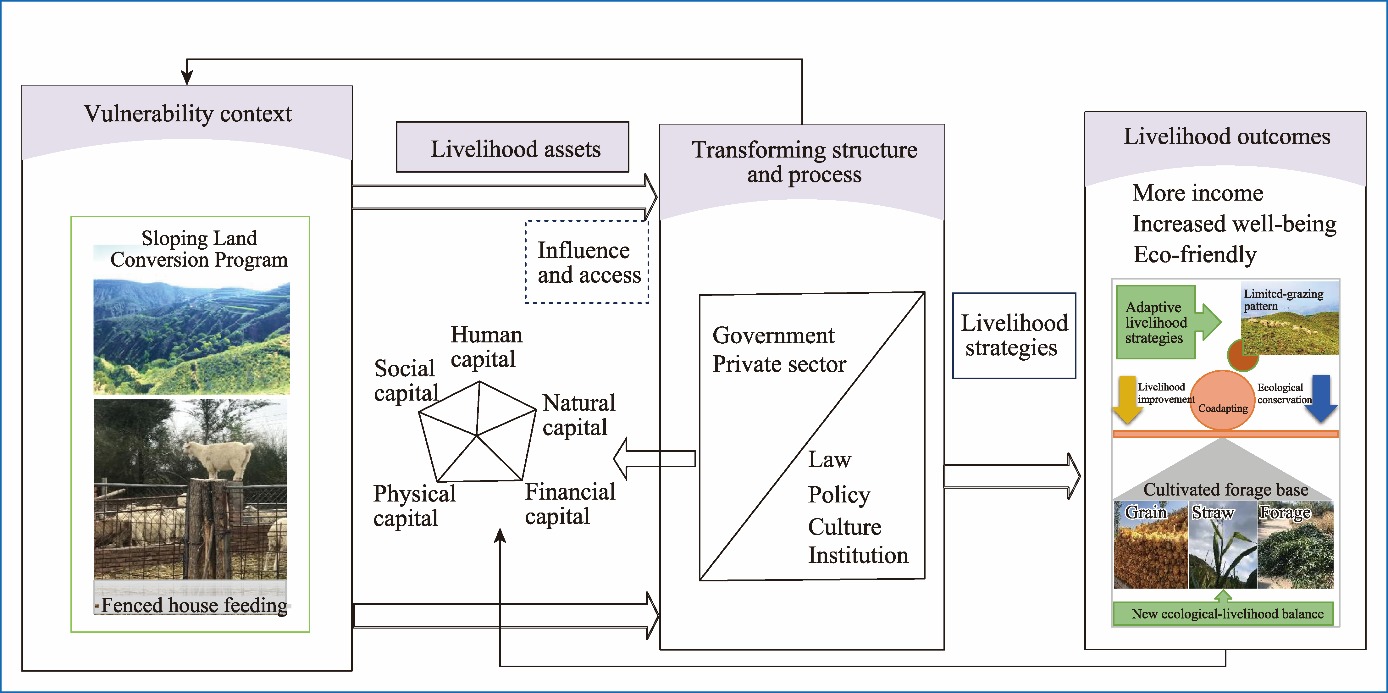
Table 1
Measurement indicators and assignment of livelihood capital."
| Type | Explanatory variable | Unit | Implication of variables |
|---|---|---|---|
| Natural capital (N) | Farmland owned per household (N1) | hm2 | This variable is used to measure the area of farmland that households are currently cultivating, after deducting land converted under the Grain-for-Green Program and land that has been abandoned. |
| Grassland area per household (N2) | hm2 | This variable measures the area of sloping cropland that the household has converted to forest or grassland through the Sloping Land Conversion Program. | |
| Human capital (H) | Household size (H1) | - | This variable represents household size using categorical values: 0.25 for households with two or fewer members, 0.50 for those with three to five members, 0.75 for those with six to eight members, and 1.00 for those with nine or more members. |
| Household labor capacity (H2) | - | This variable quantifies the household’s total labor capacity by summing labor scores assigned to each member: 0.00 for non-labor individuals (children too young to work, elderly too old to work, and those unable to work due to illness); 0.50 for half-labor individuals (children or elderly capable of simple household tasks or light farm work); and 1.00 for full-labor individuals (healthy adults able to perform normal farm work). | |
| Education level (H3) | - | This variable measures household educational attainment by calculating the mean score of all members, assigned as follows: 0.00 for illiterate or preschool, 0.25 for primary school, 0.50 for junior high school, 0.75 for senior high school, and 1.00 for college or university. | |
| Physical capital (P) | Production and living assets (P1) | % | This variable measures the proportion of fixed-asset categories (both productive and domestic) owned by the household. |
| Housing quality (P2) | - | This variable measures housing quality using a score derived from total floor area and material coefficients: 1.00 for concrete or multi-story structure, 0.75 for masonry, 0.50 for timber, and 0.25 for Mongolian yurts. | |
| Number of livestock (P3) | The main livestock species include hog, cattle, horse, and sheep. We adopted the following conversion coefficient: 1 horse=1.0, 1 cattle=0.8, 1 hog=0.3, and 1 sheep=0.3. The values of all livestock are then summed up. | ||
| Financial capital (F) | Annual income per capita (F1) | RMB | This variable is used to assess the household’s annual income per capita derived primarily from agricultural, secondary, and tertiary sector activities. |
| Access to bank loan or usury (F2) | - | This variable is used to assess whether farmers are able to borrow money from banks. If they are able to borrow, they are assigned a value of 1; if they are unable to borrow, they are assigned a value of 0. | |
| Social capital (S) | Social relationships (S1) | - | This variable is used to assess the number of relatives serving as township or village officials or other government employees, coded as follows: 1.00 for households with four or more such relatives, 0.75 for three, 0.50 for two, 0.25 for one, and 0.00 for none. |
| Social spending (S2) | RMB | This variable is used to assess the household’s social expenditures, i.e., spending primarily directed at important social events. | |
| Geographical advantage | Distance | km | This variable measures the distance from the household to the nearest town. |
| Stocking rate | Stocking rate | sheep/hm2 | Stocking rate is calculated as the number of livestock divided by the cropland area. |
| Forage supply | Grassland forage-supply ratio | % | This variable measures grassland forage supply. Specifically, the forage-supply ratio is calculated as the shortfall between total annual fodder demand and the combined quantity of cultivated and commercial fodder, expressed as a proportion of total annual demand. |
Table 2
Socioeconomic characteristics of the surveyed households."
| Demographic information | Ansai District | Guyuan City | Shenmu City | Wuqi County | Mean | |
|---|---|---|---|---|---|---|
| Gender (%) | Male | 84.15 | 99.12 | 92.50 | 100.00 | 93.69 |
| Female | 15.85 | 0.88 | 7.50 | 0.00 | 6.31 | |
| Education level (%) | Illiteracy | 20.73 | 45.13 | 12.50 | 16.67 | 26.81 |
| Primary school | 64.63 | 23.89 | 66.25 | 66.67 | 50.79 | |
| Junior middle school | 9.76 | 25.66 | 17.50 | 11.90 | 17.67 | |
| Senior middle school | 3.66 | 2.66 | 3.75 | 4.76 | 4.73 | |
| University or college | 1.22 | 2.65 | 0.00 | 0.00 | 0.00 | |
| Age (years) | 59 | 50 | 63 | 60 | 58 | |
| Family size (persons) | 2.90 | 5.15 | 2.44 | 4.38 | 3.72 | |
| Farmland owned per household (hm2) | 1.12 | 2.26 | 1.48 | 1.07 | 1.48 | |
| Annual household income (RMB) | 67,240.30 | 89,682.48 | 87,073.88 | 89,498.81 | 83,373.87 | |
| Annual household cost (RMB) | 28,229.93 | 43,358.65 | 28,984.44 | 37,115.26 | 34,422.07 | |
| Number of goats | 48.51 | 44.67 | 60.54 | 21.07 | 43.00 | |
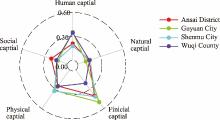
Fig. 2.
Livelihood capital in Ansai District, Guyuan City, Shenmu City, and Wuqi County."
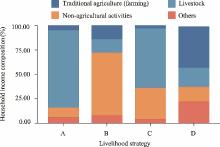
Fig. 3.
Income composition of households adopting different livelihood strategies. A, agro-pastoral livelihood strategy; B, non-agricultural livelihood strategy; C, agro-industrial livelihood strategy; D, agro-dependent livelihood strategy."
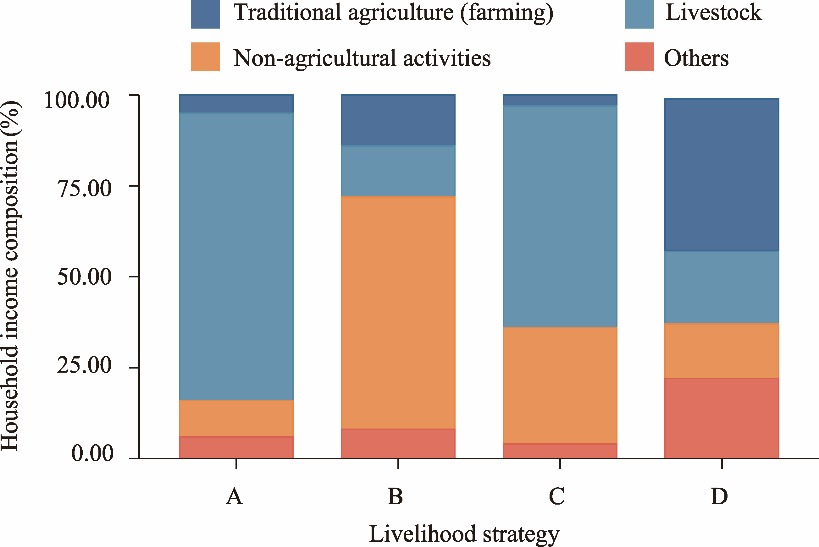
Table 3
Percentage of current livelihood strategies used by households in the study area."
| Region | Percentage of livelihood strategy (%) | |||
|---|---|---|---|---|
| Agro-pastoral livelihood strategy | Non-agricultural livelihood strategy | Agro-industrial livelihood strategy | Agro-dependent livelihood strategy | |
| Ansai District | 47.56 | 13.41 | 28.05 | 10.98 |
| Guyuan City | 46.90 | 7.08 | 36.28 | 9.73 |
| Shenmu City | 61.25 | 7.50 | 16.25 | 15.00 |
| Wuqi County | 11.90 | 57.14 | 21.43 | 9.52 |
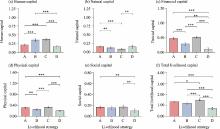
Fig. 4.
Livelihood capital of households adopting different livelihood strategies. (a), human capital; (b), natural capital; (c), financial capital; (d), physical capital; (e), social capital; (f), total livelihood capital. The error bars represent standard deviation of livelihood capital. ***, **, and * represent significant levels at P<0.001, P<0.010, and P<0.050, respectively."
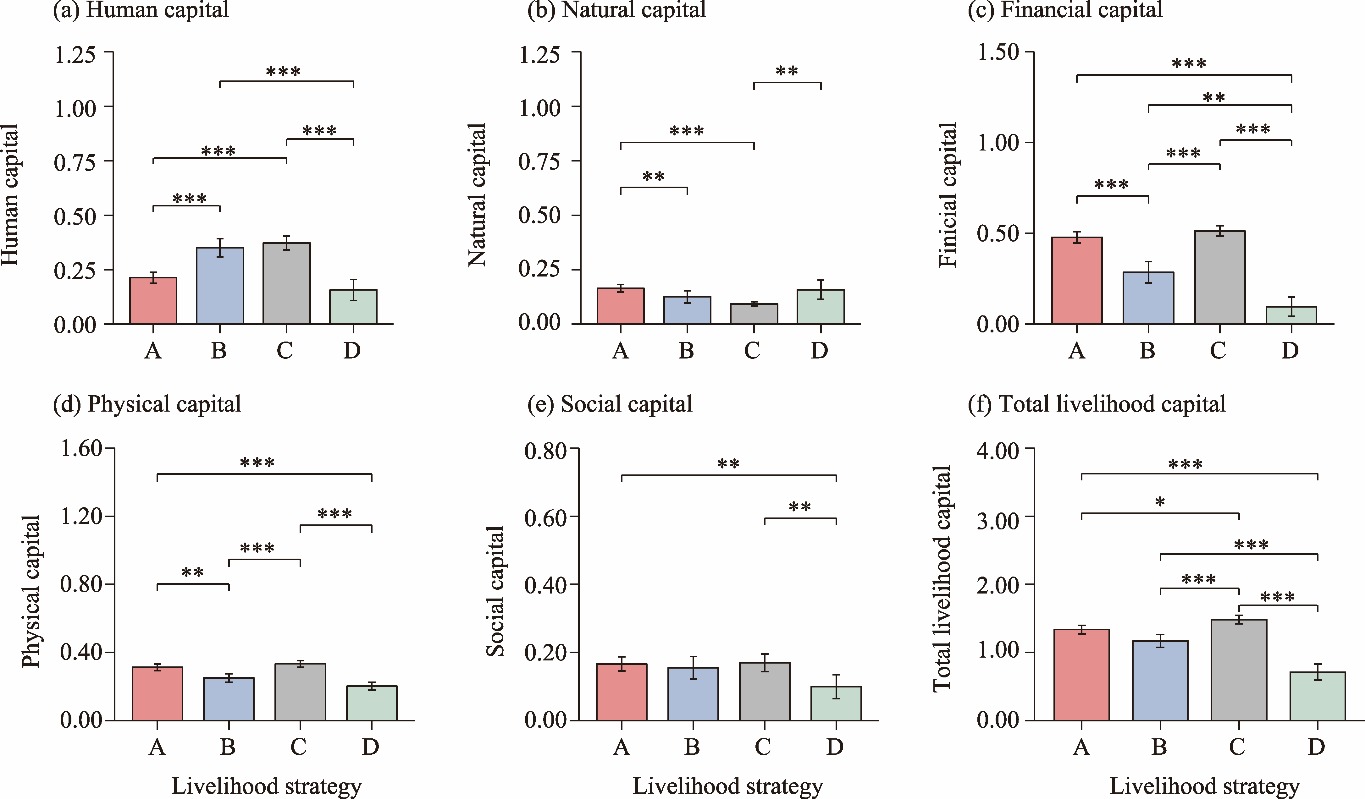
Table 4
Multivariate logistic model estimation results for factors influencing livelihood strategies (relative to agro-pastoral livelihood strategy)."
| Explanatory variable | Non-agricultural livelihood strategy | Agro-industrial livelihood strategy | Agro-dependent livelihood strategy | |||
|---|---|---|---|---|---|---|
| Regression coefficient | Odds ratio | Regression coefficient | Odds ratio | Regression coefficient | Odds ratio | |
| N1 | -0.34 | 0.72 | -2.81** | 0.06 | -1.03 | 0.36 |
| N2 | 0.90 | 1.09 | -0.59 | 0.55 | 0.94 | 2.56 |
| H1 | 0.27 | 1.31 | -1.10 | 0.33 | -1.18 | 0.31 |
| H2 | 1.17*** | 3.21 | 1.05*** | 2.85 | -0.91 | 0.40 |
| H3 | 0.89 | 2.44 | 0.45 | 1.57 | -0.33 | 0.72 |
| P1 | 6.00* | 402.39 | 2.71 | 15.05 | 7.32 | 1503.00 |
| P2 | 0.01 | 1.01 | 0.01 | 1.01 | -0.01 | 0.99 |
| P3 | -0.44*** | 0.65 | -0.07* | 0.94 | 0.14 | 1.16 |
| F1 | 0.77* | 2.17 | 0.25* | 1.29 | -3.25*** | 0.04 |
| F2 | -0.86 | 0.42 | 0.17 | 1.18 | -3.24* | 0.04 |
| S1 | -2.17 | 0.11 | 0.52 | 1.69 | 3.21 | 24.76 |
| S2 | 0.01 | 1.01 | 0.02 | 1.02 | -0.08* | 0.93 |
| Distance | -0.03 | 0.98 | -0.00 | 1.00 | -0.02 | 0.98 |
| Stocking rate | 0.13 | 1.14 | -0.09 | 0.92 | 0.08 | 1.08 |
| Grassland forage-supply ratio | -2.11 | 0.12 | 1.09 | 2.98 | -17.55** | 0.00 |
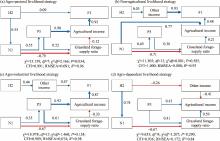
Fig. 5.
Effects of different livelihood capitals on total household income. Blue and red lines indicate significant positive and negative effects, respectively. The numbers adjacent to the arrows are the path coefficients, while the width of the arrows is proportional to the strength of the path coefficients. (a), agro-pastoral livelihood strategy; (b), non-agricultural livelihood strategy; (c), agro-industrial livelihood strategy; (d), agro-dependent livelihood strategy. N1, farmland owned per household; H2, household labor capacity; P3, number of livestock; F1, annual income per capita; χ2, chi-square statistic; df, degrees of freedom; CFI, comparative fit index; RMSEA, root mean square error of approximation."
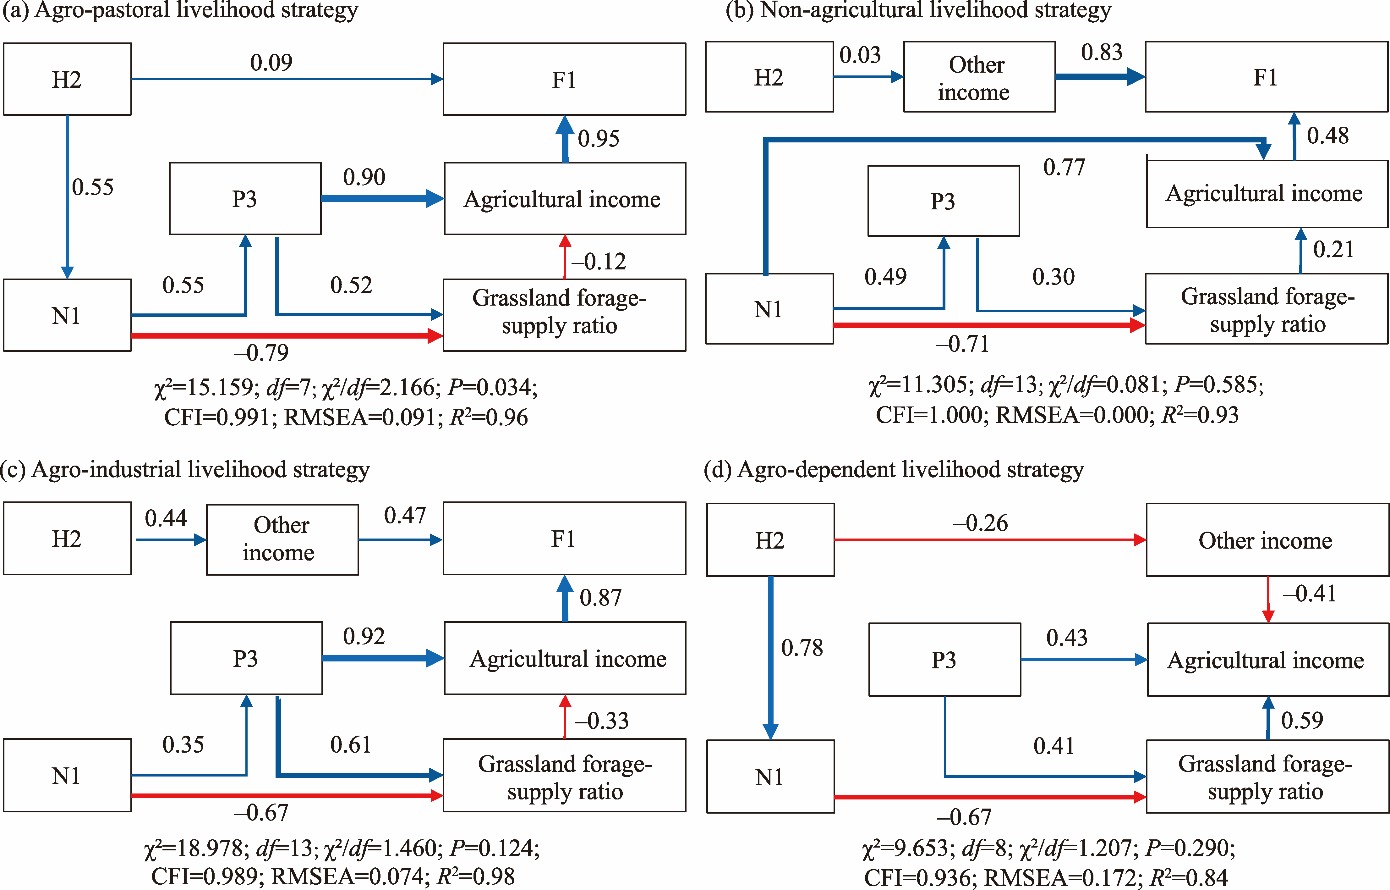
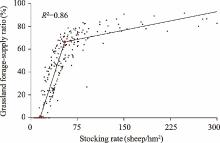
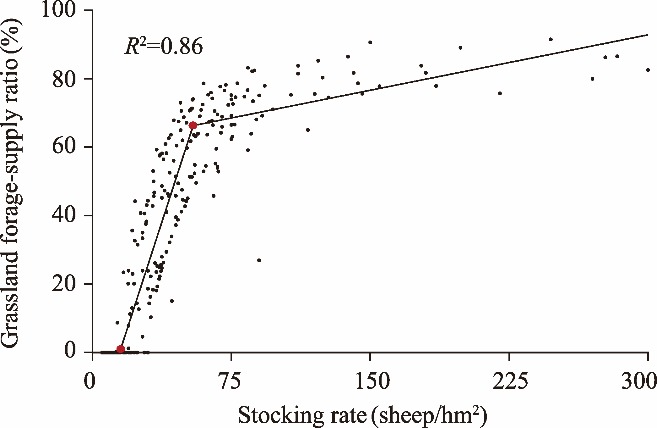
Fig. 6.
Relationship between the grassland forage-supply ratio and stocking rate. The red dot indicates the turning point and the black line is the fitting line from broken-line model."
| [1] | Abba A., Sankarannair S., Gautam R., et al., 2025. Integrating local knowledge and innovative approaches for sustainable water hyacinth management towards livelihoods enhancement in rural India. Sci Rep. 15(1), 26233, doi: 10.1038/s41598-025-10507-y. |
| [2] | Angeon V., Bates S., 2015. Reviewing composite vulnerability and resilience indexes: A sustainable approach and application. World Dev. 72, 140-162. |
| [3] | Berkes F., Folke C., 1998. Linking Social and Ecological Systems for Resilience and Sustainability. [2024-09-01]. https://dlc.dlib.indiana.edu/dlcrest/api/core/bitstreams/5b03adab-3174-4801-871b-0cd799e27392/content. |
| [4] |
Bhandari P.B., 2013. Rural livelihood change? Household capital, community resources and livelihood transition. J. Rural Stud. 32, 126-136.
pmid: 24043919 |
| [5] | Bisui S., Shit P.K., 2024. Assessing the role of forest resources in improving rural livelihoods in West Bengal of India. Reg. Sustain. 5(2), 100141, doi: 10.1016/j.regsus.2024.100141. |
| [6] | Bonye S.Z., Yiridomoh G.Y., Nsiah V., 2023. Our forest, our livelihood: Natural resources’ use controversies and community livelihood sustainability in the Mole National Park, Ghana. Land Use Pol. 127, 106589, doi: 10.1016/j.landusepol.2023.106589. |
| [7] | Chazdon R.L., Brancalion P.H.S., Lamb D., et al., 2016. A policy-driven knowledge agenda for global forest and landscape restoration. Conserv. Lett. 10(1), 125-132. |
| [8] | Chen L.D., Wei W., Fu B.J., et al., 2007. Soil and water conservation on the Loess Plateau in China: Review and perspective. Prog. Phys. Geogr. 31(4), 389-403. |
| [9] | Chen Y.P., Wang K.B., Lin Y.S., et al., 2015. Balancing green and grain trade. Nat. Geosci. 8(10), 739-741. |
| [10] | Cui H.P., Wang Y., Wang W.W., et al., 2025. Rural households’ livelihood transitions in China: processes, drivers and outcomes. China Agric. Econ. Rev. 17(1), 171-190. |
| [11] | DFID(Department for International Development) , 2000. Sustainable Livelihoods Guidance Sheets. [2024-08-25]. https://www.livelihoodscentre.org/-/sustainable-livelihoods-guidance-sheets. |
| [12] | Eshetu A.A., Yimer H., 2024. Determinants of smallholder farmers’ adaptation to the effects of climate extremes: evidence from Legambo district in northcentral Ethiopia. Environ. Dev. Sustain. 8, doi: 10.1007/s10668-024-05104-4. |
| [13] | Fang Y.P., 2013. The effects of natural capital protection on pastoralist’s livelihood and management implication in the source region of the Yellow River, China. J Mt. Sci. 10(5), 885-897. |
| [14] | Giefer M.M., An L., 2022. Divergent impacts of the grain to green program, landholdings, and demographic factors on livelihood diversification in rural China. World Dev. 156, 105917, doi: 10.1016/j.worlddev.2022.105917. |
| [15] | Hu F., Xu Z.Y., Chen Y.Y., 2011. Circular migration, or permanent stay? Evidence from China’s rural-urban migration. China Econ. Rev. 22(1), 64-74. |
| [16] | Huang X.J, Huang X., He Y.B., et al., 2017. Assessment of livelihood vulnerability of land-lost farmers in urban fringes: A case study of Xi’an, China. Habitat Int. 59, 1-9. |
| [17] | Jansen H.G.P., Pender J., Damon A., et al., 2006. Policies for sustainable development in the hillside areas of Honduras: a quantitative livelihoods approach. Agric. Econ. 34(2), 141-153. |
| [18] | Jones R.J., Sandland R.L., 1974. The relation between animal gain and stocking rate: Derivation of the relation from the results of grazing trials. J. Agric. Sci. 83(2), 335-342. |
| [19] | Lan X., Zhang Q., Xue H.L., et al., 2021. Linking sustainable livelihoods with sustainable grassland use and conservation: A case study from rural households in a semi-arid grassland area, China. Land Use Pol. 101, 105186, doi: 10.1016/j.landusepol.2020.105186. |
| [20] | Li B.B., Li P.P., Zhang W.T., et al., 2021. Deep soil moisture limits the sustainable vegetation restoration in arid and semi-arid Loess Plateau. Geoderma. 399, 115122, doi: 10.1016/j.geoderma.2021.115122. |
| [21] | Li J., Feldman M.W., Li S.Z., et al., 2011. Rural household income and inequality under the Sloping Land Conversion Program in western China. Proc. Natl. Acad. Sci. U. S. A. 108(19), 7721-7726. |
| [22] | Liang Y.C., Li S.Z., Feldman M.W., et al., 2012. Does household composition matter? The impact of the Grain for Green Program on rural livelihoods in China. Ecol. Econ. 75, 152-160. |
| [23] | Lin Y., Yao S.B., 2014. Impact of the sloping land conversion program on rural household income: An integrated estimation. Land Use Pol. 40, 56-63. |
| [24] | Liu J.G., Li S.X., Ouyang Z.Y., et al., 2008. Ecological and socioeconomic effects of China’s policies for ecosystem services. Proc. Natl. Acad. Sci. U. S. A. 105(28), 9477-9482. |
| [26] | Liu W., Li J., Ren L.J., et al., 2020. Exploring livelihood resilience and its impact on livelihood strategy in rural China. Soc. Indic. Res. 150, 977-998. |
| Liu Y.J., Zou X.T., Chen J., et al., 2022. Impacts of protected areas establishment on pastoralists’ livelihoods in the Three-River-Source Region on the Qinghai-Tibetan Plateau. Land Use Pol. 115, 106018, doi: 10.1016/j.landusepol.2022.106018. | |
| [27] | Liu Z., Lan J., 2015. The sloping land conversion program in China: Effect on the livelihood diversification of rural households. World Dev. 70, 147-161. |
| [28] | Liu Z.X., Liu L.M., 2016. Characteristics and driving factors of rural livelihood transition in the east coastal region of China: A case study of suburban Shanghai. J. Rural Stud. 43, 145-158. |
| [29] | Long H.L., Liu Y.S., Li X.B., et al., 2010. Building new countryside in China: A geographical perspective. Land Use Pol. 27(2), 457-470. |
| [30] | Long H.L., 2014. Land consolidation: An indispensable way of spatial restructuring in rural China. J. Geogr. Sci. 24(2), 211-225. |
| [31] | Lu G., Yin R.S., 2020. Evaluating the evaluated socioeconomic impacts of China’s sloping land conversion program. Ecol. Econ. 177, 106785, doi: 10.1016/j.ecolecon.2020.106785. |
| [32] |
Ma X.X., Zhao Y.G., Yang K., et al., 2023. Long-term light grazing does not change soil organic carbon stability and stock in biocrust layer in the hilly regions of drylands. J. Arid Land. 15(8), 940-959.
doi: 10.1007/s40333-023-0064-x |
| [33] | Mullan K., Grosjean P., Kontoleon A., 2011. Land tenure arrangements and rural-urban migration in China. World Dev. 39(1), 123-133. |
| [34] | Nielsen Ø.J., Rayamajhi S., Uberhuaga P., et al., 2013. Quantifying rural livelihood strategies in developing countries using an activity choice approach. Agric. Econ. 44(1), 57-71. |
| [35] | Núñez A.P.B., Gutiérrez-Montes I., Hernández-Núñez H.E., 2023. Diverse farmer livelihoods increase resilience to climate variability in southern Colombia. Land Use Pol. 131, 106731, doi: 10.1016/j.landusepol.2023.106731. |
| [36] | Olana-Jawo T., Teutscherová N., Negash M., et al., 2023. Smallholder coffee-based farmers’ perception and their adaptation strategies of climate change and variability in South-Eastern Ethiopia. Int. J. Sustain. Dev. World Ecol. 30(5), 533-547. |
| [37] | Paul S., Das T.K., Pharung R., et al., 2020. Development of an indicator based composite measure to assess livelihood sustainability of shifting cultivation dependent ethnic minorities in the disadvantageous Northeastern region of India. Ecol. Indic. 110, 105934, doi: 10.1016/j.ecolind.2019.105934. |
| [38] | Qiu H.G., Su L.F., Feng X.L, et al., 2020. Role of monitoring in environmental regulation: An empirical analysis of grazing restrictions in pastoral China. Environ. Sci. Policy. 114, 295-304. |
| [39] |
Reynolds J.F., Smith D.M.S., Lambin E.F., et al., 2007. Global desertification: Building a science for dryland development. Science. 316(5826), 847-851.
doi: 10.1126/science.1131634 pmid: 17495163 |
| [40] |
Rjili H., Jaouad M., Selmi C., 2023. Supplemental feeding on rangelands: New dynamics of the livestock in the El Ouara rangelands in southern Tunisia. Reg. Sustain. 4(4), 359-368.
doi: 10.1016/j.regsus.2023.10.001 |
| [41] | Salafsky N., Wollenberg E., 2000. Linking livelihoods and conservation: A conceptual framework and scale for assessing the integration of human needs and biodiversity. World Dev. 28(8), 1421-1438. |
| [42] | Soltani A., Angelsen A., Eid T., et al., 2012. Poverty, sustainability, and household livelihood strategies in Zagros, Iran. Ecol. Econ. 79, 60-70. |
| [43] | Su F., Fan B.J., Song N.N., et al., 2024. Quantifying farmers’ livelihood efficiency, regional indicators and its influencing factors: Implementing an improved sustainable livelihood framework. Land Degrad. Dev. 36(2), 490-506. |
| [44] |
Sun H., Zhao Y.G., Gao L.Q., et al., 2024. Reasonable grazing may balance the conflict between grassland utilization and soil conservation in the semi-arid hilly areas, China. J. Arid Land. 16(8), 1130-1146.
doi: 10.1007/s40333-024-0025-z |
| [45] | Tian Q., Guo L.Y., Zheng L., 2016. Urbanization and rural livelihoods: A case study from Jiangxi Province, China. J. Rural Stud. 47, 577-587. |
| [46] | Tuo D.F., Gao G.Y., Chang R.Y., et al., 2018. Effects of revegetation and precipitation gradient on soil carbon and nitrogen variations in deep profiles on the Loess Plateau of China. Sci. Total Environ. 626, 399-411. |
| [47] | Wang W.X., Lan Y.Q., Wang X., 2021. Impact of livelihood capital endowment on poverty alleviation of households under rural land consolidation. Land Use Pol. 109, 105608, doi: 10.1016/j.landusepol.2021.105608. |
| [48] | Wen X., Zhen L., 2020. Soil erosion control practices in the Chinese Loess Plateau: A systematic review. Environ. Dev. 34, 100493, doi: 10.1016/j.envdev.2019.100493. |
| [49] | Widiono S., Wahyuni E.S., Kolopaking L.M, et al., 2024. Livelihood vulnerability of indigenous people to climate change around the Kerinci Seblat National Park in Bengkulu, Indonesia. Reg. Sustain. 5(4), 100181, doi: 10.1016/j.regsus.2024.100181. |
| [50] | Worku A., Pretzsch J., Kassa H., et al., 2014. The significance of dry forest income for livelihood resilience: The case of the pastoralists and agro-pastoralists in the drylands of southeastern Ethiopia. Forest Policy Econ. 41, 51-59. |
| [51] | Wu Z.L., Li B., Hou Y., 2017. Adaptive choice of livelihood patterns in rural households in a farm-pastoral zone: A case study in Jungar, Inner Mongolia. Land Use Pol. 62, 361-375. |
| [52] |
Yan J.Z., Wu Y.Y., Zhang Y.L., et al., 2010. Livelihood diversification of farmers and nomads of eastern transect in Tibetan Plateau. J. Geogr. Sci. 20(5), 757-770.
doi: 10.1007/s11442-010-0809-2 |
| [53] | Yin Y.T., Hou Y.L., Langford C., et al., 2019. Herder stocking rate and household income under the Grassland Ecological Protection Award Policy in northern China. Land Use Pol. 82, 120-129. |
| [54] | Yu B., Cao B., Zhu H.G., 2024. Forest worker households in the NFPP: Enhancing sustainable livelihoods through capital and transformation. Forests. 15(6), 936, doi: 10.3390/f15060936. |
| [55] | Zenteno M., Zuidema P.A., de Jong W., et al., 2013. Livelihood strategies and forest dependence: New insights from Bolivian forest communities. Forest Policy Econ. 26, 12-21. |
| [56] | Zhang J., Mishra A.K., Zhu P.X., 2019. Identifying livelihood strategies and transitions in rural China: Is land holding an obstacle? Land Use Pol. 80, 107-117. |
| [57] | Zhang Y.H., Zhao W., 2024. Social capital’s role in mitigating economic vulnerability: Understanding the impact of income disparities on farmers’ livelihoods. World Dev. 177, 106515, doi: 10.1016/j.worlddev.2023.106515. |
| [58] | Zhong F.L., Liu Y.S., Ma Y.L., et al., 2025. The government’s impact on the transformation of rural livelihoods in agropastoral regions: A quantitative analysis of farmers’ perceptions of public services in Inner Mongolia, China. Land Use Pol. 157, 107642, doi: 10.1016/j.landusepol.2025.107642. |
| [1] | SONG Boyi, ZHANG Shihang, LU Yongxing, GUO Hao, GUO Xing, WANG Mingming, ZHANG Yuanming, ZHOU Xiaobing, ZHUANG Weiwei. Characteristics and drivers of the soil multifunctionality under different land use and land cover types in the drylands of China [J]. Regional Sustainability, 2024, 5(3): 100162-. |
| [2] | TIAN Junfeng, WANG Binyan, QIU Cheng, WANG Shijun. What are the underlying causes and dynamics of land use conflicts in metropolitan junction areas? A case study of the central Chengdu- Chongqing region in China [J]. Regional Sustainability, 2024, 5(3): 100161-. |
| [3] | Peng He, Lishuai Xu, Zhengchun Liu, Yaodong Jing, Wenbo Zhu. Dynamics of NDVI and its influencing factors in the Chinese Loess Plateau during 2002-2018 [J]. Regional Sustainability, 2021, 2(1): 36-46. |
| Viewed | ||||||
|
Full text |
|
|||||
|
Abstract |
|
|||||
 REGSUS Wechat
 新公网安备 65010402001202号