Regional Sustainability ›› 2025, Vol. 6 ›› Issue (2): 100214.doi: 10.1016/j.regsus.2025.100214cstr: 32279.14.REGSUS.2025013
• Research article • Previous Articles Next Articles
Hussain Mohi-ud-Din QADRIa,b, Hassnian ALIc,d, Atta UL MUSTAFAc,d,*( )
)
Received:2024-08-09
Revised:2025-01-02
Accepted:2025-03-14
Published:2025-04-30
Online:2025-05-21
Contact:
*E-mail address: Atul88769@hbku.edu.qa (Atta UL MUSTAFA).
Hussain Mohi-ud-Din QADRI, Hassnian ALI, Atta UL MUSTAFA. Relationship between environmental performance indices and blockchain-based sustainability-focused companies: Evidence from countries in Europe and America[J]. Regional Sustainability, 2025, 6(2): 100214.
Table 1
Description of variables."
| Variable | Category | Sub-category | Unit | Transformation | |
|---|---|---|---|---|---|
| Dependent variable | Blockchain technology | - | Formation of blockchain-based sustainability-focused companies | - | None |
| Number of funding rounds | - | None | |||
| Number of lead investors | Persons | None | |||
| Independent variable | Ecosystem vitality | Biodiversity and habitat | National terrestrial biome protection efforts | % | None |
| Global terrestrial biome protection efforts | % | None | |||
| Marine protected areas | % | None | |||
| Protected area representativeness index | - | None | |||
| Biodiversity habitat index | - | None | |||
| Species protection index | % | None | |||
| Species habitat index | % | None | |||
| Ecosystem services | Tree cover loss | % | Logarithmic transformation | ||
| Grassland loss | % | Logarithmic transformation | |||
| Wetland loss | % | Logarithmic transformation | |||
| Fishery | Fish stock status | % | Logarithmic transformation | ||
| Marine trophic index | - | Logarithmic transformation | |||
| Fish caught by trawling | % | Logarithmic transformation | |||
| Acidification | Adjusted emission growth rate for sulfur dioxide (SO2) | mg/m3 | Logarithmic transformation | ||
| Adjusted emission growth rate for nitric oxide (NO) | mg/m3 | Logarithmic transformation | |||
| Agriculture | Sustainable pesticide use | - | None | ||
| Sustainable nitrogen (N) management index | - | None | |||
| Water resources | Wastewater treatment | % | None | ||
| Environmental health | Air quality | PM2.5 exposure | mg/m3 | Logarithmic transformation | |
| Household solid fuels | Age-standardized DALYs/105 persons | Logarithmic transformation | |||
| Ozone exposure | Age-standardized DALYs/105 persons | Logarithmic transformation | |||
| Oxynitride (NOx) exposure | mg/m3 | Logarithmic transformation | |||
| SO2 exposure | mg/m3 | Logarithmic transformation | |||
| Carbon monoxide (CO) exposure | mg/m3 | Logarithmic transformation | |||
| Volatile organic compound exposure | mg/m3 | Logarithmic transformation | |||
| Sanitation and drinking water | Unsafe sanitation | Age-standardized DALYs/105 persons | Logarithmic transformation | ||
| Unsafe drinking water | Age-standardized DALYs/105 persons | Logarithmic transformation | |||
| Heavy metals | Plumbum (Pb) exposure | Age-standardized DALYs/105 persons | Logarithmic transformation | ||
| Waste management | Controlled solid waste | % | None | ||
| Recycling | % | None | |||
| Ocean plastics | 106 t | Logarithmic transformation | |||
| Climate change performance | - | Adjusted emission growth rate for carbon dioxide (CO2) | % | None | |
| Adjusted emission growth rate for CH4 | % | None | |||
| Adjusted emission growth rate for F-gases | % | None | |||
| Adjusted emission growth rate for Nitrous Oxide (N2O) | % | None | |||
| Adjusted emission growth rate for black carbon | % | None | |||
| Projected greenhouse gas emissions in 2050 | Gg CO2-equivalent | Logarithmic transformation | |||
| Growth rate in CO2 emissions from land cover | % | None | |||
| Greenhouse gas intensity growth rate | % | None | |||
| Greenhouse gas emissions per capita | Gg CO2-equivalent | Logarithmic transformation | |||
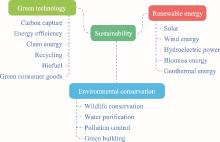
Fig. 1.
Categories of companies with sustainability."

Table 2
Results of negative binomial regression model between the formation of blockchain-based sustainability-focused companies and ecosystem vitality."
| Category | Sub-category | Biodiversity and habitat | Ecosystem services | Fishery | Acidification | Agriculture | Water resources |
|---|---|---|---|---|---|---|---|
| Biodiversity and habitat | National terrestrial biome protection efforts | -0.523** | |||||
| (0.069) | |||||||
| Global terrestrial biome protection efforts | 0.601** | ||||||
| (0.084) | |||||||
| Marine protected areas | 0.020** | ||||||
| (0.005) | |||||||
| Protected area representativeness index | -0.001 | ||||||
| (0.009) | |||||||
| Biodiversity habitat index | -0.005 | ||||||
| (0.014) | |||||||
| Species protection index | -0.027** | ||||||
| (0.006) | |||||||
| Species habitat index | -0.005 | ||||||
| (0.013) | |||||||
| Ecosystem services | Tree cover loss | -0.008 | |||||
| (0.026) | |||||||
| Grassland loss | -0.039** | ||||||
| (0.008) | |||||||
| Wetland loss | -0.008 | ||||||
| (0.009) | |||||||
| Fishery | Fish stock status | 0.009 | |||||
| (0.011) | |||||||
| Marine trophic index | -0.019** | ||||||
| (0.009) | |||||||
| Fish caught by trawling | 0.117** | ||||||
| (0.045) | |||||||
| Acidification | Adjusted emission growth rate for SO2 | -0.064 | |||||
| (0.080) | |||||||
| Adjusted emission growth rate for NO | 0.095** | ||||||
| (0.035) | |||||||
| Agriculture | Sustainable pesticide use | -0.015 | |||||
| (0.009) | |||||||
| Sustainable N management index | 0.067** | ||||||
| (0.014) | |||||||
| Water resources | Wastewater treatment | -0.026** | |||||
| (0.008) | |||||||
| Constant | -6.954** | 3.442** | -0.400 | -2.507 | -2.962** | 2.399** | |
| (2.285) | (0.797) | (0.361) | (6.583) | (0.728) | (0.658) | ||
| lnalpha | -0.165 | 1.116** | 1.223** | 1.290** | 1.119** | 1.262** | |
| (0.278) | (0.167) | (0.166) | (0.163) | (0.173) | (0.165) | ||
| Observations | 195 | 195 | 195 | 195 | 195 | 195 | |
| AIC | 500.051 | 568.975 | 582.076 | 585.861 | 572.436 | 582.397 | |
Table 3
Results of negative binomial regression model between the number of funding rounds and ecosystem vitality."
| Category | Sub-category | Biodiversity and habitat | Ecosystem services | Fishery | Acidification | Agriculture | Water resources |
|---|---|---|---|---|---|---|---|
| Biodiversity and habitat | National terrestrial biome protection efforts | -0.743** | |||||
| (0.134) | |||||||
| Global terrestrial biome protection efforts | 0.865** | ||||||
| (0.162) | |||||||
| Marine protected areas | 0.038** | ||||||
| (0.009) | |||||||
| Protected area representativeness index | 0.034** | ||||||
| (0.016) | |||||||
| Biodiversity habitat index | 0.009 | ||||||
| (0.020) | |||||||
| Species protection index | -0.051** | ||||||
| (0.010) | |||||||
| Species habitat index | 0.006 | ||||||
| (0.022) | |||||||
| Ecosystem services | Tree cover loss | -0.016 | |||||
| (0.043) | |||||||
| Grassland loss | -0.045** | ||||||
| (0.012) | |||||||
| Wetland loss | -0.020 | ||||||
| (0.017) | |||||||
| Fishery | Fish stock status | 0.019 | |||||
| (0.026) | |||||||
| Marine trophic index | -0.017 | ||||||
| (0.013) | |||||||
| Fish caught by trawling | 0.124 | ||||||
| (0.090) | |||||||
| Acidification | Adjusted emission growth rate for SO2 | -0.221* | |||||
| (0.121) | |||||||
| Adjusted emission growth rate for NO | 0.162** | ||||||
| (0.063) | |||||||
| Agriculture | Sustainable pesticide use | -0.031* | |||||
| (0.017) | |||||||
| Sustainable N management index | 0.073** | ||||||
| (0.023) | |||||||
| Water resources | Wastewater treatment | -0.020* | |||||
| (0.012) | |||||||
| Constant | -14.411** | 4.712** | -0.565 | 6.581 | -2.423** | 2.163** | |
| (3.996) | (1.437) | (0.551) | (8.711) | (1.082) | (1.002) | ||
| lnalpha | 1.194** | 2.108** | 2.185** | 2.204** | 2.157** | 2.256** | |
| (0.224) | (0.182) | (0.181) | (0.180) | (0.182) | (0.179) | ||
| Observations | 195 | 195 | 195 | 195 | 195 | 195 | |
| AIC | 448.210 | 497.015 | 503.611 | 502.246 | 499.718 | 504.469 | |
Table 4
Results of negative binomial regression model between the number of lead investors and ecosystem vitality."
| Category | Sub-category | Biodiversity and habitat | Ecosystem services | Fishery | Acidification | Agriculture | Water resources |
|---|---|---|---|---|---|---|---|
| Biodiversity and habitat | National terrestrial biome protection efforts | -0.551** | |||||
| (0.125) | |||||||
| Global terrestrial biome protection efforts | 0.635** | ||||||
| (0.150) | |||||||
| Marine protected areas | 0.034** | ||||||
| (0.009) | |||||||
| Protected area representativeness index | 0.004 | ||||||
| (0.019) | |||||||
| Biodiversity habitat index | 0.027 | ||||||
| (0.031) | |||||||
| Species protection index | -0.028** | ||||||
| (0.011) | |||||||
| Species habitat index | 0.017 | ||||||
| (0.026) | |||||||
| Ecosystem services | Tree cover loss | -0.083* | |||||
| (0.043) | |||||||
| Grassland loss | -0.042** | ||||||
| (0.013) | |||||||
| Wetland loss | -0.031* | ||||||
| (0.018) | |||||||
| Fishery | Fish stock status | 0.033 | |||||
| (0.023) | |||||||
| Marine trophic index | -0.037** | ||||||
| (0.016) | |||||||
| Fish caught by trawling | 0.110 | ||||||
| (0.084) | |||||||
| Acidification | Adjusted emission growth rate for SO2 | 0.026 | |||||
| (0.199) | |||||||
| Adjusted emission growth rate for NO | 0.177** | ||||||
| (0.069) | |||||||
| Agriculture | Sustainable pesticide use | -0.009 | |||||
| (0.019) | |||||||
| Sustainable N management index | 0.064** | ||||||
| (0.024) | |||||||
| Water resources | Wastewater treatment | -0.020 | |||||
| (0.014) | |||||||
| Constant | -12.025** | 5.925** | -0.460 | -19.522 | -2.808** | 2.197* | |
| (4.776) | (1.652) | (0.599) | (18.942) | (1.252) | (1.144) | ||
| lnalpha | 1.821** | 2.371** | 2.402** | 2.444** | 2.444** | 2.531** | |
| (0.221) | (0.191) | (0.192) | (0.189) | (0.191) | (0.188) | ||
| Observations | 195 | 195 | 195 | 195 | 195 | 195 | |
| AIC | 441.067 | 461.606 | 464.727 | 464.460 | 465.547 | 468.623 | |
Table 5
Results of negative binomial regression model between the formation of blockchain-based sustainability-focused companies and environmental health."
| Category | Sub-category | Air quality | Sanitation and drinking water | Heavy metals | Waste management |
|---|---|---|---|---|---|
| Air quality | PM2.5 exposure | 0.033** | |||
| (0.015) | |||||
| Household solid fuels | 0.029 | ||||
| (0.020) | |||||
| Ozone exposure | -0.032** | ||||
| (0.016) | |||||
| NOx exposure | -0.076 | ||||
| (0.054) | |||||
| SO2 exposure | -0.060** | ||||
| (0.018) | |||||
| CO exposure | 0.057* | ||||
| (0.033) | |||||
| Volatile organic compound exposure | -0.004 | ||||
| (0.012) | |||||
| Sanitation and drinking water | Unsafe sanitation | -0.165** | |||
| (0.024) | |||||
| Unsafe drinking water | 0.139** | ||||
| (0.023) | |||||
| Heavy metal | Pb exposure | -0.027* | |||
| (0.016) | |||||
| Waste management | Controlled solid waste | -0.005 | |||
| (0.050) | |||||
| Recycling | -0.015 | ||||
| (0.011) | |||||
| Ocean plastics | -0.053** | ||||
| (0.012) | |||||
| Constant | -2.059 | 2.836** | 2.628** | 2.214 | |
| (1.529) | (1.160) | (1.296) | (4.826) | ||
| lnalpha | 0.677** | 0.607** | 1.345** | 0.943** | |
| (0.203) | (0.221) | (0.161) | (0.180) | ||
| Observations | 195 | 195 | 195 | 195 | |
| AIC | 548.731 | 541.845 | 589.318 | 558.890 | |
Table 6
Results of negative binomial regression model between the number of funding rounds and environmental health."
| Category | Sub-category | Air quality | Sanitation and drinking water | Heavy metals | Waste management |
|---|---|---|---|---|---|
| Air quality | PM2.5 exposure | 0.049* | |||
| (0.027) | |||||
| Household solid fuels | 0.027 | ||||
| (0.036) | |||||
| Ozone exposure | -0.037 | ||||
| (0.023) | |||||
| NOx exposure | -0.172 | ||||
| (0.107) | |||||
| SO2 exposure | -0.063** | ||||
| (0.030) | |||||
| CO exposure | 0.081 | ||||
| (0.053) | |||||
| Volatile organic compound exposure | -0.005 | ||||
| (0.021) | |||||
| Sanitation and drinking water | Unsafe sanitation | -0.215** | |||
| (0.043) | |||||
| Unsafe drinking water | 0.215** | ||||
| (0.040) | |||||
| Heavy metal | Pb exposure | -0.023 | |||
| (0.025) | |||||
| Waste management | Controlled solid waste | 0.021 | |||
| (0.082) | |||||
| Recycling | -0.010 | ||||
| (0.017) | |||||
| Ocean plastics | -0.066** | ||||
| (0.020) | |||||
| Constant | -2.391 | 0.516 | 2.502 | 0.020 | |
| (2.316) | (1.938) | (2.070) | (7.893) | ||
| lalpha | 1.767** | 1.757** | 2.285** | 1.985** | |
| (0.199) | (0.200) | (0.178) | (0.190) | ||
| Observations | 195 | 195 | 195 | 195 | |
| AIC | 484.534 | 473.646 | 506.354 | 490.878 | |
Table 7
Results of negative binomial regression model between the number of lead investors and environmental health."
| Category | Sub-category | Air quality | Sanitation and drinking water | Heavy metals | Waste management |
|---|---|---|---|---|---|
| Air quality | PM2.5 exposure | 0.058** | |||
| (0.029) | |||||
| Household solid fuels | 0.031 | ||||
| (0.039) | |||||
| Ozone exposure | -0.036 | ||||
| (0.026) | |||||
| NOx exposure | -0.182 | ||||
| (0.111) | |||||
| SO2 exposure | -0.060* | ||||
| (0.034) | |||||
| CO exposure | 0.111* | ||||
| (0.067) | |||||
| Volatile organic compound exposure | -0.007 | ||||
| (0.025) | |||||
| Sanitation and drinking water | Unsafe sanitation | -0.171** | |||
| (0.041) | |||||
| Unsafe drinking water | 0.172** | ||||
| (0.038) | |||||
| Heavy metals | Pb exposure | -0.023 | |||
| (0.028) | |||||
| Waste management | Controlled solid waste | 0.087 | |||
| (0.103) | |||||
| Recycling | -0.016 | ||||
| (0.023) | |||||
| Ocean plastics | -0.057** | ||||
| (0.024) | |||||
| Constant | -4.945 | 0.451 | 2.503 | -6.391 | |
| (3.109) | (2.267) | (2.280) | (9.849) | ||
| lnalpha | 2.075** | 2.149** | 2.555** | 2.304** | |
| (0.203) | (0.205) | (0.187) | (0.196) | ||
| Observations | 195 | 195 | 195 | 195 | |
| AIC | 453.454 | 449.669 | 470.026 | 459.437 | |
Table 8
Results of negative binomial regression model between blockchain technology and climate change performance."
| Sub-category | Formation of blockchain-based sustainability-focused companies | Number of funding rounds | Number of lead investors |
|---|---|---|---|
| Adjusted emission growth rate for CO2 | 0.057** | 0.122 | 0.078** |
| (0.021) | (0.220) | (0.039) | |
| Adjusted emission growth rate for CH4 | 0.004 | 0.028 | 0.025 |
| (0.010) | (0.085) | (0.017) | |
| Adjusted emission growth rate for F-gases | 0.021** | 0.106 | 0.048** |
| (0.008) | (0.087) | (0.017) | |
| Adjusted emission growth rate for N2O | -0.020* | -0.006 | -0.015 |
| (0.012) | (0.191) | (0.025) | |
| Adjusted emission growth rate for black carbon | 0.035** | 0.245 | 0.096** |
| (0.016) | (0.193) | (0.049) | |
| Projected greenhouse gas emissions in 2050 | -0.030** | -0.120 | -0.042** |
| (0.008) | (0.092) | (0.015) | |
| Growth rate in CO2 emissions from land cover | -0.003 | -0.049 | -0.007 |
| (0.007) | (0.073) | (0.013) | |
| Greenhouse gas intensity growth rate | 0.034 | 0.345 | 0.077 |
| (0.023) | (0.251) | (0.055) | |
| Greenhouse gas emissions per capita | -0.039** | 0.041 | -0.041** |
| (0.011) | (0.091) | (0.019) | |
| Constant | -7.193** | -42.449* | -20.350** |
| (2.106) | (24.470) | (6.879) | |
| lnalpha | 0.592** | 4.142** | 1.975** |
| (0.210) | (0.160) | (0.202) | |
| Observations | 195 | 195 | 195 |
| AIC | 546.779 | 1717.363 | 447.493 |
| [1] | Al Aina, R., Faisal, R., 2024. Evaluating the role of sustainable leadership and technology integration in enhancing the environmental and social responsibility of the UAE banking sector. Archives of Business Research. 12(3), 17-39. |
| [2] | Alhasan, H., Hamdan, A., 2023. Blockchain technology and environmental sustainability. In: El Khoury, R., Nasrallah, N., (eds.). Emerging Trends and Innovation in Business and Finance. Singapore: Springer, 735-745. |
| [3] | Ali, H.S., Jia, F.Y., Lou, Z.Y., et al., 2023. Effect of blockchain technology initiatives on firms’ market value. Financ. Innov. 9, 48, doi: 10.1186/s40854-023-00456-8. |
| [4] | Ardillah, K., 2019. The impact of environmental performance and financing decisions to sustainable financial development. In:Proceedings of the 3rd Asia Pacific Management Research Conference (APMRC 2019). Seattle: Atlantis Press, 134-140. |
| [5] | Arshad, A., Shahzad, F., Ur Rehman, I., et al., 2023. A systematic literature review of blockchain technology and environmental sustainability: Status quo and future research. Int. Rev. Econ. Financ. 88, 1602-1622. |
| [6] | Athanasoglou, S., Węziak-Białowolska, D., Saisana, M., 2014. Environmental Performance Index 2014 JRC Analysis and Recommendations. [2024-07-10]. https://publications.jrc.ec.europa.eu/repository/bitstream/JRC89939/lbna26623enn.pdf. |
| [7] | Bădîrcea, R., Doran, N.M., Manta, A., et al., 2022. Linking financial development to environmental performance index—the case of Romania. Ekon. Istraz. 36(2), 2142635, doi: 10.1080/1331677x.2022.2142635. |
| [8] | Bager, S.L., Singh, C., Persson, U.M., 2022. Blockchain is not a silver bullet for agro-food supply chain sustainability: Insights from a coffee case study. Curr. Res. Environmental Sustainability. 4, 100163, doi: 10.1016/j.crsust.2022.100163. |
| [9] | Barney, J.B., 1991. Firm resources and sustained competitive advantage. J. Manag. 17(1), 3-10. |
| [10] | Chakrabartty, S.N., 2018. Better composite environmental performance index. Interdisciplinary Environmental Review. 19(2), 139-152. |
| [11] | Corrêa Tavares, E., de Souza Meirelles, F., Tavares, E.C., et al., 2021. Blockchain in the Amazon: Creating public value and promoting sustainability. Inf. Technol. Dev. 27(3), 579-598. |
| [12] | Dalle, J.M., Den Besten, M., Menon, C., 2017. Using Crunchbase for Economic and Managerial Research. [2024-07-10]. https://EconPapers.repec.org/RePEc:eee:techno:v:105:y:2021:i:c:s0166497220300833. |
| [13] | de Souza Cunha, F.A.F., de Oliveira, E.M., Orsato, R.J., et al., 2020. Can sustainable investments outperform traditional benchmarks? Evidence from global stock markets. Bus. Strateg. Environ. 29(2), 682-697. |
| [14] | Dutta, S., Chakraborty, S., 2024. Lightweight blockchain approach to reduce double-spend and 51% attacks on Proof-of-Work. Intell. Data Anal. 28(5), 1309-1319. |
| [15] | El-Basyouny, K., Sayed, T., 2006. Comparison of two negative binomial regression techniques in developing accident prediction models. Transportation Research Record: Journal of the Transportation Research Board. 1950(1), 9-16. |
| [16] | Faisal, M.N., Sabir, L.B., AlNaimi, M.S., et al., 2024. Critical role of coopetition among supply chains for blockchain adoption: Review of reviews and mixed-method analysis. Global Journal of Flexible Systems Management. 25, 117-136. |
| [17] | Färe Grosskopf, S., Hernández-Sancho, F.R., 2004. Environmental performance: An index number approach. Resour. Energy Econ. 26(4), 343-352. |
| [18] | Ferrati, F., Muffatto, M., 2020. Using crunchbase for research in entrepreneurship:Data content and structure. In: Proceedings of the European Conference on Research Methods in Business and Management Studies. Aveiro: Academic Conferences and Publishing International Limited, 342-351. |
| [19] | Freeman, R.E., 1984. Strategic Management:A Stakeholder Approach. Cambridge: Cambridge University Press, 1-276. |
| [20] |
Gardner, W., Mulvey, E.P., Shaw, E.C., 1995. Regression analyses of counts and rates: Poisson, overdispersed poisson, and negative binomial models. Psychol. Bull. 118(3), 392-404.
doi: 10.1037/0033-2909.118.3.392 pmid: 7501743 |
| [21] | Hsu, A., Zomer, A., 2016. The Environmental Performance Index. New York: John Wiley & Sons, Ltd. |
| [22] | Jo, H., Kim, H., Park, K., 2015. Corporate environmental responsibility and firm performance in the financial services sector. J. Bus. Ethics. 131, 257-284. |
| [23] | Kanmani, A.P., Obringer, R., Rachunok, B.A., et al., 2020. Assessing global environmental sustainability via an unsupervised clustering framework. Sustainability. 12(2), 563, doi: 10.3390/su12020563. |
| [24] | Kölbel, J.F., Heeb, F., Paetzold, F., et al., 2020. Can sustainable investing save the world? Reviewing the mechanisms of investor impact. Organ. Environ. 33, 554-574. |
| [25] | Kortelainen, M., 2008. Dynamic environmental performance analysis. Ecol. Econ. 64(4), 701-715. |
| [26] | Lee, J., Khan, V.M., 2022. Blockchain and energy commodity markets: Legal issues and impact on sustainability. The Journal of World Energy Law & Business. 15(6), 462-484. |
| [27] | Li, N.N., Gu, Z.J., Albasher, G., et al., 2023. Nexus of financial management, blockchain, and natural resources: Comparing the impact on environmental sustainability and resource productivity. Resour. Policy. 83, 103730, doi: 10.1016/j.resourpol.2023.103730. |
| [28] | Liang, Y.X.E., Yuan, S.T.D., 2016. Predicting investor funding behavior using crunchbase social network features. Internet Res. 26(1), 74-100. |
| [29] | Liu, H.B., Davidson, R.A., Rosowsky, D.V., et al., 2005. Negative binomial regression of electric power outages in hurricanes. J. Infrastruct. Syst. 11(4), 258-267. |
| [30] | Marti, L., Puertas, R., 2020. Assessment of sustainability using a synthetic index. Environ. Impact Assess. Rev. 84, 106375, doi: 10.1016/j.eiar.2020.106375. |
| [31] | Misra, N., Gupta, S., Sidhu, K.S., et al., 2023. Role of blockchain technology integration for green bonds issuance with sustainability aspect. International Journal on Recent and Innovation Trends in Computing and Communication. 11(6), 134-142. |
| [32] | Morse, S., 2019. Relating environmental performance of nation states to income and income inequality. Sustain. Dev. 26(1), 99-115. |
| [33] | O’Hara, R.B., Kotze, D.J., 2010. Do not log-transform count data. Methods Ecol. Evol. 1(2), 118-122. |
| [34] | Parmentola, A., Petrillo, A., Tutore, I., et al., 2022. Is blockchain able to enhance environmental sustainability? A systematic review and research agenda from the perspective of Sustainable Development Goals (SDGs). Bus. Strateg. Environ. 31(1), 194-217. |
| [35] | Pfeffer, J., Salancik, G.R., 1978. The External Control of Organizations: A Resource Dependence Perspective. Urbana: University of Illinois at Urbana-Champaign’s Academy for Entrepreneurial Leadership Historical Research Reference in Entrepreneurship, 969-970. |
| [36] | Piza, E.L., 2012. Using Poisson and Negative Binomial Regression Models to Measure the Influence of Risk on Crime Incident Counts. [2024-07-10]. https://www.rutgerscps.org/uploads/2/7/3/7/27370595/countregressionmodels.pdf. |
| [37] | Popkova, E.G., Bogoviz, A.V., Lobova, S.V., et al., 2023. Blockchain, sustainability and clean energy transition. Global Transitions. 5, 64-78. |
| [38] | Proença, A.S., Dias, T.R., Correia, M.P., 2024. Blockchain Based Residential Smart Rent. [2024-07-10]. https://arxiv.org/abs/2402.05737. |
| [39] | Rana, R.L., Giungato, P., Tarabella, A., et al., 2019. Blockchain applications and sustainability issues. Amfiteatru Econ. 21(13), 861-870. |
| [40] | Riedel, T., Velamuri, V.K., 2024. Addressing challenges: Adopting blockchain in the pharmaceutical industry for enhanced sustainability. Sustainability. 16(8), 3102, doi: 10.3390/su16083102. |
| [41] | Rohov, H., Prykhodko, S., Kolodiziev, O., et al., 2021. Factors of national environmental performance in sustainability management aspect. Problems and Perspectives in Management. 19(3), 70-84. |
| [42] | Ronaghi, M.H., Mosakhani, M., 2022. The effects of blockchain technology adoption on business ethics and social sustainability: Evidence from the Middle East. Environ. Dev. Sustain. 24, 6834-6859. |
| [43] | Rukhiran, M., Boonsong, S., Netinant, P., 2024. Sustainable optimizing performance and energy efficiency in proof of work blockchain: A multilinear regression approach. Sustainability. 16(4), 1519, doi: 10.3390/su16041519. |
| [44] | Saisana, M., Andrea, S., 2010. Uncertainty and Sensitivity Analysis of the Environmental Performance Index. [2024-07-10]. https://publications.jrc.ec.europa.eu/repository/bitstream/JRC56990/reqno_jrc56990_saisana_saltelli_2010epi_eur.pdf%5B1%5D.pdf. |
| [45] | Santoso, A.I., Zarlis, M., Mawengkang, H., 2024. Analysis of the role of blockchain technology in recording motor vehicle ownership data. Journal of Informatics and Telecommunication Engineering. 7(2), 397-408. |
| [46] | Sarker, M., Ali, S., Paul, S., et al., 2021. Measuring sustainability performance using an integrated model. Measurement. 184, 109931, doi: 10.1016/j.measurement.2021.109931. |
| [47] | Schneider, S., 2019. The impacts of digital technologies on innovating for sustainability. In: Bocken, N., Ritala, P., Albareda, L., (eds.). Innovation for Sustainability. Palgrave Studies in Sustainable Business in Association with Future Earth. Palgrave Macmillan. Cham: Palgrave Macmillan, 415-433. |
| [48] | Singh, S.K., Pan, Y., Park, J.H., 2022. Blockchain-enabled secure framework for energy-efficient smart parking in sustainable city environment. Sustain. Cities Soc. 76, 103364, doi: 10.1016/j.scs.2021.103364. |
| [49] | Srebotnjak, T., 2014. Development of the Environmental Performance Index. New York: John Wiley & Sons, Ltd. |
| [50] | Stratopoulos, T.C., 2018. Blockchain Technology Adoption. SSRN Electron. J. 14, 701-738. |
| [51] | Suchman, M.C., 1995. Managing legitimacy: Strategic and institutional approaches. Acad. Manage. Rev. 20(3), 571-610. |
| [52] | Sun, H.P., Mohsin, M., Alharthi, M., et al., 2020. Measuring environmental sustainability performance of South Asia. J. Clean. Prod. 251, 119519, doi: 10.1016/j.jclepro.2019.119519. |
| [53] | Tawiah, V., Zakari, A., Li, G., et al., 2022. Blockchain technology and environmental efficiency: Evidence from US-listed firms. Bus. Strateg. Environ. 31(8), 3757-3768. |
| [54] | Te, Y.F., Wieland, M., Frey, M., et al., 2023. Making it into a successful series a funding: An analysis of crunchbase and linkedin data. The Journal of Finance and Data Science. 9, 100099, doi: 10.1016/j.jfds.2023.100099. |
| [55] | Teh, D., Khan, T., Corbitt, B., et al., 2020. Sustainability strategy and blockchain-enabled life cycle assessment: A focus on materials industry. Environment Systems and Decisions. 40, 605-622. |
| [56] | Tornatzky, L., Fleischer, M., 1990. The processes of technological innovation. The Journal of Technology Transfer. 16, 45-46. |
| [57] |
Ver Hoef, J.M., Boveng, P.L., 2007. Quasi-Poisson vs. negative binomial regression: How should we model overdispersed count data? Ecology. 88(11), 2766-2772.
pmid: 18051645 |
| [58] | Wang, Q., Su, M., 2020. Integrating blockchain technology into the energy sector—from theory of blockchain to research and application of energy blockchain. Comput. Sci. Rev. 37, 100275, doi: 10.1016/j.cosrev.2020.100275. |
| [59] | Wang, Z.Q., Bai, Y., 2023. Enhancing supply chain resilience through government subsidies and blockchain adoption: Ensuring sustainability and preventing disruptions. Manag. Decis. Econ. 44(7), 3979-3996. |
| [60] | Wells Calkins, P., Balikov, S.G., 1994. Measuring Environmental Performance. In:Proceedings of 1994 IEEE International Symposium on Electronics and the Environment. San Francisco: IEEE. |
| [61] | Witulski, N., Dias, J.G., 2020. The Sustainable Society Index: Its reliability and validity. Ecol. Indic. 114, 106190, doi: 10.1016/j.ecolind.2020.106190. |
| [62] | Yadav, P.L., Han, S.H., Rho, J.J., 2016. Impact of environmental performance on firm value for sustainable investment: Evidence from large us firms. Bus. Strateg. Environ. 25(6), 402-420. |
| [63] | Yang, S.P., Berdine, G., 2015. The negative binomial regression. Southwest Respiratory and Critical Care Chronicles. 3(10), 50-54. |
| [64] | Żbikowski, K., Antosiuk, P., 2021. A machine learning, bias-free approach for predicting business success using Crunchbase data. Inf. Process. Manage. 58(4), 102555, doi: 10.1016/j.ipm.2021.102555. |
| [65] | ZiYa, A., Guo, X.C., 2023. Exploring the synergy of blockchain technology and low-carbon innovation for enterprise sustainability for unlocking a sustainable energy. Front. Energy Res. 11, 1273267, doi: 10.3389/fenrg.2023.1273267. |
| Viewed | ||||||
|
Full text |
|
|||||
|
Abstract |
|
|||||
 REGSUS Wechat
 新公网安备 65010402001202号