
Regional Sustainability ›› 2026, Vol. 7 ›› Issue (4): 100368.doi: 10.1016/j.regsus.2026.100368
• Research article • Previous Articles Next Articles
WEN Youyuea,b, CHEN Zhichaoa,b, CAI Saomana,b, YANG Jiana,b,*( )
)
Received:2025-07-30
Revised:2026-04-03
Accepted:2026-07-15
Published:2026-08-30
Online:2026-08-05
Contact:
*E-mail address: yangjian@scies.org (YANG Jian).
WEN Youyue, CHEN Zhichao, CAI Saoman, YANG Jian. Optimizing land cover planning for carbon neutrality: Policy insights from scenario-based vegetation carbon sink assessment in the Guangdong-Hong Kong-Macao Greater Bay Area, China[J]. Regional Sustainability, 2026, 7(4): 100368.
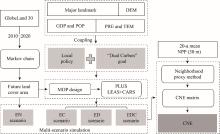
Fig. 1.
Integrated modeling framework for forecasting land cover change and corresponding Carbon Neutrality Effect (CNE). DEM, digital elevation model; GDP, gross domestic product; POP, population; PRE, precipitation; TEM, temperature; MOP, Multi-Objective Programming; PLUS, patch-generating land use simulation; LEAS, Land Expansion Analysis Strategy; CARS, Multi-Random Patch Seed; EN, natural development; EC, carbon neutrality first; ED, economic development first; EDC, sustainable development; NPP, net primary productivity."
Table 1
Socioeconomic benefit and carbon sink benefit of different land cover types in the Guangdong-Hong Kong-Macao Greater Bay Area (GBA)."
| Land cover type | Socioeconomic benefit per unit (×104 CNY/hm2) | Carbon sink per unit (×104 g C/m2) | Carbon sink benefit per unit (×104 CNY/hm2) |
|---|---|---|---|
| Crop land | 10.45 | 11.21 | 79.99 |
| Forested land | 0.90 | 22.82 | 162.88 |
| Grassland | 3.61 | 7.87 | 56.15 |
| Shrub land | 2.26 | 9.88 | 70.49 |
| Wetland | 4.82 | 1.43 | 10.24 |
| Water body | 6.86 | 0.00 | 0.00 |
| Urban area | 1033.68 | 0.00 | 0.00 |
| Bare land | 0.00 | 0.00 | 0.00 |
Table 2
Future area prediction of each land cover type under different scenarios in the GBA."
| Scenario | Year | Crop land (×104 hm2) | Forested land (×104 hm2) | Grassland (×104 hm2) | Shrub land (×104 hm2) | Wetland (×104 hm2) | Water body (×104 hm2) | Urban area (×104 hm2) | Bare land (×104 hm2) |
|---|---|---|---|---|---|---|---|---|---|
| Current value | 2020 | 107.87 | 271.22 | 30.40 | 7.39 | 0.14 | 44.67 | 90.88 | 0.64 |
| EN scenario | 2030 | 93.70 | 258.43 | 26.65 | 6.83 | 0.16 | 43.44 | 123.42 | 0.57 |
| 2040 | 83.60 | 245.94 | 24.47 | 6.44 | 0.16 | 41.78 | 150.28 | 0.53 | |
| 2050 | 76.36 | 234.19 | 23.06 | 6.17 | 0.16 | 40.01 | 172.75 | 0.50 | |
| 2060 | 71.11 | 223.37 | 22.05 | 5.96 | 0.15 | 38.32 | 191.75 | 0.48 | |
| ED scenario | 2030 | 104.32 | 272.56 | 19.99 | 5.91 | 0.14 | 44.67 | 105.60 | 0.00 |
| 2040 | 101.80 | 272.56 | 18.35 | 4.73 | 0.14 | 44.67 | 110.95 | 0.00 | |
| 2050 | 99.99 | 272.56 | 17.30 | 3.78 | 0.14 | 44.67 | 114.76 | 0.00 | |
| 2060 | 98.68 | 272.56 | 16.54 | 3.08 | 0.14 | 44.67 | 117.53 | 0.00 | |
| EC scenario | 2030 | 104.32 | 287.29 | 19.99 | 5.91 | 0.14 | 44.67 | 90.88 | 0.00 |
| 2040 | 101.80 | 292.63 | 18.35 | 4.73 | 0.14 | 44.67 | 90.88 | 0.00 | |
| 2050 | 99.99 | 296.45 | 17.30 | 3.78 | 0.14 | 44.67 | 90.88 | 0.00 | |
| 2060 | 98.68 | 299.27 | 16.54 | 3.03 | 0.14 | 44.67 | 90.88 | 0.00 | |
| EDC scenario | 2030 | 104.32 | 273.89 | 19.99 | 5.91 | 0.14 | 44.67 | 104.28 | 0.00 |
| 2040 | 101.80 | 276.55 | 18.35 | 4.73 | 0.14 | 44.67 | 106.96 | 0.00 | |
| 2050 | 99.99 | 279.20 | 17.30 | 3.78 | 0.14 | 44.67 | 108.12 | 0.00 | |
| 2060 | 98.68 | 281.86 | 16.54 | 3.03 | 0.14 | 44.67 | 108.29 | 0.00 |
Table 3
Transition cost matrix under four scenarios in the GBA."
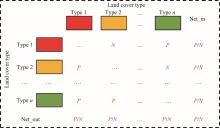
Fig. 2.
Schematic of the CNE matrix for land cover type changes. This matrix illustrates the net CNE resulting from transitions between different land cover types. Each cell in the matrix represents the CNE associated with the conversion from the column land cover type to the row land cover type. P denotes a positive CNE (>0); N denotes a negative CNE (<0); P/N indicates a mixed or context-dependent effect (e.g., partially positive and partially negative, or varying under different conditions); Net_in represents the total CNE (row sum) resulting from the conversion of all other land cover types into a given land cover type; Net_out represents the total CNE (column sum) resulting from the conversion out of a given land cover type to all other land cover types. The colored blocks along the left side and top of the matrix represent different land cover types (types 1-n), which are typically distinguished by patterns."
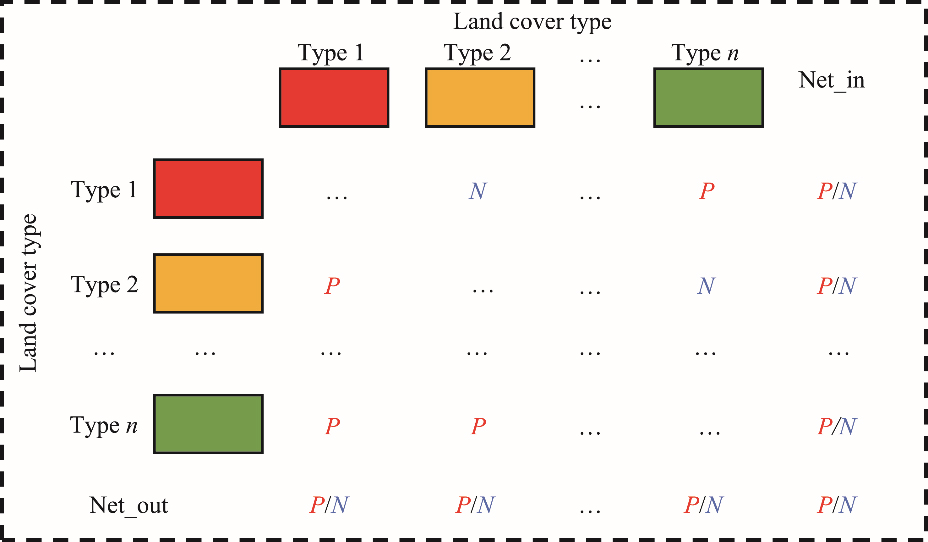
Fig. 3.
A schematic diagram of the neighborhood proxy method."
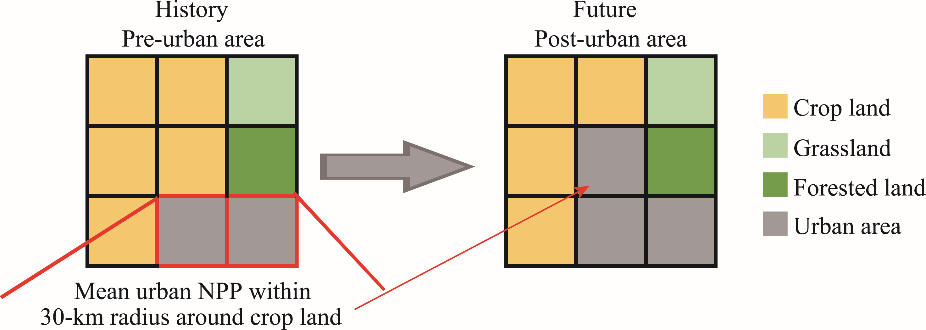
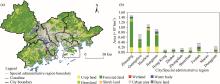
Fig. 4.
Spatial distribution of land cover types in the Guangdong-Hong Kong-Macao Greater Bay Area (GBA) in 2020 (a) and the corresponding areas of land cover types in each administrative region (b). Note that the figure is based on the standard map (GS(2024)0650) from the National Platform for Common Geospatial Information Services (Tianditu) (https://cloudcenter.tianditu.gov.cn/administrativeDivision/), and the boundary of the standard map has not been modified."

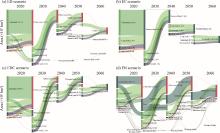
Fig. 5.
Sankey diagrams for projected land cover type changes under the ED (a), EC (b), EDC (c), and EN (d) scenarios in the GBA during 2020-2060. If a node has only outflow or only inflow, the value represents that unidirectional transfer (outflow or inflow, respectively). If a node has both inflow and outflow, the value represents the outflow (transfer from this land cover type to other land cover types). The corresponding inflow is not annotated on this node but is shown by the incoming flow in the Sankey diagram. Transitions between different land cover types across years are represented by connecting lines. The thickness of each line is proportional to the area of land transferred, with thicker line indicating larger transition area. Notably, the connections between the same land cover type across different years are present only for graphical layout and structural balance and do not represent actual land transfers, which occur exclusively between different land cover types."

Table 4
Carbon Neutrality Effect (CNE) matrix under the ED scenario in the GBA during 2020-2060."
| Period | Land cover type | Crop land (×1010 g C) | Grassland (×1010 g C) | Shrub land (×1010 g C) | Bare land (×1010 g C) | Sum (×1010 g C) | Net_in (×1010 g C) |
|---|---|---|---|---|---|---|---|
| 2020-2030 | Forested land | 1.91 | 0.82 | 0.32 | 0.02 | 3.08 | 3.08 |
| Urban area | -3.69 | -21.70 | -2.27 | 0.94 | -26.72 | -26.72 | |
| 2030-2040 | Urban area | -3.38 | -4.61 | -2.61 | - | -10.59 | -10.59 |
| 2040-2050 | Urban area | -2.51 | -3.42 | -2.09 | - | -8.02 | -8.02 |
| 2050-2060 | Urban area | -1.82 | -2.80 | -1.47 | - | -6.09 | -6.09 |
| 2020-2060 | Forested land | 1.91 | 0.82 | 0.32 | 0.02 | 3.08 | -48.35 |
| Urban area | -11.41 | -32.52 | -8.43 | 0.94 | -51.43 | ||
| Net_out | -9.49 | -31.71 | -8.11 | 0.96 | -48.35 |
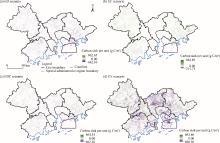
Fig. 6.
Spatial distribution of carbon sink per unit resulting from land cover transitions under the ED (a), EC (b), EDC (c), and EN (d) scenarios in the GBA during 2020-2060."

Table 5
CNE matrix under the EC scenario in the GBA during 2020-2060."
| Period | Land cover type | Crop land (×1010 g C) | Grassland (×1010 g C) | Shrub land (×1010 g C) | Bare land (×1010 g C) | Sum (×1010 g C) | Net_in (×1010 g C) |
|---|---|---|---|---|---|---|---|
| 2020-2030 | Forested land | 9.67 | 16.46 | 4.16 | 4.33 | 34.63 | 34.63 |
| 2030-2040 | Forested land | 6.98 | 2.71 | 3.39 | - | 13.08 | 13.08 |
| 2040-2050 | Forested land | 5.03 | 1.78 | 2.76 | - | 9.58 | 9.58 |
| 2050-2060 | Forested land | 3.65 | 1.30 | 2.27 | - | 7.22 | 7.22 |
| 2020-2060 | Forested land | 25.34 | 22.26 | 12.59 | 4.33 | 64.52 | 64.52 |
| Net_out | 25.34 | 22.26 | 12.59 | 4.33 | 64.52 |
Table 6
CNE matrix under the EDC scenario in the GBA during 2020-2060."
| Period | Land cover type | Crop land (×1010 g C) | Grassland (×1010 g C) | Shrub land (×1010 g C) | Bare land (×1010 g C) | Sum (×1010 g C) | Net_in (×1010 g C) |
|---|---|---|---|---|---|---|---|
| 2020-2030 | Forested land | 3.27 | 1.84 | 0.66 | 0.06 | 5.82 | -18.22 |
| Urban area | -2.99 | -19.94 | -2.03 | 0.93 | -24.03 | ||
| 2030-2040 | Forested land | 2.33 | 2.04 | 0.92 | - | 5.28 | 0.87 |
| Urban area | -2.16 | -0.44 | -1.80 | - | -4.41 | ||
| 2040-2050 | Forested land | 1.76 | 1.48 | 2.58 | - | 5.82 | 4.30 |
| Urban area | -1.52 | 0.00 | 0.00 | - | -1.52 | ||
| 2050-2060 | Forested land | 3.11 | 1.07 | 2.09 | - | 6.28 | 6.05 |
| Urban area | -0.22 | 0.00 | 0.00 | - | -0.22 | ||
| 2020-2060 | Forested land | 10.46 | 6.42 | 6.25 | 0.06 | 23.20 | -7.00 |
| Urban area | -6.90 | -20.39 | -3.83 | 0.93 | -30.19 | ||
| Net_out | 3.56 | -13.96 | 2.42 | 0.99 | -7.00 |
Table 7
CNE matrix under the EN scenario in the GBA during 2020-2060."
| Period | Land cover type | Crop land (×1010 g C) | Forested land (×1010 g C) | Grassland (×1010 g C) | Shrub land (×1010 g C) | Wetland (×1010 g C) | Water body (×1010 g C) | Bare land (×1010 g C) | Sum (×1010 g C) | Net_in (×1010 g C) |
|---|---|---|---|---|---|---|---|---|---|---|
| 2020-2030 | Forested land | 0.00 | - | 7.45 | 0.86 | 0.02 | 0.00 | - | 8.33 | -74.22 |
| Grassland | - | -8.43 | - | 0.06 | 0.00 | - | - | -8.37 | ||
| Shrub land | - | -0.29 | -0.01 | - | 0.00 | - | - | -0.29 | ||
| Wetland | 0.00 | -0.02 | -0.04 | 0.00 | - | 0.01 | 0.00 | -0.04 | ||
| Urban area | -18.30 | -49.46 | -7.93 | -0.43 | -0.01 | 2.16 | 0.11 | -73.84 | ||
| 2030-2040 | Forested land | - | - | 9.57 | 0.56 | - | - | - | 10.13 | -71.87 |
| Grassland | - | -13.68 | - | 0.03 | - | - | - | -13.65 | ||
| Shrub land | - | -0.14 | 0.00 | - | - | - | - | -0.14 | ||
| Wetland | 0.00 | 0.00 | - | 0.00 | - | 0.00 | 0.00 | 0.00 | ||
| Urban area | -13.93 | -45.91 | -11.10 | -0.31 | - | 2.97 | 0.07 | -68.22 | ||
| 2040-2050 | Crop land | - | -0.05 | 0.00 | 0.00 | 0.00 | - | - | -0.05 | -67.84 |
| Forested land | 0.56 | - | 2.12 | 0.40 | 0.01 | - | - | 3.09 | ||
| Shrub land | 0.00 | -0.07 | 0.00 | - | 0.00 | - | - | -0.08 | ||
| Wetland | 0.00 | 0.00 | - | - | - | - | - | 0.00 | ||
| Urban area | -10.09 | -63.64 | -0.03 | -0.28 | 0.00 | 3.20 | 0.04 | -70.80 | ||
| 2050-2060 | Crop land | - | -0.18 | -0.01 | 0.00 | 0.00 | - | - | -0.19 | -60.60 |
| Forested land | 1.18 | - | 1.50 | 0.29 | 0.02 | - | - | 2.99 | ||
| Shrub land | 0.00 | -0.05 | 0.00 | - | 0.00 | - | - | -0.05 | ||
| Wetland | - | 0.00 | - | - | - | - | - | 0.00 | ||
| Urban area | -7.09 | -59.10 | -0.04 | -0.23 | 0.00 | 3.09 | 0.02 | -63.35 | ||
| 2020-2060 | Crop land | - | -0.23 | -0.01 | 0.00 | 0.00 | - | - | -0.24 | -274.54 |
| Forested land | 1.75 | - | 20.64 | 2.11 | 0.04 | 0.00 | - | 24.54 | ||
| Grassland | - | -22.11 | 0.00 | 0.09 | 0.00 | - | - | -22.02 | ||
| Shrub land | 0.00 | -0.55 | -0.01 | - | 0.00 | - | - | -0.56 | ||
| Wetland | 0.00 | -0.02 | -0.04 | 0.00 | - | 0.01 | 0.00 | -0.04 | ||
| Urban area | -49.41 | -218.10 | -19.11 | -1.25 | -0.01 | 11.42 | 0.25 | -276.21 | ||
| Net_out | -47.67 | -241.00 | 1.47 | 0.95 | 0.04 | 11.43 | 0.25 | -274.54 |
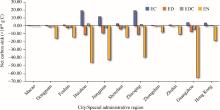
Fig. 7.
Net vegetation carbon sink under the ED, EC, EDC, and EN scenarios in the GBA during 2020-2060."
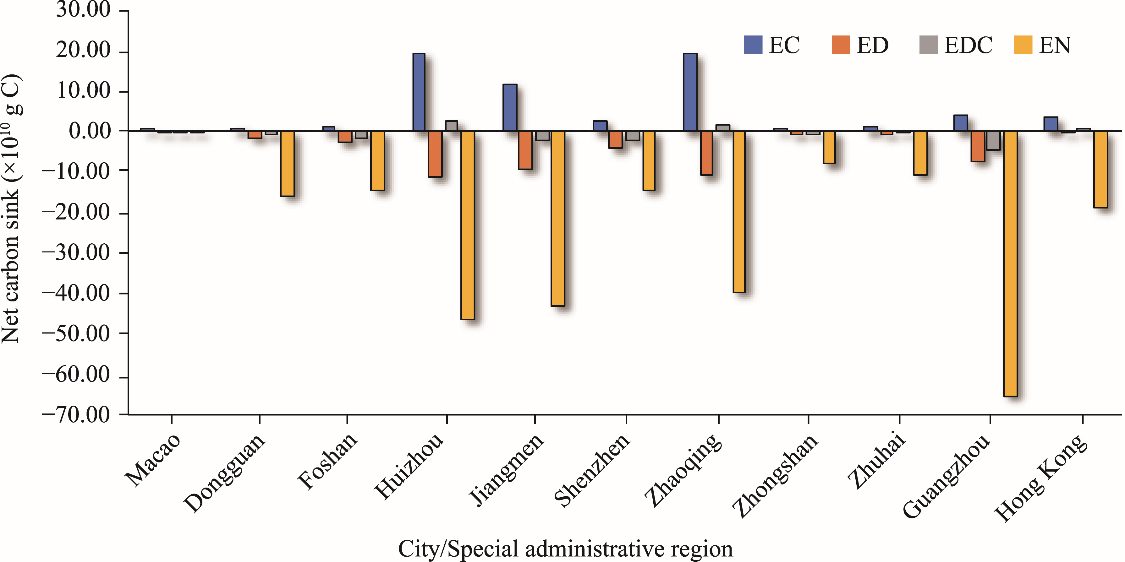
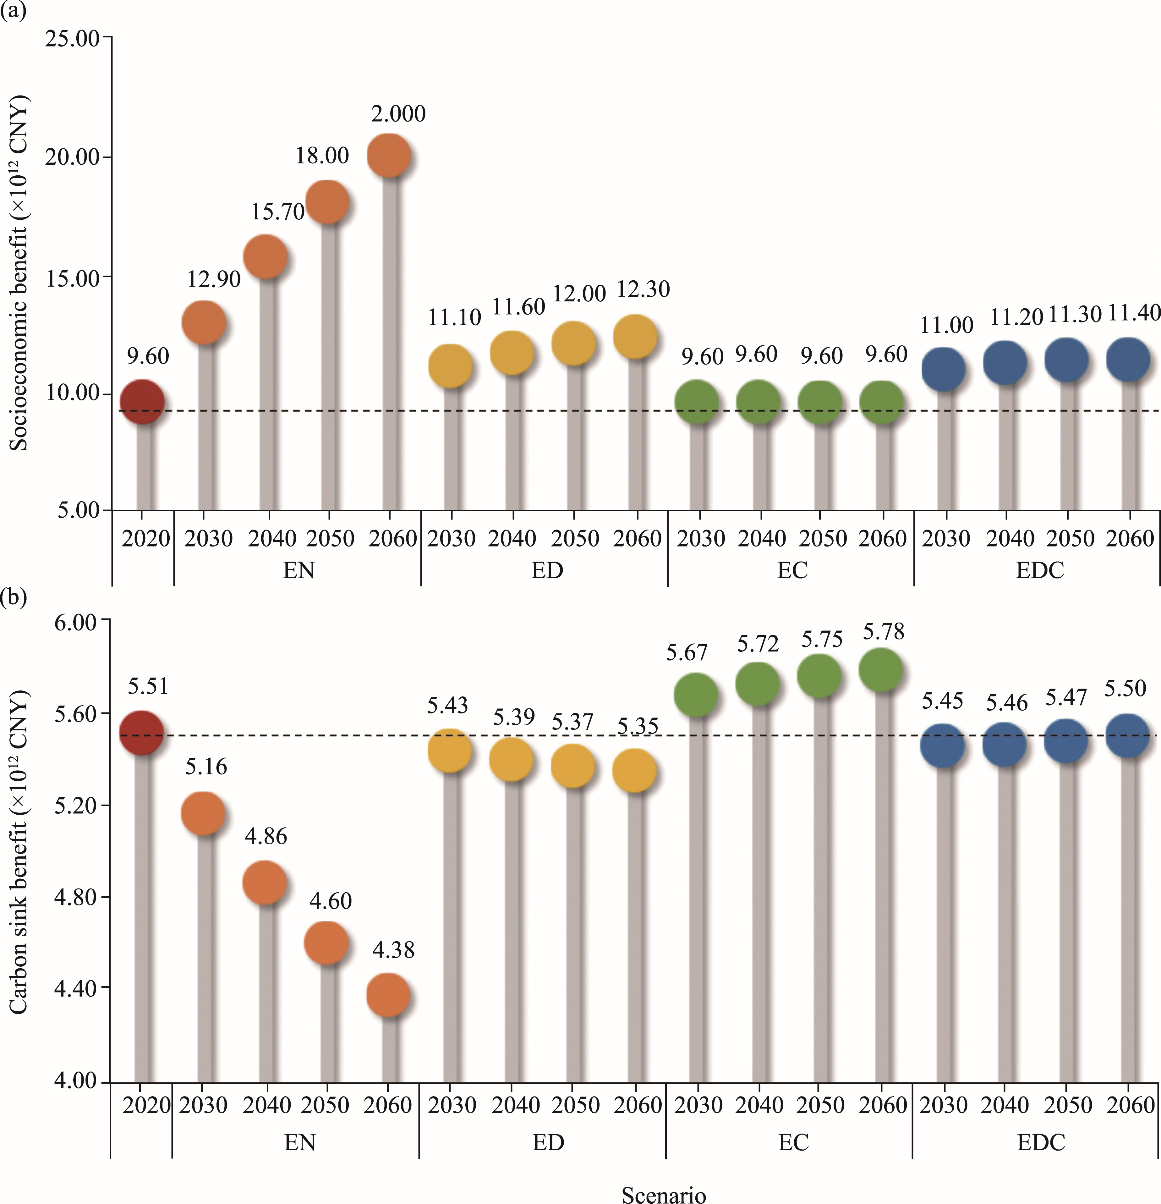
Fig. 8.
Comparison of changes in socioeconomic benefit (a) and carbon sink benefit (b) in 2020 and in the future (2020-2060). The dotted line indicates baseline value for 2020 (base year)."
| [1] | Aburas M.M., Ho Y.M., Ramli M.F., et al., 2016. The simulation and prediction of spatio-temporal urban growth trends using cellular automata models: A review. International Journal of Applied Earth Observation and Geoinformation. 52, 380-389. |
| [2] |
Brockerhoff E.G., Barbaro L., Castagneyrol B., et al., 2017. Forest biodiversity, ecosystem functioning and the provision of ecosystem services. Biodiversity and Conservation. 26(13), 3005-3035.
doi: 10.1007/s10531-017-1453-2 |
| [3] | Census and Statistics Department, the Government of the Hong Kong Special Administrative Region, 2021. Hong Kong Annual Digest of Statistics 2021. Hong Kong:Census and Statistics Department. |
| [4] | Chen J., Chen J., Liao A.P., et al., 2015. Global land cover mapping at 30 m resolution: A POK-based operational approach. ISPRS Journal of Photogrammetry and Remote Sensing. 103, 7-27. |
| [5] |
Chen J.M., Ju W.M., Ciais P., et al., 2019. Vegetation structural change since 1981 significantly enhanced the terrestrial carbon sink. Nature Communications. 10(1), 4259, doi: 10.1038/s41467-019-12257-8.
pmid: 31534135 |
| [6] |
Chen L., Msigwa G., Yang M.Y., et al., 2022. Strategies to achieve a carbon neutral society: a review. Environmental Chemistry Letters. 20(4), 2277-2310.
doi: 10.1007/s10311-022-01435-8 |
| [7] | Ding Q., Shao Z.F., Huang X., et al., 2022. Time-series land cover mapping and urban expansion analysis using OpenStreetMap data and remote sensing big data: A case study of Guangdong-Hong Kong-Macao Greater Bay Area, China. International Journal of Applied Earth Observation and Geoinformation. 113, 103001, doi: 10.1016/j.jag.2022.103001. |
| [8] |
Dong H.M., Liu Y.S., Zhao Z.H., et al., 2022. Carbon neutrality commitment for China: from vision to action. Sustainability Science. 17(5), 1741-1755.
doi: 10.1007/s11625-022-01094-2 |
| [9] | Feng D.R., Bao W.K., Yang Y.Y., et al., 2021. How do government policies promote greening? Evidence from China. Land Use Policy. 104, 105389, doi: 10.1016/j.landusepol.2021.105389. |
| [10] | Feng X.Y., Zhao X., Tong L., et al., 2025. Impacts of land use and cover change on carbon storage: Multi-scenario projections in the arid region of Northwest China. Regional Sustainability. 6(4), 100248, doi: 10.1016/j.regsus.2025.100248. |
| [11] |
Fleiss J.L., Cohen J., 1973. The equivalence of weighted Kappa and the intraclass correlation coefficient as measures of reliability. Educational and Psychological Measurement. 33(3), 613-619.
doi: 10.1177/001316447303300309 |
| [12] | Friend A.D., Lucht W., Rademacher T.T., et al., 2014. Carbon residence time dominates uncertainty in terrestrial vegetation responses to future climate and atmospheric CO2. Proceedings of the National Academy of Sciences of the United States of America. 111(9), 3280-3285. |
| [13] |
Fu Y.C., Lu X.Y., Zhao Y.L., et al., 2013. Assessment impacts of weather and land use/land cover (LULC) change on urban vegetation net primary productivity (NPP): A case study in Guangzhou, China. Remote Sensing. 5(8), 4125-4144.
doi: 10.3390/rs5084125 |
| [14] | Gomes E., Inácio M., Bogdzevič K., et al., 2021. Future land-use changes and its impacts on terrestrial ecosystem services: A review. Science of The Total Environment. 781, 146716, doi: 10.1016/j.scitotenv.2021.146716. |
| [15] |
Guan D.J., Zhao Z.L., Tan J., 2019. Dynamic simulation of land use change based on logistic-CA-Markov and WLC-CA-Markov models: a case study in three gorges reservoir area of Chongqing, China. Environmental Science and Pollution Research. 26(20), 20669-20688.
doi: 10.1007/s11356-019-05127-9 |
| [16] | Guangdong Provincial Bureau of Statistics, 2021. Guangdong Statistical Yearbook 2022. Guangzhou: Guangdong Provincial Bureau of Statistics (in Chinese). |
| [17] | Guo W., Teng Y.J., Li J., et al., 2024. A new assessment framework to forecast land use and carbon storage under different SSP-RCP scenarios in China. Science of The Total Environment. 912, 169088, doi: 10.1016/j.scitotenv.2023.169088. |
| [18] |
Imhoff M.L., Bounoua L., Defries R., et al., 2004. The consequences of urban land transformation on net primary productivity in the United States. Remote Sensing of Environment. 89(4), 434-443.
doi: 10.1016/j.rse.2003.10.015 |
| [19] |
Jiang X.W., Bai J.J., 2021. Predicting and assessing changes in NPP based on multi-scenario land use and cover simulations on the Loess Plateau. Journal of Geographical Sciences. 31(7), 977-996.
doi: 10.1007/s11442-021-1881-5 |
| [20] | Khastar M., Aslani A., Nejati M., 2020. How does carbon tax affect social welfare and emission reduction in Finland? Energy Reports. 6, 736-744. |
| [21] | Lal R., Smith P., Jungkunst H.F., et al., 2018. The carbon sequestration potential of terrestrial ecosystems. Journal of Soil and Water Conservation. 73(6), 145A, doi: 10.2489/jswc.73.6.145A. |
| [22] | Lao J.Y., Wang C., Wang J.L., et al., 2020. Land use simulation of Guangzhou based on nighttime light data and planning policies. Remote Sensing. 12, 1675, doi: 10.3390/rs12101675. |
| [23] | Li J., Wang Z.L., Lai C.G., et al., 2018. Response of net primary production to land use and land cover change in mainland China since the late 1980s. Science of The Total Environment. 639, 237-247. |
| [24] |
Li X., Chen Y.M., Liu X.P., et al., 2011. Concepts, methodologies, and tools of an integrated geographical simulation and optimization system. International Journal of Geographical Information Science. 25(4), 633-655.
doi: 10.1080/13658816.2010.496370 |
| [25] | Liang X., Guan Q.F., Clarke K.C., et al., 2021. Understanding the drivers of sustainable land expansion using a patch-generating land use simulation (PLUS) model: A case study in Wuhan, China. Computers, Environment and Urban Systems. 85, 101569, doi: 10.1016/j.compenvurbsys.2020.101569. |
| [26] |
Liu X.P., Pei F.S., Wen Y.Y., et al., 2019. Global urban expansion offsets climate-driven increases in terrestrial net primary productivity. Nature Communications. 10(1), 5558, doi: 10.1038/s41467-019-13462-1.
pmid: 31804470 |
| [27] | Luan C.X., Liu R.Z., Zhang Q.Y., et al., 2024. Multi-objective land use optimization based on integrated NSGA-II-PLUS model: Comprehensive consideration of economic development and ecosystem services value enhancement. Journal of Cleaner Production. 434, 140306, doi: 10.1016/j.jclepro.2023.140306. |
| [28] | Nemani R.R., Keeling C.D., Hashimoto H., et al., 2003. Climate-driven increases in global terrestrial net primary production from 1982 to 1999. Science. 300, 1560-1563. |
| [29] | Peng K.F., Jiang W.G., Wang X.J., et al., 2023. Evaluation of future wetland changes under optimal scenarios and land degradation neutrality analysis in the Guangdong-Hong Kong-Macao Greater Bay Area. Science of The Total Environment. 879, 163111, doi: 10.1016/j.scitotenv.2023.163111. |
| [30] |
Pontius R.G., Boersma W., Castella J.C., et al., 2008. Comparing the input, output, and validation maps for several models of land change. The Annals of Regional Science. 42(1), 11-37.
doi: 10.1007/s00168-007-0138-2 |
| [31] | Potter C.S., Klooster S., Brooks V., 1999. Interannual variability in terrestrial net primary production: Exploration of trends and controls on regional to global scales. Ecosystems. 2, 36-48. |
| [32] |
Sang L.L., Zhang C., Yang J.Y., et al., 2011. Simulation of land use spatial pattern of towns and villages based on CA-Markov model. Mathematical and Computer Modelling. 54(3-4), 938-943.
doi: 10.1016/j.mcm.2010.11.019 |
| [33] | Statistics and Census Service of Macao Special Administrative Region, 2021. Macao Statistical Yearbook 2021. Macao: Statistics and Census Service. |
| [34] | Wang R.Y., Cai H.N., Chen L.K., et al., 2023. Spatiotemporal evolution and multi-scenario prediction of carbon storage in the GBA based on PLUS-InVEST models. Sustainability. 15(10), 8421, doi: 10.3390/su15108421. |
| [35] | Wang Y., Li X.M., Zhang Q., et al., 2018. Projections of future land use changes: Multiple scenarios-based impacts analysis on ecosystem services for Wuhan City, China. Ecological Indicators. 94, 430-445. |
| [36] | Wei X.D., Zhang S.Y., Luo P.P., et al., 2023. A multi-scenario prediction and spatiotemporal analysis of the land use and carbon storage response in Shaanxi. Remote Sensing. 15(20), 5036, doi: 10.3390/rs15205036. |
| [37] | Wen Y.Y., Liu X.P., Bai Y., et al., 2019. Determining the impacts of climate change and urban expansion on terrestrial net primary production in China. Journal of Environmental Management. 240, 75-83. |
| [38] | Wen Y.Y., Yang J., Liao W.L., et al., 2023. Refined assessment of space-time changes, influencing factors and socio-economic impacts of the terrestrial ecosystem quality: A case study of the GBA. Journal of Environmental Management. 345, 118869, doi: 10.1016/j.jenvman.2023.118869. |
| [39] | Wu H.Y., Zhai Z.H., Zhang Y., 2019. Analysis of climate change in Guangdong-Hong Kong-Macao Greater Bay Area from 1961 to 2018. Torrential Rain and Disasters. 38(4), 303-310 (in Chinese). |
| [40] | Wu W.T., Yang Z.Q., Tian B., et al., 2018. Impacts of coastal reclamation on wetlands: Loss, resilience, and sustainable management. Estuarine, Coastal and Shelf Science. 210, 153-161. |
| [41] | Wu Y.F., Wang J.B., Gou A.P., 2024. Research on the evolution characteristics, driving mechanisms and multi-scenario simulation of habitat quality in the Guangdong-Hong Kong-Macao Greater Bay based on multi-model coupling. Science of The Total Environment. 924, 171263, doi: 10.1016/j.scitotenv.2024.171263. |
| [42] | Xu G.Y., Dong H.Y., Xu Z.C., et al., 2022. China can reach carbon neutrality before 2050 by improving economic development quality. Energy. 243, 123087, doi: 10.1016/j.energy.2021.123087. |
| [43] | Yu B., Chen F., 2016. The global impact factors of net primary production in different land cover types from 2005 to 2011. SpringerPlus. 5, 1235, doi: 10.1186/s40064-016-2910-1. |
| [44] | Zhang Y., Liao X.Y., Sun D.Q., 2024. A coupled InVEST-PLUS model for the spatiotemporal evolution of ecosystem carbon storage and multi-scenario prediction analysis. Land. 13(4), 509, doi: 10.3390/land13040509. |
| [45] | Zhang Z., Jiang W.G., Peng K.F., et al., 2023. Assessment of the impact of wetland changes on carbon storage in coastal urban agglomerations from 1990 to 2035 in support of SDG15.1. Science of The Total Environment. 877, 162824, doi: 10.1016/j.scitotenv.2023.162824. |
| [46] |
Zhu Z.C., Piao S.L., Myneni R.B., et al., 2016. Greening of the Earth and its drivers. Nature Climate Change. 6(8), 791-795.
doi: 10.1038/NCLIMATE3004 |
| No related articles found! |
| Viewed | ||||||
|
Full text |
|
|||||
|
Abstract |
|
|||||
 REGSUS Wechat
 新公网安备 65010402001202号
