Regional Sustainability ›› 2026, Vol. 7 ›› Issue (2): 100333.doi: 10.1016/j.regsus.2026.100333
• Research article • Previous Articles Next Articles
FAN Liqina,b, LEI Juna,b,*( ), ZHANG Shubaoa, DUAN Zulianga
Received:2025-08-25
Revised:2026-01-14
Accepted:2026-03-04
Published:2026-04-30
Online:2026-03-17
Contact:
* E-mail address: leijun@ms.xjb.ac.cn (LEI Jun).
FAN Liqin, LEI Jun, ZHANG Shubao, DUAN Zuliang. Assessing spatial equity in employment opportunities in low-rent residential areas: Evidence from Urumqi, China[J]. Regional Sustainability, 2026, 7(2): 100333.
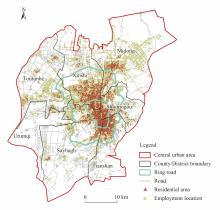
Fig. 1.
Overview of the central urban area of Urumqi. The figure is based on the standard map (GS(2024)0650) from the National Platform for Common Geospatial Information Services (https://cloudcenter.tianditu.gov.cn/) issued by the Ministry of Natural Resources of the People’s Republic of China, and the boundary of the standard map used in this study has not been modified."

Table 1
Data sources of this study."
| Data name | Data source | Number |
|---|---|---|
| Residential area | Scraped using Python 3.12.7 from Anjuke ( | 3465 |
| Point of interest (POI) | Scraped using Python 3.12.7 from Amap (Gaode; | 110,125 |
| Enterprise registry | Downloaded from the Qichacha website ( | 37,271 |
| Employment wage | Scraped using Python 3.12.7 from the BOSS Zhipin website ( | 17,640 |
| Road network | Downloaded from the OpenStreetMap website ( | / |
Table 2
Index system of the comprehensive index of employment equity space (CIEES)."
| Index name | AHP weight | VCW weight | Comprehensive weight |
|---|---|---|---|
| EIEOQ | 0.164 | 0.129 | 0.150 |
| EIEOAW | 0.539 | 0.716 | 0.610 |
| EIEOA | 0.297 | 0.155 | 0.240 |
Table 3
Variable selection and statistical description."
| Explanatory variable attribute | Variable name | Variable description | Mean |
|---|---|---|---|
| Architectural properties | Rent | Rent per unit area (CNY/(m2•month)) | 24.543 |
| Architectural age | 2024 minus the year the building was constructed (a) | 17.925 | |
| Population size | Number of households in the residential area | 707.443 | |
| Floor area ratio | Proportion of total building area to total land area (%) | 1.708 | |
| Environmental characteristics | Greening rate | Proportion of green space to total land area (%) | 0.282 |
| Property fee | Property management fee per unit area (CNY/(m2•month)) | 0.890 | |
| Locational characteristics | Medical facilities | Distance between residential area and nearest healthcare facility (m) | 350.971 |
| Recreation and entertainment | Distance between residential area and nearest shopping mall (m) | 874.848 | |
| Educational facilities | Distance between residential area and nearest educational facility (m) | 274.154 | |
| Transportation facilities | Distance between residential area and nearest bus stop or subway station (m) | 187.099 | |
| Industrial parks | Distance between residential area and nearest industrial park (m) | 1218.725 |
Table 4
Comparison of the Geographically Weighted Regression (GWR) and ordinary least squares (OLS) model results."
| Dependent variable | Model fit statistic | GWR | OLS |
|---|---|---|---|
| CIEES | R2 | 0.454 | 0.244 |
| Adjusted R2 | 0.407 | 0.241 | |
| AICc | -1918.264 | -1489.490 |

Fig. 2.
Distribution of low-rent residential areas in the central urban area of Urumqi. The figure is based on the standard map (GS(2024)0650) from the National Platform for Common Geospatial Information Services (https://cloudcenter.tianditu.gov.cn/) issued by the Ministry of Natural Resources of the People’s Republic of China, and the boundary of the standard map used in this study has not been modified."
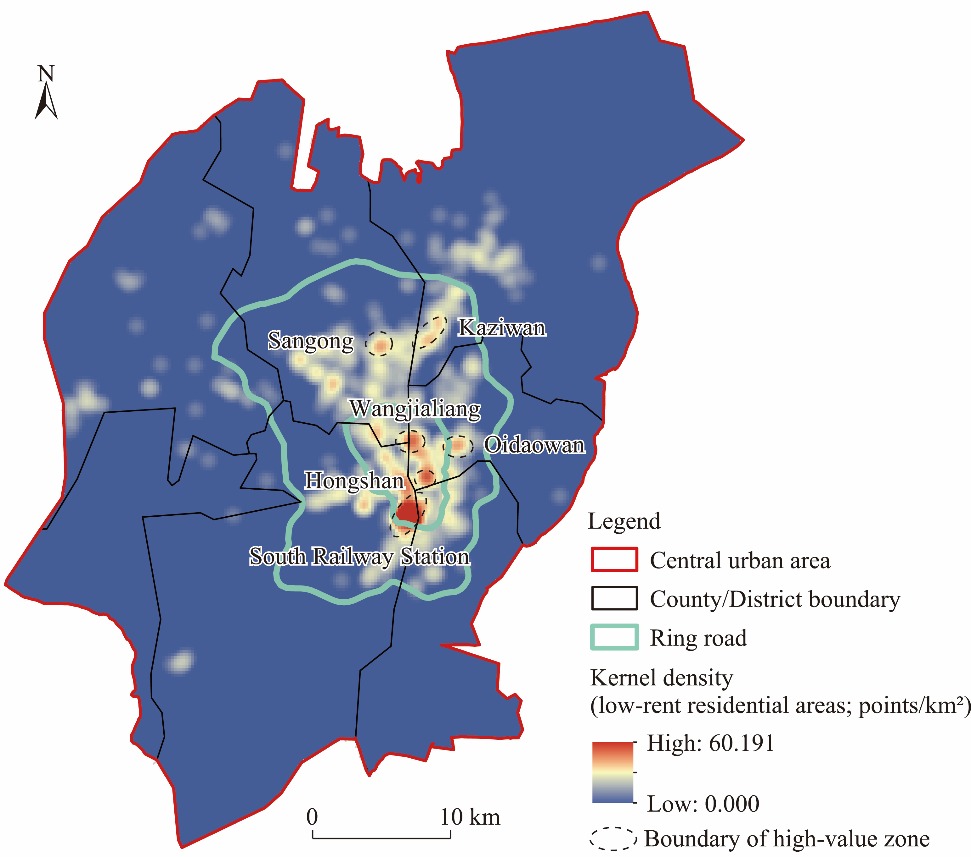
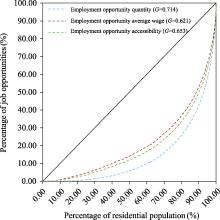
Fig. 3.
Lorenz curves of employment opportunity indices in the central urban area of Urumqi. G, Gini coefficient."
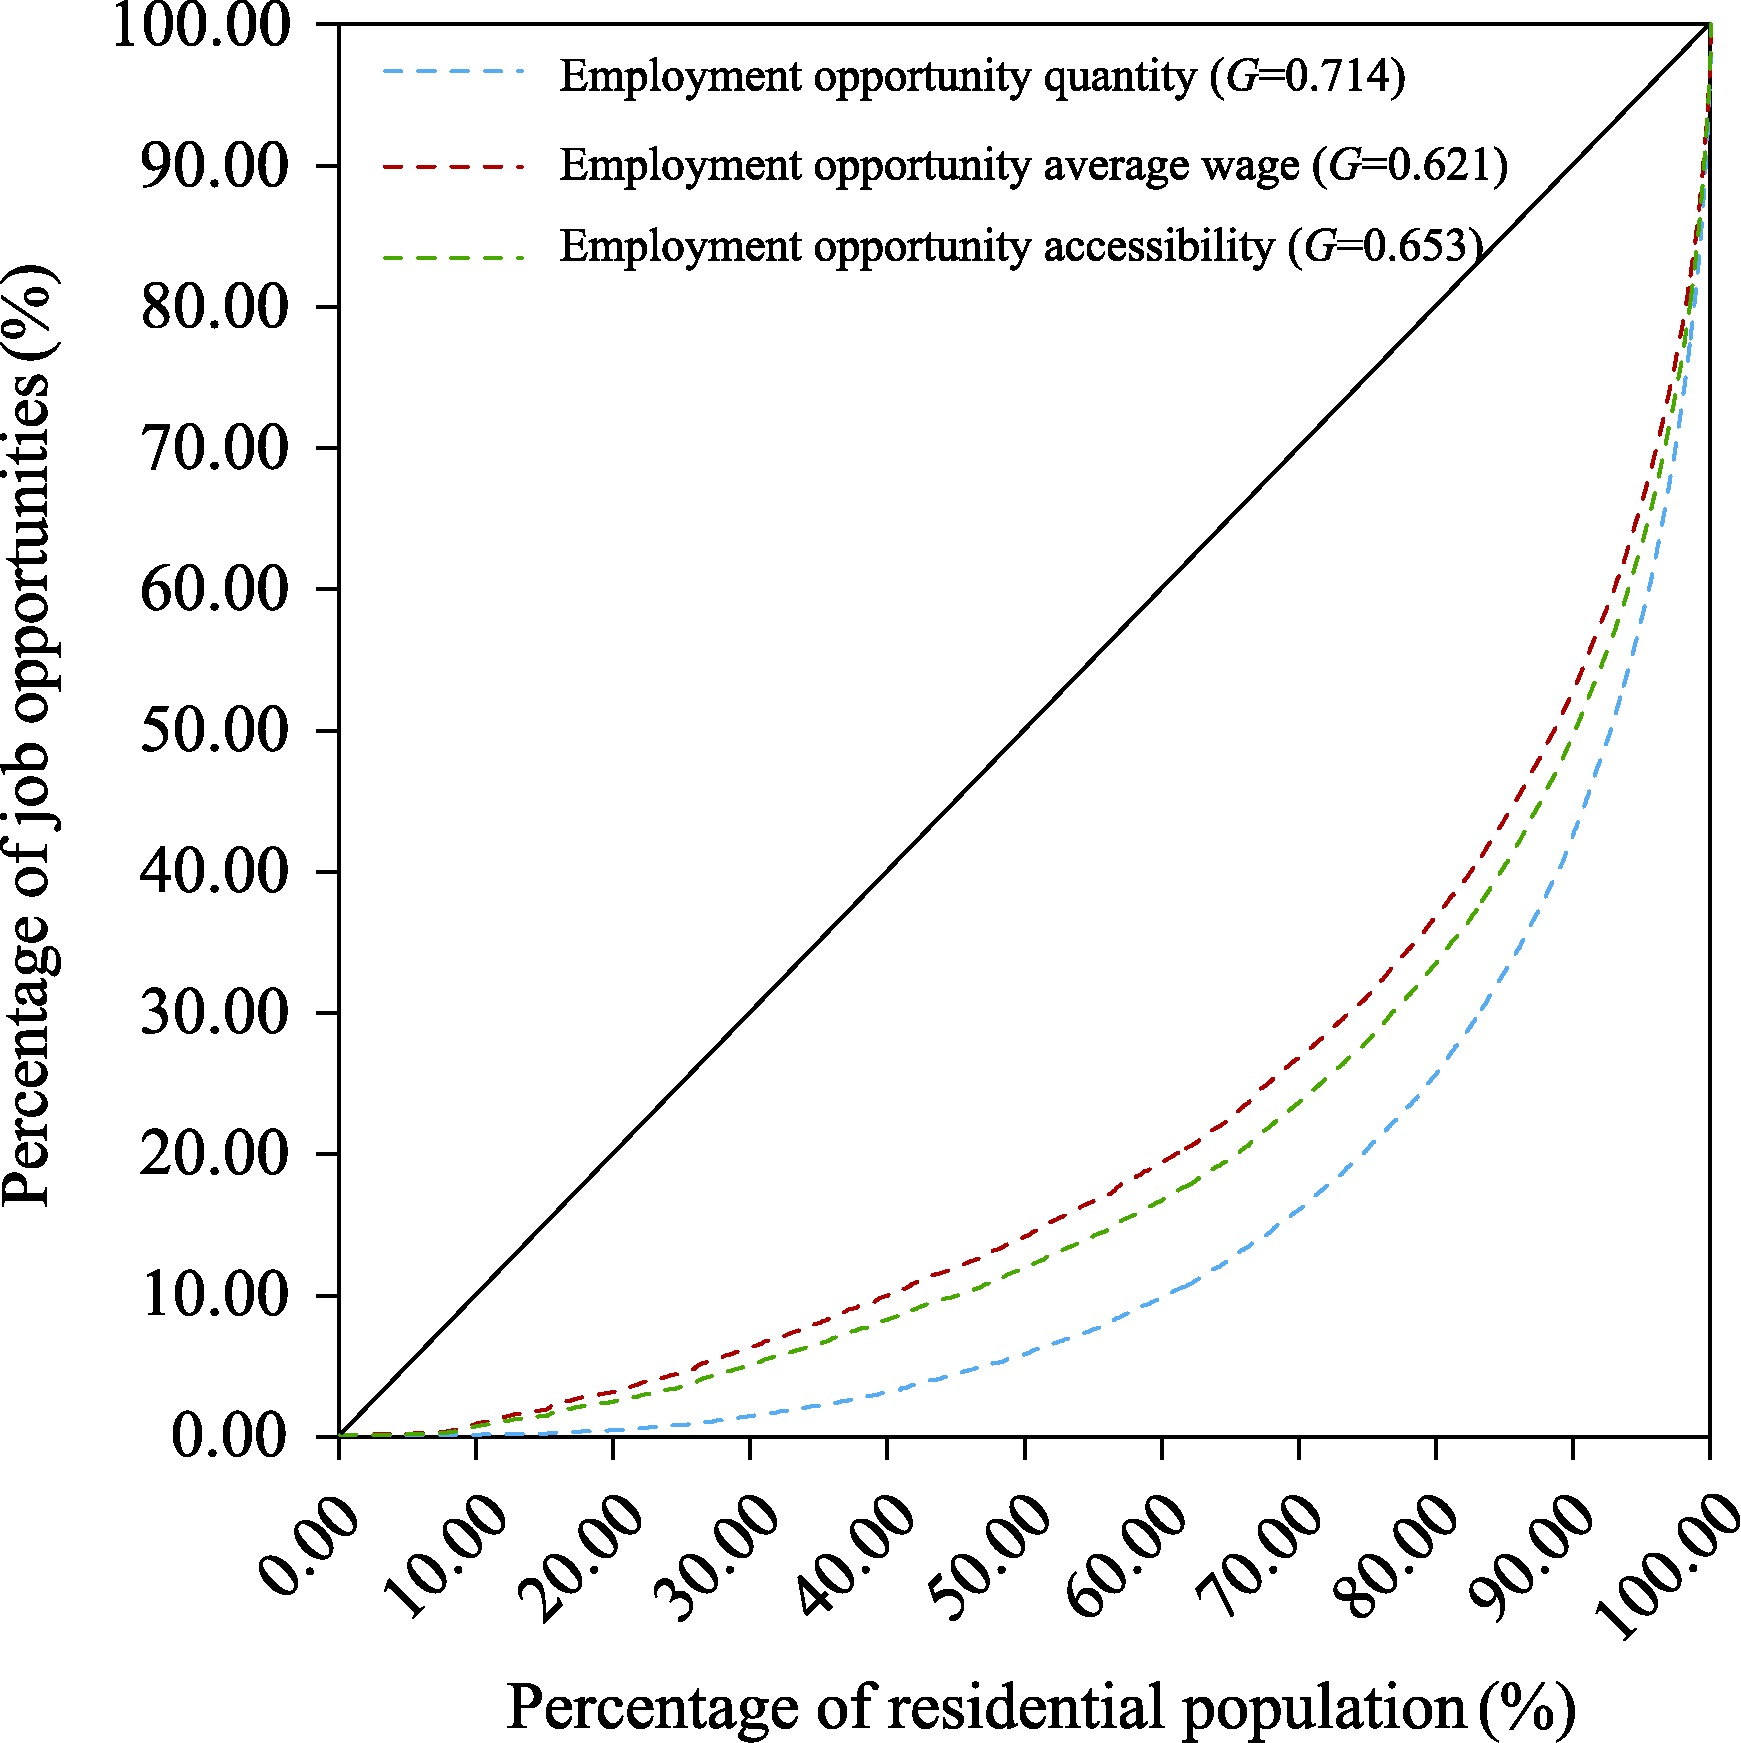
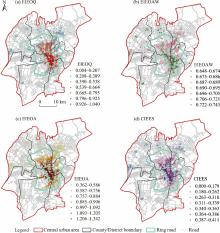
Fig. 4.
Distribution of employment spatial equity indices in low-rent residential areas in the central urban area of Urumqi. (a), equity index of employment opportunity quantity (EIEOQ); (b), equity index of employment opportunity average wage (EIEOAW); (c), equity index of employment opportunity accessibility (EIEOA); (d), comprehensive index of employment equity space (CIEES)."
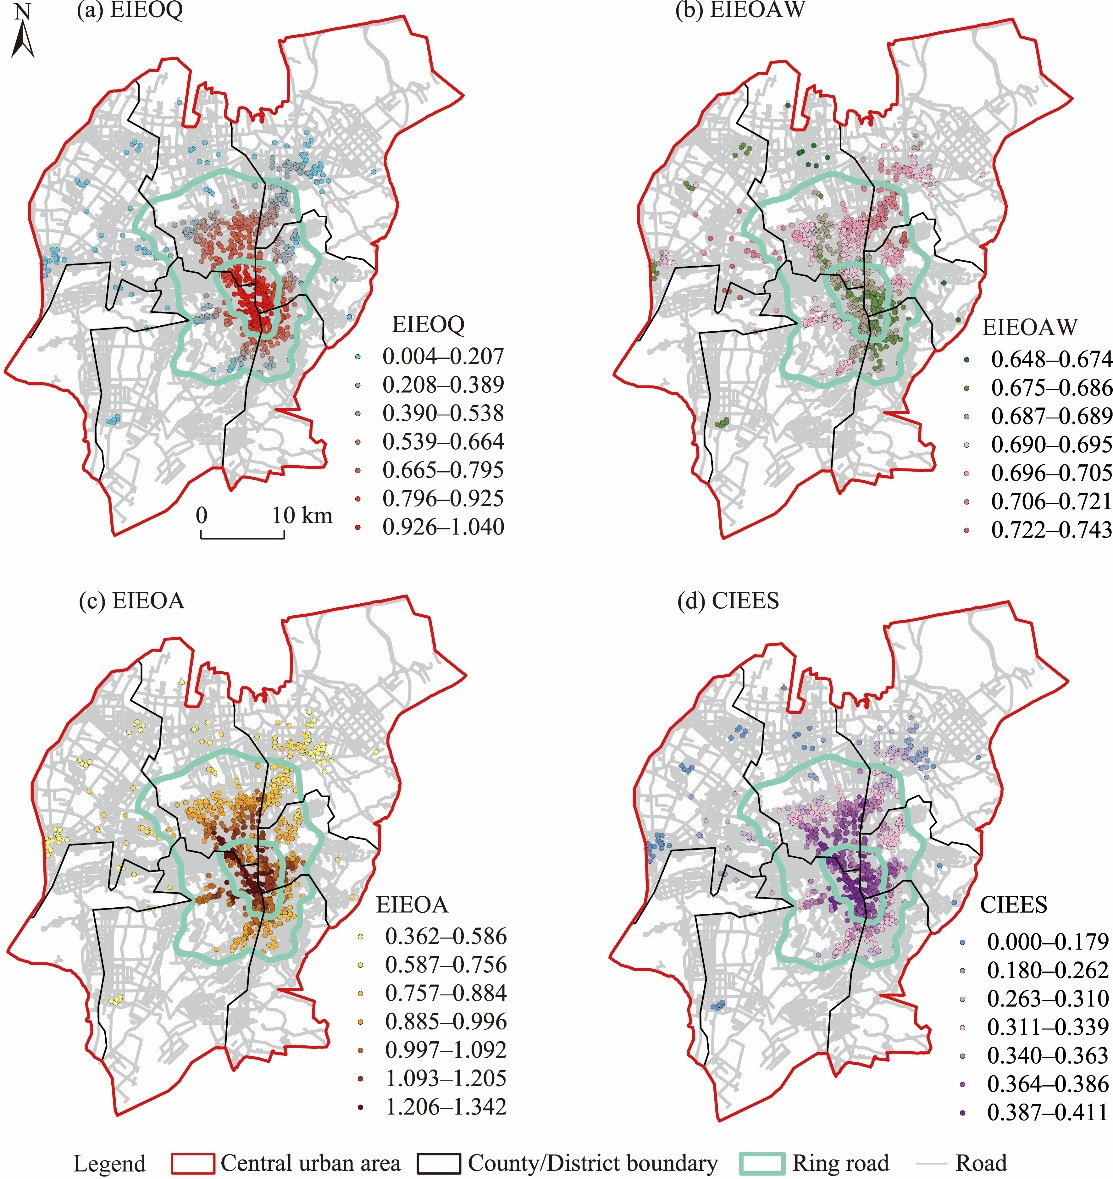
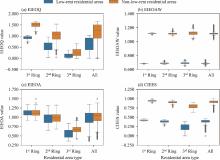
Fig. 5.
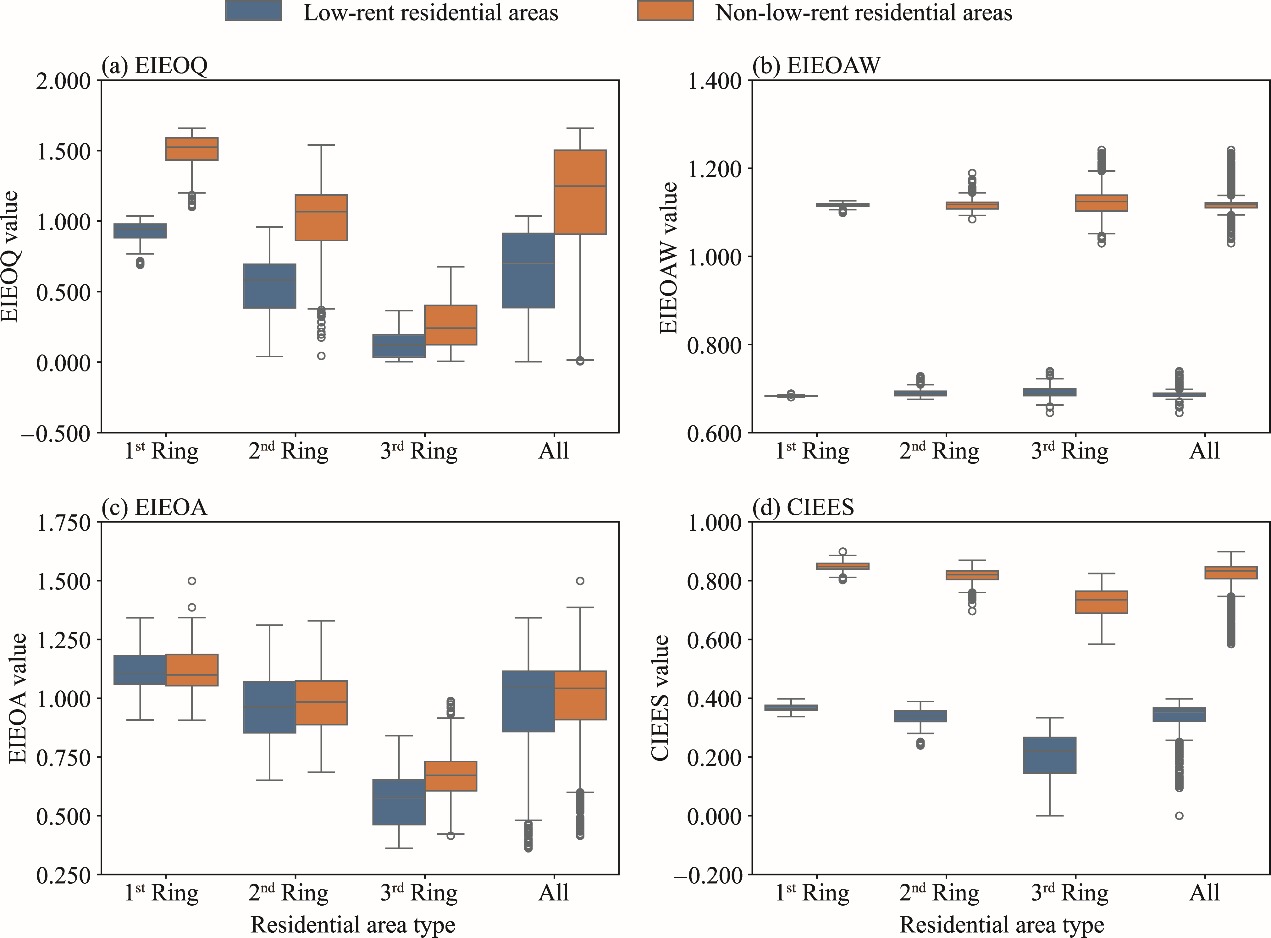
Employment spatial equity indices for low-rent residential areas and non-low-rent residential areas. (a), EIEOQ; (b), EIEOAW; (c), EIEOA; (d), CIEES. 1st Ring, the first ring core area; 2nd Ring, the second ring area; 3rd Ring, the third ring edge area. The median of all analysis points in each category is represented by a horizontal black line, with the 25th to 75th percentiles indicated by the box. The whiskers represent the minimum and maximum values within 1.5 times the interquartile range, while the points outside this range are considered outliers and are shown as individual markers. The box itself represents the interquartile range, and the whiskers extend to the minimum and maximum values that are not outliers."
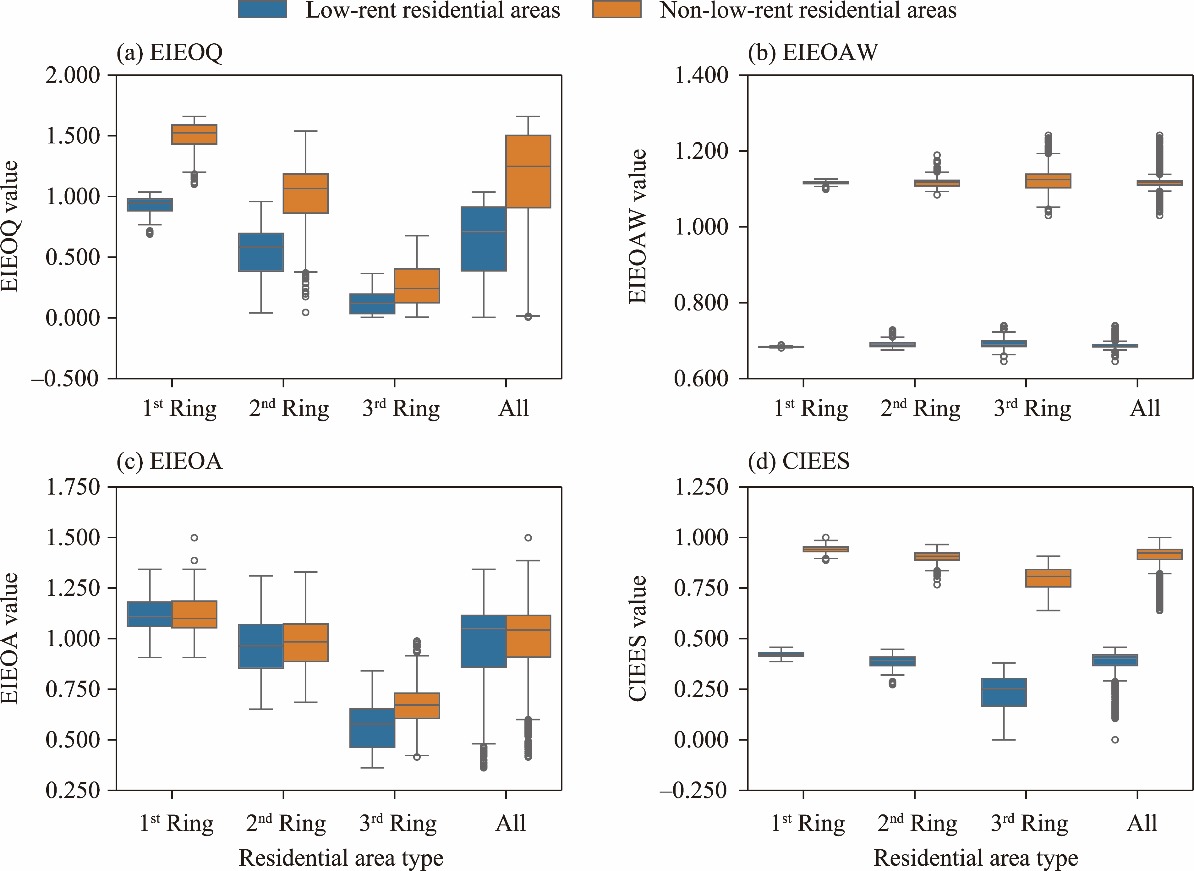
Table 5
GWR model results for CIEES and residential areas’ characteristics across ring areas and residential area types."
| Variable name | Low-rent residential areas | Non-low-rent residential areas | ||||||
|---|---|---|---|---|---|---|---|---|
| 1st Ring | 2nd Ring | 3rd Ring | All | 1st Ring | 2nd Ring | 3rd Ring | All | |
| Rent (CNY/(m2•month)) | 0.751 | 0.932 | 1.342 | 0.934 | 0.639 | 0.692 | 1.066 | 0.713 |
| Architectural age (a) | 0.078 | 0.011 | -0.144 | 0.010 | 0.058 | 0.026 | -0.106 | 0.024 |
| Population size | 1.274 | 0.970 | 0.210 | 0.955 | 1.424 | 0.884 | 0.329 | 1.048 |
| Floor area ratio (%) | 0.064 | 0.120 | 0.234 | 0.119 | 0.020 | 0.080 | 0.113 | 0.058 |
| Greening rate (%) | 0.100 | 0.130 | 0.105 | 0.117 | 0.088 | 0.116 | 0.101 | 0.102 |
| Property fee (CNY/( m2•month)) | 0.468 | 0.452 | -0.043 | 0.385 | 0.272 | 0.172 | 0.224 | 0.221 |
| Medical facilities (m) | 0.692 | -0.223 | -0.197 | 0.070 | 0.480 | -0.146 | -0.420 | 0.087 |
| Recreation and entertainment (m) | -0.054 | -0.390 | -0.342 | -0.277 | -0.151 | -0.313 | -0.400 | -0.254 |
| Educational facilities (m) | -0.448 | -0.095 | -0.116 | -0.210 | -0.438 | -0.184 | -0.009 | -0.271 |
| Transportation facilities (m) | -0.059 | -0.010 | 0.014 | -0.022 | 0.040 | -0.028 | -0.014 | 0.002 |
| Industrial parks (m) | -0.245 | -0.125 | 0.099 | -0.130 | -0.258 | -0.131 | 0.134 | -0.154 |
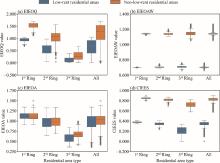
Fig. S1.
Box plots of the employment spatial equity indices for the low-rent residential areas under the baseline threshold and the +20.00% threshold scenario. (a), equity index of employment opportunity quantity (EIEOQ); (b), equity index of employment opportunity average wage (EIEOAW); (c), equity index of employment opportunity accessibility (EIEOA); (d), comprehensive index of employment equity space (CIEES). 1st Ring, the first ring core area; 2nd Ring, the second ring area; 3rd Ring, the third ring edge area. The median of all analysis points in each category is represented by a horizontal black line, with the 25th to 75th percentiles indicated by the box. The whiskers represent the minimum and maximum values within 1.5 times the interquartile range, while the points outside this range are considered outliers and are shown as individual markers. The box itself represents the interquartile range, and the whiskers extend to the minimum and maximum values that are not outliers."
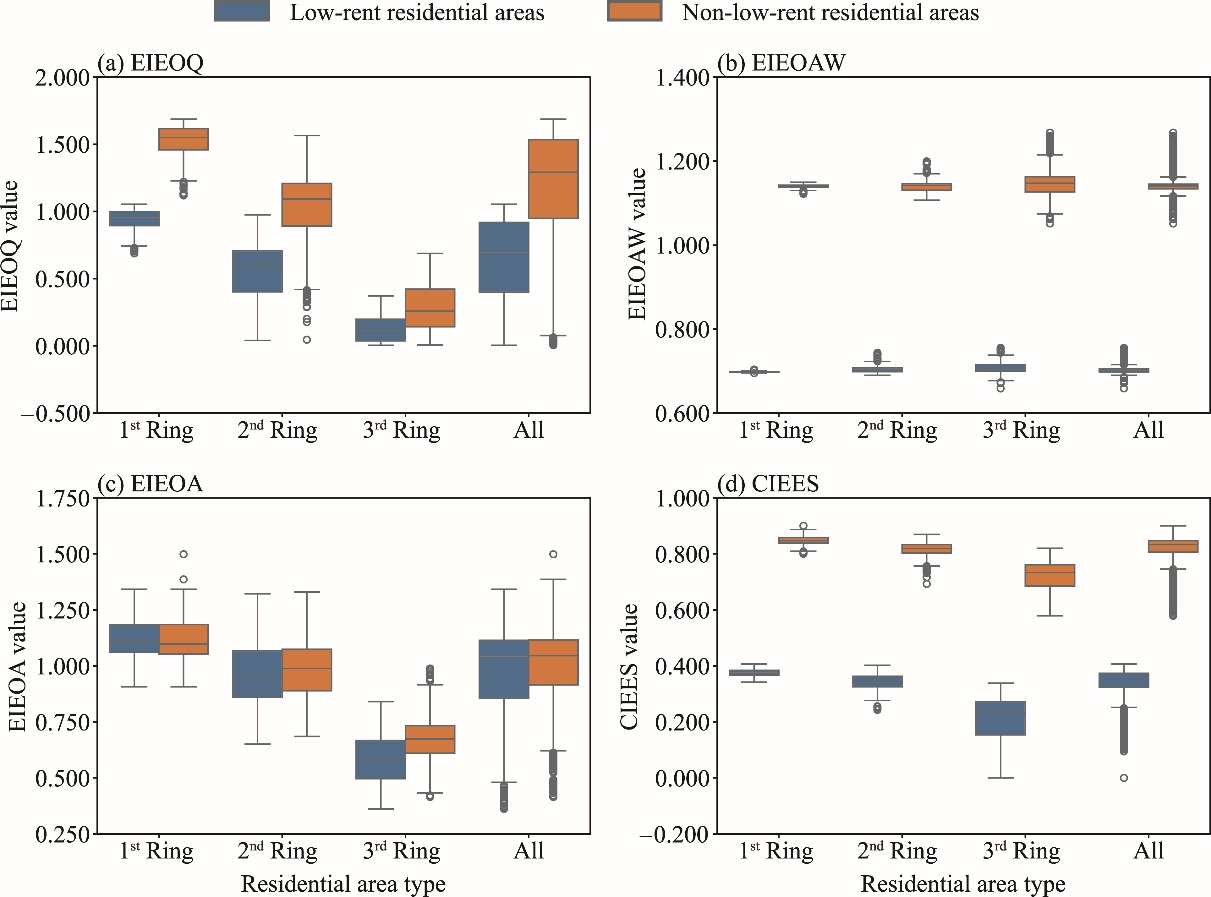
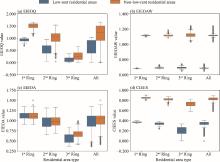
Fig. S2.
Sensitivity test of the employment spatial equity indices for the low-rent residential areas under an alternative weighting scheme (subjective: objective=1:1). (a), EIEOQ; (b), EIEOAW; (c), EIEOA; (d), CIEES. The median of all analysis points in each category is represented by a horizontal black line, with the 25th to 75th percentiles indicated by the box. The whiskers represent the minimum and maximum values within 1.5 times the interquartile range, while the points outside this range are considered outliers and are shown as individual markers. The box itself represents the interquartile range, and the whiskers extend to the minimum and maximum values that are not outliers."
| [1] |
Allen J., Farber S., 2020. Suburbanization of transport poverty. Annals of the American Association of Geographers. 111(6), 1833-1850.
doi: 10.1080/24694452.2020.1859981 |
| [2] |
Ashik F.R., Mim S.A., Neema M.N., 2020. Towards vertical spatial equity of urban facilities: An integration of spatial and aspatial accessibility. Journal of Urban Management. 9(1), 77-92.
doi: 10.1016/j.jum.2019.11.004 |
| [3] |
Bangura M., Lee C.L., 2023. The determinants of homeownership affordability in Greater Sydney: Evidence from a submarket analysis. Housing Studies. 38(2), 206-232.
doi: 10.1080/02673037.2021.1879995 |
| [4] | Bastiaanssen J., Johnson D., Lucas K., 2025. The relationship between individual employment probabilities and accessibility to matching jobs: A study of the Netherlands. Transportation Research Part A: Policy and Practice. 193, 104398, doi: 10.1016/j.tra.2025.104398. |
| [5] |
Benner C., Karner A., 2016. Low-wage jobs-housing fit: identifying locations of affordable housing shortages. Urban Geography. 37(6), 883-903.
doi: 10.1080/02723638.2015.1112565 |
| [6] | Benra F., Nahuelhual L., 2019. A trilogy of inequalities: Land ownership, forest cover and ecosystem services distribution. Land Use Policy. 82, 247-257. |
| [7] |
Blumenberg E., King H., 2021. Jobs-housing balance re-re-visited. Journal of the American Planning Association. 87(4), 484-496.
doi: 10.1080/01944363.2021.1880961 |
| [8] |
Brunsdon C., Fotheringham A.S., Charlton M.E., 1996. Geographically weighted regression: A method for exploring spatial nonstationarity. Geographical Analysis. 28(4), 281-298.
doi: 10.1111/gean.1996.28.issue-4 |
| [9] | Burzynski M., Deuster C., Docquier F., 2020. Geography of skills and global inequality. Journal of Development Economics. 142, 102333, doi: 10.1016/j.jdeveco.2019.02.003. |
| [10] | Calvert T., Crawford F., Parkhurst G., et al., 2022. Perceived accessibility of employment sites by jobseekers and the potential relevance of employer-subsidised demand responsive transport to enhance the commute. Cities. 130, 103872, doi: 10.1016/j.cities.2022.103872. |
| [11] | Cellmer R., Cichulska A., Belej M., 2020. Spatial analysis of housing prices and market activity with the geographically weighted regression. Isprs International Journal of Geo-Information. 9(6), 380, doi: 10.3390/ijgi9060380. |
| [12] |
Chen B.Y., Wang Y.F., Wang D.G., et al., 2018. Understanding the impacts of human mobility on accessibility using massive mobile phone tracking data. Annals of the American Association of Geographers. 108(4), 1115-1133.
doi: 10.1080/24694452.2017.1411244 |
| [13] | Chen Y.J., Lin N., Wu Y.Y., et al., 2021. Spatial equity in the layout of urban public sports facilities in Hangzhou. PloS ONE. 16(9), e0256174, doi: 10.1371/journal.pone.0256174. |
| [14] | Cui B., Boisjoly G., Miranda-Moreno L., et al., 2020. Accessibility matters: Exploring the determinants of public transport mode share across income groups in Canadian cities. Transportation Research Part D-Transport and Environment. 80, 102276, doi: 10.1016/j.trd.2020.102276. |
| [15] |
Fainstein S.S., 2014. The just city. International Journal of Urban Sciences. 18(1), 1-18.
doi: 10.1080/12265934.2013.834643 |
| [16] | Fan Y.L., Allen R., Sun T., 2014. Spatial mismatch in Beijing, China: Implications of job accessibility for Chinese low-wage workers. Habitat International. 44, 202-210. |
| [17] | Fol S., Gallez C., 2014. Social inequalities in urban access: Better ways of assessing transport improvements. Urban Access for the 21st Century. 46-86. |
| [18] | Fotheringham A.S., Brunsdon C., Charlton M., 2009. Geographically weighted regression. Journal of the Royal Statistical Society Series D (The Statistician). 1, 243-254. |
| [19] | Galster G., Sharkey P., 2017. Spatial foundations of inequality: a conceptual model and empirical overview. RSF: The Russell Sage Foundation Journal of the Social Sciences. 3(2), 1-33. |
| [20] | Guzman L.A., Oviedo D., Rivera C., 2017. Assessing equity in transport accessibility to work and study: The Bogotá region. Journal of Transport Geography. 58, 236-246. |
| [21] |
Han H.R., Yang C.F., Wang E.R., et al., 2015. Evolution of jobs-housing spatial relationship in Beijing Metropolitan Area: A job accessibility perspective. Chinese Geographical Science. 25(3), 375-388.
doi: 10.1007/s11769-015-0738-1 |
| [22] | Hernandez D., 2018. Uneven mobilities, uneven opportunities: Social distribution of public transport accessibility to jobs and education in Montevideo. Journal of Transport Geography. 67, 119-125. |
| [23] |
Hess D.B., 2005. Access to employment for adults in poverty in the Buffalo-Niagara region. Urban Studies. 42(7), 1177-1200.
doi: 10.1080/00420980500121384 |
| [24] | Hou X.Y., Wu G.S., Wang S.Y., et al., 2016. Spatial characters of jobs location and impacts on income of Residents in urban affordable housing of kunming. Human Geography. 31(4), 50-57 (in Chinese). |
| [25] | Hu L.Q., 2017. Job accessibility and employment outcomes: which income groups benefit the most? Transportation. 44, 1421-1443. |
| [26] | Hui E.C.M., Zhong J.W., Yu K., 2015. Housing policy, work-residence mismatch and poverty concentration. Habitat International. 48, 198-208. |
| [27] |
Kain J.F., 1968. Housing segregation, negro employment, and metropolitan decentralization. The Quarterly Journal of Economics. 82(2), 175-197.
doi: 10.2307/1885893 |
| [28] |
Kain J.F., 2004. A pioneer’s perspective on the spatial mismatch literature. Urban Studies. 41(1), 7-32.
doi: 10.1080/0042098032000155669 |
| [29] | Kaiser Z.R.M.A., Deb A., 2025. Sustainable smart city and Sustainable Development Goals (SDGs): A review. Regional Sustainability. 6(1), 100193, doi: 10.1016/j.regsus.2025.100193. |
| [30] | Kelobonye K., McCarney G., Xia J., et al., 2019. Relative accessibility analysis for key land uses: A spatial equity perspective. Journal of Transport Geography. 75, 82-93. |
| [31] |
Korsu E., Wenglenski S., 2010. Job accessibility, residential segregation and risk of long-term unemployment in the Paris region. Urban Studies. 47(11), 2279-2324.
pmid: 20845591 |
| [32] | Leung K.M., Choy L.H.T., 2025. The impacts of public transportation development on gentrification and poverty in Hong Kong neighbourhoods (2006-2021). Cities. 157, 105467. doi: 10.1016/j.cities.2024.105467. |
| [33] | Li H., Wei Y.D., Wu Y.Y., 2019. Analyzing the private rental housing market in Shanghai with open data. Land Use Policy. 85, 271-284. |
| [34] |
Li N., Wang J.Y., Wang H.Y., et al., 2021. Impacts of land use change on ecosystem service value in Lijiang River Basin, China. Environmental Science and Pollution Research. 28(34), 46100-46115.
doi: 10.1007/s11356-020-12190-0 |
| [35] | Li S.M., Liu Y., 2016. The jobs-housing relationship and commuting in Guangzhou, China: Hukou and dual structure. Journal of Transport Geography. 54, 286-294. |
| [36] | Li X.G., Qiu D.C., Li F., et al., 2013. Matching analysis of the job and residence space of residents in the public rental housing community in Chongqing. Geographical Research. 32(8), 1457-1466 (in Chinese). |
| [37] | Litman T., 2022. Evaluating transportation equity: Guidance for incorporating distributional impacts in transportation planning. Ite Journal-Institute of Transportation Engineers. 92(4), 43-49. |
| [38] |
Liu L., Huang Y.Q., Zhang W.H., 2018. Residential segregation and perceptions of social integration in Shanghai, China. Urban Studies. 55(7), 1484-1503.
doi: 10.1177/0042098016689012 |
| [39] | Lucas K., 2012. Transport and social exclusion: Where are we now? Transport Policy. 20, 105-113. |
| [40] | Lu B., Zhang C., Chen T.M., 2013. Study on changes in job accessibility for the urban low-income: a case study of Beijing. City Planning Review. 37(1), 56-63 (in Chinese). |
| [41] |
Ma H.T., Sun Z., Fang C.L., 2020. Risk assessment of transnational oil investment in Central Asia using a fuzzy comprehensive evaluation method. Regional Sustainability. 1(1), 11-19.
doi: 10.1016/j.regsus.2020.06.002 |
| [42] | Mohri S.S., Mortazavi S., Nassir N., 2021. A clustering method for measuring accessibility and equity in public transportation service: Case study of Melbourne. Sustainable Cities and Society. 74, 103241, doi: 10.1016/j.scs.2021.103241. |
| [43] | Nakamura S., Avner P., 2021. Spatial distributions of job accessibility, housing rents, and poverty: The case of Nairobi. Journal of Housing Economics. 51, 101743, doi: 10.1016/j.jhe.2020.101743. |
| [44] | Nussbaum M.C., 2009. Creating capabilities: The human development approach and its implementation. Hypatia. 24(3), 211-215. |
| [45] | Pan Q.S., Jin Z.H., Liu X.J., 2020. Measuring the effects of job competition and matching on employment accessibility. Transportation Research Part D: Transport and Environment. 87, 102535, doi: 10.1016/j.trd.2020.102535. |
| [46] |
Rad T.G., Alimohammadi A., 2024. A user-based approach for assessing spatial equity of attractiveness and accessibility to alternative urban parks. Geo-Spatial Information Science. 27(2), 487-504.
doi: 10.1080/10095020.2022.2135463 |
| [47] | Ricciardi A.M., Xia J., Currie G., 2015. Exploring public transport equity between separate disadvantaged cohorts: a case study in Perth, Australia. Journal of Transport Geography. 43, 111-122. |
| [48] | Scheffer M., van Bavel B., van de Leemput I.A., et al., 2017. Inequality in nature and society. Proceedings of the National Academy of Sciences of the United States of America. 114(50), 13154-13157. |
| [49] | Sharifiasl S., Kharel S., Pan Q., 2023. Incorporating job competition and matching to an indicator-based transportation equity analysis for auto and transit in dallas-fort worth area. Transportation Research Record. 2677(12), 240-254. |
| [50] | Sharma G., Patil G.R., 2024. Urban spatial structure and equity for urban services through the lens of accessibility. Transport Policy. 146, 72-90. |
| [51] | Sisman S., Aydinoglu A.C., 2022. A modelling approach with geographically weighted regression methods for determining geographic variation and influencing factors in housing price: A case in Istanbul. Land Use Policy. 119, 106183, doi: 10.1016/j.landusepol.2022.106183. |
| [52] | Slovic A.D., Tomasiello D.B., Giannotti M., et al., 2019. The long road to achieving equity: Job accessibility restrictions and overlapping inequalities in the city of Sao Paulo. Journal of Transport Geography. 78, 181-193. |
| [53] | Smith D.A., Shen Y., Barros J., et al., 2020. A compact city for the wealthy? Employment accessibility inequalities between occupational classes in the London metropolitan region 2011. Journal of Transport Geography. 86, 102767, doi: 10.1016/j.jtrangeo.2020.102767. |
| [54] | Tao S., He S.Y., Luo S.L., 2020. The influence of job accessibility on local residential segregation of ethnic minorities: A study of Hong Kong. Population, Space and Place. 26(8), e2353, doi: 10.1002/psp.2353. |
| [55] |
Tsou K.W., Hung Y.T., Chang Y.L., 2005. An accessibility-based integrated measure of relative spatial equity in urban public facilities. Cities. 22(6), 424-435.
doi: 10.1016/j.cities.2005.07.004 |
| [56] |
Turok I., Borel-Saladin J., 2018. The theory and reality of urban slums: Pathways-out-of-poverty or cul-de-sacs? Urban Studies. 55(4), 767-789.
doi: 10.1177/0042098016671109 |
| [57] | Van Ham M., Tammaru T., Ubarevičienė R., et al., 2021. Urban Socio-Economic Segregation and Income Inequality:A Global Perspective. Cham: Springer Nature. |
| [58] | Wang H., Kwan M.P., Hu M., 2020. Social exclusion and accessibility among low- and non-low-income groups: A case study of Nanjing, China. Cities. 101, 102684. doi: 10.1016/j.cities.2020.102684. |
| [59] | Wang J.X., Xu C., Pauleit S., et al., 2019. Spatial patterns of urban green infrastructure for equity: A novel exploration. Journal of Cleaner Production. 238, 117858, doi: 10.1016/j.jclepro.2019.117858. |
| [60] | Wu W.P., Wang G.X., 2021. Shifting residential and employment geography: Shanghai’s bifurcated trajectory of spatial restructuring. Cities. 113, 103142, doi: 10.1016/j.cities.2021.103142. |
| [61] | Xiao W.Y., Wei Y.D., Li H., 2021. Spatial inequality of job accessibility in Shanghai: A geographical skills mismatch perspective. Habitat International. 115, 102401, doi: 10.1016/j.habitatint.2021.102401. |
| [62] | Xie Z.M., Zhen F., Zhang S.Q., 2021. Research on spatial characteristics and influencing factors of urban employment based on big data. Urban Studies. 28(10), 48-57 (in Chinese). |
| [63] | Yao Z.Y., Kim C., 2022. Analyzing the multiscale patterns of jobs-housing balance and employment self-containment by different income groups using LEHD data: A case study in Cincinnati metropolitan area. Computers, Environment and Urban Systems. 96, 101851, doi: 10.1016/j.compenvurbsys.2022.101851. |
| [64] | Yu P.H., Chen Y.Y., Xu Q.Y., et al., 2022. Embedding of spatial equity in a rapidly urbanising area: Walkability and air pollution exposure. Cities. 131, 103942, doi: 10.1016/j.cities.2022.103942. |
| [65] |
Zhang C., Cheng Z.H., Yu X.P., et al., 2020. Impact of public transportation infrastructure on employment of the low-income group in Urumqi. Progress in Geography. 39(1), 111-119 (in Chinese).
doi: 10.18306/dlkxjz.2020.01.011 |
| [66] | Zhang D.L., Ma S., Fan J.H., et al., 2023. Assessing spatial equity in urban park accessibility: an improve two-step catchment area method from the perspective of 15-mintue city concept. Sustainable Cities and Society. 98, 104824, doi: 10.1016/j.scs.2023.104824. |
| [67] | Zhang M.Z., He S.J., Zhao P.J., 2018. Revisiting inequalities in the commuting burden: Institutional constraints and job-housing relationships in Beijing. Journal of Transport Geography. 71, 58-71. |
| [68] | Zhang S.B., Lei J., Zhang X.L., et al., 2024. Assessment and optimization of urban spatial resilience from the perspective of life circle: A case study of Urumqi, NW China. Sustainable Cities and Society. 109, 105527, doi: 10.1016/j.scs.2024.105527. |
| [69] | Zhang Y.Z., Luo F.B., Dai Y.Z., et al., 2025. Changing spatial inclusion of migrants in Chinese cities: How housing matters. Habitat International. 157, 103319, doi: 10.1016/j.habitatint.2025.103319. |
| [70] | Zhou S.H., Chen L.P., Wu Z.D., 2010. The jobs-housing relocation and spatial matching of residents in alleviatory housing neighborhoods in Guangzhou. Geographical Research. 29(10), 1735-1745 (in Chinese). |
| [71] |
Zhou S.H., Wu Z.D., Cheng L.P., 2013. The impact of spatial mismatch on residents in low-income housing neighbourhoods: A study of the Guangzhou metropolis, China. Urban Studies. 50(9), 1817-1835.
doi: 10.1177/0042098012465906 |
| [72] | Zhu L., Shi F., 2022. Spatial and social inequalities of job accessibility in Kunshan city, China: Application of the Amap API and mobile phone signaling data. Journal of Transport Geography. 104, 103451, doi: 10.1016/j.jtrangeo.2022.103451. |
| [73] | Zou X., Ma X., Shi X.P., 2021. How does affordable housing supply affect commercial housing prices: Crowd out supply or divert demand? Journal of Finance and Economics. 47(11), 49-63 (in Chinese). |
| No related articles found! |
| Viewed | ||||||
|
Full text |
|
|||||
|
Abstract |
|
|||||
 REGSUS Wechat
 新公网安备 65010402001202号