Regional Sustainability ›› 2021, Vol. 2 ›› Issue (3): 211-223.doi: 10.1016/j.regsus.2021.10.001cstr: 32279.14.j.regsus.2021.10.001
• Full Length Article • Previous Articles Next Articles
HU Xiwua,b, SU Yunqinga, REN Kefengc, SONG Fanga,*( ), XUE Ruixianga
Received:2021-03-24
Revised:2021-10-24
Accepted:2021-10-24
Published:2021-07-30
Online:2021-12-24
Contact:
SONG Fang
E-mail:fangsong@tju.edu.cn
HU Xiwu, SU Yunqing, REN Kefeng, SONG Fang, XUE Ruixiang. Measurement and influencing factors of urban traffic ecological resilience in developing countries: A case study of 31 Chinese cities[J]. Regional Sustainability, 2021, 2(3): 211-223.
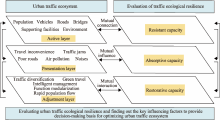
Fig. 1.
Urban traffic ecosystem and traffic ecological resilience evaluation diagram."

Table 1
Descriptions of variables used in this study."
| Variable | Variable meaning | Variable measurement | Variable type | Data source |
|---|---|---|---|---|
| TERESit | Traffic ecological resilience level | Urban traffic ecological resilience value of city i in year t | Dependent | Calculation |
| Financit | Governance capability | Per capita fiscal revenue of city i in year t (10,000 CNY) | Independent | China Statistical Yearbook ( |
| Consumit | Market activity | Total retail sales per capita of city i in year t (10,000 CNY) | Independent | China Statistical Yearbook ( |
| Patentit | Technological innovation capability | Number of patents granted of city i in year t (piece) | Independent | China Statistical Yearbook ( |
| Ftradeit | Opening degree | Per capita total import and export trade of city i in year t (USD) | Independent | China Statistical Yearbook ( |
| Deposiit | Financial resource | Proportion of deposits of financial institutions to GDP in city i in year t (%) | Independent | China Statistical Yearbook ( |
Table 2
Evaluation index system of traffic ecological resilience."
| Target layer | Criterion layer | Index layer | Index meaning | Comprehensive weight | Type | Index direction |
|---|---|---|---|---|---|---|
| Traffic ecological resilience | Resistant capacity (A) | Population density in the main urban area (A1) | Reflecting the population’s traffic pressure | 0.076 | Population/Society | - |
| Density of civil vehicles in the main urban area (A2) | Reflecting the traffic pressure of cars | 0.072 | Vehicle/Economy | - | ||
| Passenger traffic (A3) | Reflecting the traffic shock of people flow | 0.097 | Vehicle/Economy | - | ||
| Freight volume (A4) | Reflecting the traffic shock of logistics | 0.038 | Vehicle/Economy | |||
| Average traffic volume (A5) | Reflecting the traffic shock of traffic flow | 0.079 | Vehicle/Economy | - | ||
| Motor vehicle exhaust and particulate matter emissions (A6) | Reflecting the ecological destructive power of motor vehicle emissions | 0.046 | Air/Ecology | - | ||
| Industrial waste gas and dust emissions (A7) | Reflecting the ecological destructive power of industrial production emissions | 0.027 | Air/Ecology | - | ||
| Domestic waste gas and dust emissions (A8) | Reflecting the ecological destructive power of residents’ life emissions | 0.018 | Air/Ecology | - | ||
| Comprehensive air quality index (A9) | Reflecting the degree of air pollution | 0.051 | Air/Ecology | - | ||
| Road traffic equivalent sound level (A10) | Reflecting the degree of noise pollution | 0.011 | Environment/Ecology | - | ||
| Absorptive capacity (B) | Per capita road area (B1) | Reflecting the resource allocation power of the road network | 0.026 | Road/Engineering | + | |
| Road network density in built-up area (B2) | Reflecting the traffic supply capacity of the road network | 0.037 | Road/Engineering | + | ||
| Per capita rail transit mileage (B3) | Reflecting the evacuation force of rapid traffic passenger flow | 0.031 | Road/Engineering | + | ||
| Number of bridges per kilometer of municipal roads (B4) | Reflecting the bridge’s traffic support | 0.028 | Bridge/Engineering | + | ||
| Per capita sidewalk area (B5) | Reflecting the capacity of slow traffic | 0.017 | Road/Engineering | + | ||
| Green coverage rate in built-up area (B6) | Reflecting ecological self-purification | 0.009 | Green space/Ecology | + | ||
| Proportion of days with good air (B7) | Reflecting the ecological tolerance of air | 0.017 | Air/Ecology | + | ||
| Average annual rainfall (B8) | Reflecting the ecological protection of rainfall | 0.025 | Climate/Ecology | + | ||
| Average daily wind speed (B9) | Reflecting the air purification power of wind speed | 0.012 | Climate/Ecology | + | ||
| Proportion of road cleaning and cleaning area (B10) | Reflecting managed service response | 0.010 | Road/Society | + | ||
| Restorative capacity (C) | Air transport passenger flow growth (C1) | Reflecting the potential conveying capacity of air transportation | 0.100 | Vehicle/Economy | + | |
| Increase in passenger traffic by train (C2) | Reflecting the potential transmission capacity of train transportation | 0.039 | Vehicle/Economy | + | ||
| Increase in bus operating mileage (C3) | Reflecting the potential transport capacity of public transportation | 0.017 | Vehicle/Economy | + | ||
| Increase in the number of private cars (C4) | Reflecting the potential delivery power of personalized traffic | 0.014 | Vehicle/Economy | + | ||
| Urban infrastructure investment growth rate (C5) | Reflecting the potential support of supporting facilities | 0.023 | Supporting/Economy | + | ||
| Increase in investment of waste gas treatment (C6) | Reflecting the potential improvement of air governance | 0.020 | Air/Engineering | + | ||
| Increase in investment of landscaping (C7) | Reflecting the potential lifting power of air improvement | 0.014 | Green space /Engineering | + | ||
| Increase in added value of the tertiary industry (C8) | Reflecting the potential lifting power of industrial structure optimization | 0.022 | Ecology/Economy | + | ||
| Increase in fiscal revenue (C9) | Reflecting the potential improvement of government governance | 0.012 | Management /Economy | + | ||
| Increase in the number of social organization units (C10) | Reflecting the potential promotion power of social participation | 0.012 | Management/Society | + |
Table 3
Urban traffic ecological resilience in 31 Chinese cities from 2011 to 2018."
| City | Urban traffic ecological resilience | |||||||||
|---|---|---|---|---|---|---|---|---|---|---|
| 2011 | 2012 | 2013 | 2014 | 2015 | 2016 | 2017 | 2018 | Mean value | Changing rate | |
| Beijing | 0.353 | 0.340 | 0.376 | 0.386 | 0.405 | 0.449 | 0.458 | 0.487 | 0.407 | 0.380 |
| Tianjin | 0.575 | 0.582 | 0.286 | 0.276 | 0.263 | 0.318 | 0.295 | 0.256 | 0.356 | -0.555 |
| Shijiazhuang | 0.514 | 0.410 | 0.194 | 0.213 | 0.231 | 0.263 | 0.254 | 0.264 | 0.293 | -0.486 |
| Taiyuan | 0.523 | 0.483 | 0.241 | 0.230 | 0.244 | 0.327 | 0.291 | 0.333 | 0.334 | -0.363 |
| Hohhot | 0.531 | 0.517 | 0.264 | 0.281 | 0.269 | 0.304 | 0.258 | 0.284 | 0.339 | -0.465 |
| Shenyang | 0.499 | 0.477 | 0.252 | 0.236 | 0.265 | 0.301 | 0.288 | 0.323 | 0.330 | -0.353 |
| Changchun | 0.567 | 0.514 | 0.285 | 0.276 | 0.272 | 0.358 | 0.335 | 0.351 | 0.370 | -0.381 |
| Harbin | 0.493 | 0.474 | 0.238 | 0.244 | 0.236 | 0.293 | 0.256 | 0.308 | 0.318 | -0.375 |
| Shanghai | 0.489 | 0.438 | 0.250 | 0.270 | 0.266 | 0.314 | 0.297 | 0.297 | 0.328 | -0.393 |
| Nanjing | 0.605 | 0.572 | 0.338 | 0.321 | 0.353 | 0.375 | 0.376 | 0.371 | 0.414 | -0.387 |
| Hangzhou | 0.529 | 0.517 | 0.300 | 0.305 | 0.308 | 0.379 | 0.361 | 0.369 | 0.384 | -0.302 |
| Hefei | 0.644 | 0.573 | 0.308 | 0.309 | 0.331 | 0.360 | 0.351 | 0.379 | 0.407 | -0.411 |
| Fuzhou | 0.579 | 0.547 | 0.299 | 0.309 | 0.313 | 0.362 | 0.359 | 0.350 | 0.390 | -0.396 |
| Nanchang | 0.545 | 0.549 | 0.296 | 0.304 | 0.313 | 0.357 | 0.364 | 0.353 | 0.385 | -0.352 |
| Jinan | 0.545 | 0.502 | 0.287 | 0.288 | 0.264 | 0.330 | 0.316 | 0.322 | 0.357 | -0.409 |
| Zhengzhou | 0.492 | 0.442 | 0.250 | 0.270 | 0.228 | 0.292 | 0.302 | 0.319 | 0.324 | -0.352 |
| Wuhan | 0.563 | 0.544 | 0.318 | 0.296 | 0.310 | 0.362 | 0.338 | 0.335 | 0.383 | -0.405 |
| Changsha | 0.505 | 0.479 | 0.271 | 0.271 | 0.279 | 0.347 | 0.344 | 0.313 | 0.351 | -0.380 |
| Guangzhou | 0.583 | 0.574 | 0.297 | 0.323 | 0.304 | 0.374 | 0.373 | 0.342 | 0.396 | -0.413 |
| Nanning | 0.562 | 0.518 | 0.314 | 0.336 | 0.295 | 0.361 | 0.362 | 0.324 | 0.384 | -0.423 |
| Haikou | 0.623 | 0.600 | 0.336 | 0.353 | 0.338 | 0.401 | 0.367 | 0.373 | 0.424 | -0.401 |
| Chongqing | 0.469 | 0.449 | 0.270 | 0.274 | 0.257 | 0.318 | 0.305 | 0.306 | 0.331 | -0.348 |
| Chengdu | 0.476 | 0.442 | 0.259 | 0.250 | 0.266 | 0.322 | 0.337 | 0.332 | 0.336 | -0.303 |
| Guiyang | 0.492 | 0.469 | 0.331 | 0.289 | 0.292 | 0.294 | 0.316 | 0.350 | 0.354 | -0.289 |
| Kunming | 0.575 | 0.525 | 0.299 | 0.293 | 0.307 | 0.370 | 0.350 | 0.308 | 0.378 | -0.464 |
| Lhasa | 0.605 | 0.622 | 0.353 | 0.350 | 0.337 | 0.348 | 0.373 | 0.350 | 0.417 | -0.421 |
| Xi’an | 0.423 | 0.365 | 0.246 | 0.263 | 0.248 | 0.296 | 0.298 | 0.284 | 0.303 | -0.329 |
| Lanzhou | 0.580 | 0.497 | 0.274 | 0.277 | 0.260 | 0.305 | 0.303 | 0.309 | 0.351 | -0.467 |
| Xining | 0.497 | 0.418 | 0.245 | 0.208 | 0.225 | 0.269 | 0.283 | 0.247 | 0.299 | -0.503 |
| Yinchuan | 0.594 | 0.508 | 0.272 | 0.263 | 0.269 | 0.332 | 0.320 | 0.297 | 0.357 | -0.500 |
| Urumqi | 0.580 | 0.523 | 0.261 | 0.259 | 0.240 | 0.263 | 0.282 | 0.313 | 0.340 | -0.460 |
| Mean | 0.536 | 0.499 | 0.284 | 0.285 | 0.283 | 0.334 | 0.326 | 0.327 | 0.359 | -0.390 |
Table 4
Frequency of temporal differentiation of urban traffic ecological resilience (Di) in 31 Chinese cities during 2011-2018."
| Period | Actual frequency | Total | Expected frequency | Total | ||||
|---|---|---|---|---|---|---|---|---|
| Di≥0.438 | 0.310≤Di<0.438 | Di<0.310 | Di≥0.438 | 0.310≤Di<0.438 | Di<0.310 | |||
| 2011-2012 | 55 | 7 | 0 | 62 | 21 | 30 | 38 | 89 |
| 2013-2015 | 0 | 21 | 72 | 93 | 15 | 21 | 27 | 63 |
| 2016-2018 | 3 | 56 | 34 | 93 | 22 | 33 | 41 | 96 |
| Total | 58 | 84 | 106 | 248 | 58 | 84 | 106 | 248 |
Table 5
Frequency of spatial differentiation of urban traffic ecological resilience (Di) in the eastern region, the central region, and the western region of the 31 Chinese cities."
| Region | Actual frequency | Total | Expected frequency | Total | ||||
|---|---|---|---|---|---|---|---|---|
| Di≥0.438 | 0.310≤Di<0.438 | Di<0.310 | Di≥0.438 | 0.310≤Di<0.438 | Di<0.310 | |||
| Eastern region | 21 | 36 | 31 | 88 | 21 | 30 | 37 | 88 |
| Central region | 19 | 22 | 23 | 64 | 16 | 22 | 26 | 64 |
| Western region | 21 | 26 | 49 | 96 | 24 | 32 | 40 | 96 |
| Total | 61 | 84 | 103 | 248 | 61 | 84 | 103 | 248 |
Table 6
Type of Kernel density values of urban traffic ecological resilience of 31 Chinese cities in 2011, 2013, 2015, and 2018."
| City | Type of Kernel density value | |||
|---|---|---|---|---|
| 2011 | 2013 | 2015 | 2018 | |
| Beijing | I | IV | IV | IV |
| Tianjin | III | III | II | I |
| Shijiazhuang | II | I | I | I |
| Taiyuan | II | I | I | II |
| Hohhot | II | II | II | I |
| Shenyang | II | II | II | II |
| Changchun | III | III | II | III |
| Harbin | II | I | I | II |
| Shanghai | II | I | II | II |
| Nanjing | IV | IV | IV | III |
| Hangzhou | II | III | III | III |
| Hefei | IV | III | III | IV |
| Fuzhou | III | III | III | III |
| Nanchang | III | III | III | III |
| Jinan | III | III | II | II |
| Zhengzhou | II | I | I | II |
| Wuhan | III | IV | III | II |
| Changsha | II | II | III | II |
| Guangzhou | IV | III | III | III |
| Nanning | III | III | III | II |
| Haikou | IV | IV | IV | III |
| Chongqing | II | II | II | II |
| Chengdu | II | II | II | II |
| Guiyang | II | II | III | III |
| Kunming | III | III | III | II |
| Lhasa | IV | IV | III | III |
| Xi’an | II | I | I | I |
| Lanzhou | III | III | II | II |
| Xining | II | I | I | I |
| Yinchuan | IV | III | II | II |
| Urumqi | III | II | I | II |
Table 7
Standard deviation ellipse parameters of urban traffic ecological resilience values in 31 Chinese cities during 2011-2018."
| Standard deviation ellipse parameter | 2011 | 2012 | 2013 | 2014 | 2015 | 2016 | 2017 | 2018 |
|---|---|---|---|---|---|---|---|---|
| Rotation angle θ (°) | 77.045 | 75.959 | 73.880 | 73.530 | 72.906 | 70.513 | 73.542 | 73.394 |
| Standard deviation along the Y-axis (km) | 12.759 | 12.839 | 12.631 | 12.550 | 12.487 | 12.352 | 12.422 | 12.589 |
| Standard deviation along the X-axis (km) | 9.232 | 9.241 | 9.059 | 9.117 | 9.001 | 8.972 | 8.999 | 9.066 |
Table 8
Changes in the center of urban traffic ecological resilience values in 31 Chinese cities during 2011-2018."
| Center coordinates | 2011 | 2012 | 2013 | 2014 | 2015 | 2016 | 2017 | 2018 |
|---|---|---|---|---|---|---|---|---|
| Longitude (°E) | 111.792 | 111.844 | 111.836 | 111.917 | 112.046 | 112.207 | 111.964 | 112.153 |
| Latitude (°N) | 33.166 | 33.065 | 32.965 | 32.902 | 32.950 | 32.993 | 32.913 | 33.182 |
Table 9
Unit root test results of the panel data of traffic ecological resilience values in 31 Chinese cities."
| Variable | LLC test | IPS test | HT test | Fisher test | LM test | Stable state |
|---|---|---|---|---|---|---|
| TERES | -10.073*** | -6.159*** | -3.451*** | 222.811*** | 10.781*** | Stationary |
| ln(Financ) | -6.280*** | 1.881 | -6.908*** | 134.154*** | 6.659*** | Stationary |
| Consum | -6.102*** | -5.920*** | -12.749*** | 228.902*** | 3.870*** | Stationary |
| ln(Patent) | -2.857** | -1.339** | -4.708*** | 164.173*** | 9.056*** | Stationary |
| ln(Ftrade) | 8.133*** | -3.151* | -7.165*** | 139.855*** | 8.133*** | Stationary |
| ln(Deposi) | -5.237*** | 1.242 | -4.234*** | 143.035*** | 9.778*** | Stationary |
Table 10
Regression analysis of the panel data of traffic ecological resilience values in 31 Chinese cities."
| Variable | Coefficient | Standard error | t value | P value | Upper limit of 95% confidence interval | Lower limit of 95% confidence interval |
|---|---|---|---|---|---|---|
| ln(Financ) | -0.1279 | 0.0445 | -2.8800 | 0.004 | -0.0403 | -0.2155 |
| Consum | 0.0010 | 0.0005 | 2.2200 | 0.027 | 0.0019 | 0.0001 |
| ln(Patent) | -0.0279 | 0.0162 | -1.7200 | 0.087 | 0.0041 | -0.0599 |
| ln(Ftrade) | -0.1151 | 0.0521 | -2.2100 | 0.028 | -0.0124 | -0.2178 |
| ln(Deposi) | -0.1206 | 0.0476 | -2.5300 | 0.012 | -0.0267 | -0.2145 |
| Constant | 2.6915 | 0.2508 | 10.7300 | 0.000 | 3.1858 | 2.1972 |
| [1] |
Arabindoo, P., 2016. Unprecedented natures? An anatomy of the Chennai floods. City. 20(6), 800-821.
doi: 10.1080/13604813.2016.1239410 |
| [2] | Bai, L.M., Xiu, C.L., Feng, X.H., et al., 2019. Comprehensive assessment of urban resilience in China and its temporal and spatial differentiation characteristics. World Regional Studies. 28(6), 77-87 (in Chinese). |
| [3] |
Burton, C.G., 2015. A validation of metrics for community resilience to natural hazards and disasters using the recovery from Hurricane Katrina as a case study. Ann. Assoc. Am. Geogr. 105(1), 67-86.
doi: 10.1080/00045608.2014.960039 |
| [4] |
Cambi, M., Certini, G., Neri, F., et al., 2015. The impact of heavy traffic on forest soils: A review. For. Ecol. Manage. 338, 124-138.
doi: 10.1016/j.foreco.2014.11.022 |
| [5] | Chen, L., Zhu, X.G., Sun, J., 2017. The basic concept, mechanism and planning ideas of resilient cities. Modern Urban Research. 32(9), 18-24 (in Chinese). |
| [6] | Chen, T., Li, Y.L., 2019. Urban water environment-oriented urban design strategy from the perspective of ecological resilience. Science and Technology Review. 37(8), 26-36 (in Chinese). |
| [7] | Chen, Y.L., Xie, B.G., Yang, Y., 2015. Spatial distribution and influencing factors analysis of air quality in major urban agglomerations across the country. Journal of Arid Land Resources and Environment. 29(11), 99-103 (in Chinese). |
| [8] | Chen, Y.M., Li, K.C., 2017. Overseas studies progress and practice exploration on resilient city—based on the perspective of public administration. Chinese Public Administration. (1), 137-143 (in Chinese). |
| [9] | Cheng, H., Yang, G., Ji, X., 2019. A Study on decoupling relationship between urban toughness and environmental pressure in China’s top ten city agglomerations. Statistics and Decision. 523(7), 79-83 (in Chinese). |
| [10] |
Cutter, S.L., Ash, K.D., Emrich, C.T., 2014. The geographies of community disaster resilience. Global Environmental Change. 29, 65-77.
doi: 10.1016/j.gloenvcha.2014.08.005 |
| [11] |
Desouza, K.C., Flanery, T.H., 2013. Designing, planning, and managing resilient cities: a conceptual framework. Cities. 35, 89-99.
doi: 10.1016/j.cities.2013.06.003 |
| [12] | Ding, L., Liu, C., Huang, Y.L., et al., 2016. Spatial and temporal characteristics of urban ambient air quality and its main influence factors in Hubei Province. Economic Geography. 36(3), 170-178 (in Chinese). |
| [13] | Fahrig, L., Rytwinski, T., 2009. Effects of roads on animal abundance: An empirical review and synthesis. Ecology and Society. 14(1), 21-40. |
| [14] |
Fainstein, S.S., 2018. Resilience and justice: Planning for New York City. Urban Geography. 39(8), 1268-1275.
doi: 10.1080/02723638.2018.1448571 |
| [15] |
Forman, R.T.T., Alexander, L.E., 1998. Roads and their major ecological effects. Annual Review of Ecology Systematics. 29, 207-231.
doi: 10.1146/ecolsys.1998.29.issue-1 |
| [16] |
Francis, R., Bekera, B., 2014. A metric and frameworks for resilience analysis of engineered and infrastructure systems. Reliability Engineering and System Safety. 121, 90-103.
doi: 10.1016/j.ress.2013.07.004 |
| [17] |
Hadri, K., 2000. Testing for stationarity in heterogeneous panel data. The Econometrics Journal. 3(2), 148-161.
doi: 10.1111/1368-423X.00043 |
| [18] |
Harris, R.D.F., Tzavalis, E., 1999. Inference for unit roots in dynamic panels where the time dimension is fixed. Journal of econometrics. 91(2), 201-226.
doi: 10.1016/S0304-4076(98)00076-1 |
| [19] |
Holling, C.S., 1973. Resilience and stability of ecological systems. Annual Review of Ecology Systematics. 4, 1-23.
doi: 10.1146/ecolsys.1973.4.issue-1 |
| [20] | Hu, X.W., Huang, Y., Wan, J.P., et al., 2018. Spatial distribution and evolution of foreign trade volume between each province in China and all countries of the New Silk Road Economic Zone. Economic Geography. 38(10), 5-12 (in Chinese). |
| [21] |
Im, K.S., Pesaran, M.H., Shin, Y., 2003. Testing for unit roots in heterogeneous panels. Journal of econometrics. 115(1), 53-74.
doi: 10.1016/S0304-4076(03)00092-7 |
| [22] | IPCC, 2007. Climate Change 2007: Synthesis Report. Contribution of Working Groups I, II and III to the Fourth Assessment Report of the Intergovernmental Panel on Climate Change. In: Pachauri, R.K, Reisinger, A. (eds.). IPCC, Geneva, Switzerland, 1-104. |
| [23] | Jiang, Y.M., Guo, H.C., Yu, Y.J., et al., 2007. Analysis on the framework of comprehensive evaluation method of urban ecological transportation system. Urban Problems. (4), 27-30 (in Chinese). |
| [24] |
Joerin, J., Shaw, R., Takeuchi, Y., et al., 2012. Action-oriented resilience assessment of communities in Chennai, India. Environmental Hazards. 11(3), 226-241.
doi: 10.1080/17477891.2012.689248 |
| [25] |
Karlson, M., Mörtberg, U., Balfors, B., 2014. Road ecology in environmental impact assessment. Environ. Impact Assess. Rev. 48, 10-19.
doi: 10.1016/j.eiar.2014.04.002 |
| [26] |
Levin, A., Lin, C.F., James Chu, C.S., Unit root tests in panel data: asymptotic and finite-sample properties. J. Econom. 108(1), 1-24.
doi: 10.1016/S0304-4076(01)00098-7 |
| [27] | Li, G.D., Fang, C.L., 2016. Quantitative identification and analysis of urban ecological-production-living space functions. Acta Geographica Sinica. 71(1), 49-65 (in Chinese). |
| [28] |
Li, T.Y., 2017. New progress in the study of resilient cities. International Urban Planning. 32(5), 15-25 (in Chinese).
doi: 10.22217/upi |
| [29] | Li, X., 2020. Preventing major risks and building resilient cities. Urban Development Research. 27(3), 1 (in Chinese). |
| [30] | Li, Y., Zhai, G.F., Gu, F.M., 2016. Research review on quantitative assessment methods of urban infrastructure resilience. Urban Development Research. 23(6), 113-122 (in Chinese). |
| [31] | Liao, G.X., Lin, H.J., Wang, Y., 2015. The theory of urban resilience and flood bearing: Another foundation for planning practice. International Urban Planning. 30(2), 36-47 (in Chinese). |
| [32] | Liu, D., Hua, C., 2014. The evolution of the concept of flexibility and its enlightenment to urban planning innovation. Urban Development Research. 21(11), 111-117 (in Chinese). |
| [33] | Liu, Y.F., Li, H.M., Ma, H.Y., 2021. Evaluation of agricultural modernization of state farms: based on entropy weight method and TOPSIS method. Issues in Agricultural Economy. (2), 107-116 (in Chinese). |
| [34] | Ma, Y., Li, L.X., Ren, J., 2017. Research on the coordinated development of tourism economy-transportation-eco-environment in Shennongjia forest area. Economic Geography. 10, 215-227 (in Chinese). |
| [35] | Ministry of Ecology and Environment of the People’s Republic of China, 2011- 2019a. China Vehicle Environmental Management Annual Report. [2021-03-01]. http://www.mee.gov.cn (in Chinese). |
| [36] | Ministry of Ecology and Environment of the People’s Republic of China, 2011- 2019b. China Statistical Yearbook on Environment. Beijing: China Statistic Press (in Chinese). |
| [37] | Ministry of Ecology and Environment of the People’s Republic of China, 2011- 2019c. China Ecological Environmental Bulletin. Beijing: China Ocean Press (in Chinese). |
| [38] | Ministry of Housing and Urban-Rural Development of the People’s Republic of China, 2011- 2019. China Urban Construction Yearbook. Beijing: China Planning Press (in Chinese). |
| [39] | Ministry of Transport of the People’s Republic of China, 2011- 2019. China Traffic Yearbook. Beijing: China Transportation Press (in Chinese). |
| [40] | National Bureau of Statistics of China, 2011- 2019. China Statistical Yearbook. Beijing: China Statistic Press (in Chinese). |
| [41] | Ni, X.L., Li, X.Q., 2021. Three types of resilient city evaluation systems and their new development direction. International Urban Planning. 3, 76-82 (in Chinese). |
| [42] | Ouyang, H.B., Ye, Q., 2016. A review on the evolution of resilient city theory: concept, context and tendency. City Planning Review. 40(3), 34-42 (in Chinese). |
| [43] | Pan, X.J., Li, Z.R., 2019. Exploration on the concept of administrative resilience. Chinese Public Administration. (2), 98-101, 151 (in Chinese). |
| [44] |
Polemis, B., 1959. Nonparametric statistics for the behavioral sciences. Soc. Serv. Rev. 33(1), 99-100.
doi: 10.1086/640648 |
| [45] | Qian, F., 2008. Comparison of research hotspots of knowledge management at home and abroad based on Chi square test. Journal of information. 9, 56-58 (in Chinese). |
| [46] | Qiu, B.X., 2017. Five criteria for building resilient urban traffic. Urban Development Research. 11, 1-7 (in Chinese). |
| [47] | Resilience Alliance, 2017. Urban Resilience Research Prospectus. [2021-09-07]. http://www.resalliance.or/1610.php. |
| [48] | Shao, Y.W., Xu, J., 2015. Understanding urban resilience: a conceptual analysis based on integrated international literature review. Urban Planning International. 30(2), 48-54 (in Chinese). |
| [49] | van der Ree, R., Jaeger, J.A.G., van der Grift, E.A., et al., 2011. Effects of roads and traffic on wildlife populations and landscape function: Road ecology is moving toward larger scales. Ecol. Soc. 16(1), 48-58. |
| [50] | van der Ree, R., Smith, D.J., Grilo, C., 2015. The ecological effects of linear infrastructure and traffic: challenges and opportunities of rapid global growth. In: van der Ree, R., Smith, D.J., Grilo, C. (eds.). Handbook of Road Ecology. Chichester: John Wiley & Sons, Ltd. |
| [51] |
von Rozycki, C., Koeser, H., Schwarz, H., 2003. Ecology profile of the German high-speed rail passenger transport system, ICE. Int. J. Life Cycle Assess. 8(2), 83-91.
doi: 10.1007/BF02978431 |
| [52] | Wang, G.H., Wang, Y.Q., 2021. Evaluation of urban resilience in China based on risk matrix: a case study of 284 cities. Guizhou Social Sciences. (1), 126-134 (in Chinese). |
| [53] | Wang, H.X., 2016. Urban eco transportation system theory and its realization path. Science and Technology Management Research. (1), 246-251 (in Chinese). |
| [54] | Wang, J.S., Yan, Y., Hu, S.H., 2017. The spatial characteristics and influencing factors of the technological innovation capabilities of Chinese cities: A study based on the spatial panel data model. Geographical Sciences. 37(1), 11-18 (in Chinese). |
| [55] | Wang, J.T., Zhao, Y.F., 2016. Measurement of urban traffic congestion level in China: An empirical study based on 35 large and medium cities. Learning and Practice. 6, 19-27 (in Chinese). |
| [56] | Wei, Y., Xiu, C.L., Sun, P.J., 2013. Analysis of the dynamic mechanism of China’s urbanization since the 21st century. Geographical Research. 32(9), 1679-1687 (in Chinese). |
| [57] | Wei, Y., 2019. Research on the adaptive construction of rural community living space from the perspective of “resilience”. Urban Development Research. 26(11), 50-57 (in Chinese). |
| [58] | Wu, Y., 2021. Can smart city construction improve urban resilience? A quasi-natural experiment. Journal of Public Administration. 4, 25-44 (in Chinese). |
| [59] | Xiao, W.T., Wang, L., 2020. Research on the overall risk prevention and control of modern cities from the perspective of resilience. Chinese Public Administration. 2, 123-128 (in Chinese). |
| [60] | Xiu, C.L., Wei, Y., Wang, Q., 2018. Evaluation of urban resilience in Dalian based on “scale-density-shape”. Acta Geographica Sinica. 73(12), 2315-2328 (in Chinese). |
| [61] | Xu, J.P., Lin, X.Y., 2015. Calculation on the ecological footprint of urban passenger traffic in China: taking Beijing City for example. Urban Problems. (9), 74-80 (in Chinese). |
| [62] | Xu, K., Fang, Y.G., 2019. Spatial differentiation and type identification of rural territorial multi-functions in Liaoning Province. Geographical Research. 38(3), 482-495 (in Chinese). |
| [63] | Xu, W.Z., Xie, H.J., 2013. Research on the improvement of urban road ecological quality. Urban Development Research. 20(8), 54-59 (in Chinese). |
| [64] | Xu, Z.Y., Han, Y., Pang, Y., 2012. Reflections on Beijing urban traffic congestion management from the perspective of comparison between China and foreign countries. Urban Development Research. 19(10), 148-150 (in Chinese). |
| [65] | Yang, J.Z., 2013. Atmospheric environmental quality analysis and countermeasures in the main urban area. Resources Economization and Environment Protection. 11, 167-168 (in Chinese). |
| [66] | Yanitsky, O., 1984. Towards Creating a Socio-Ecological Conception of a City. In: Cities and Ecology: The International Expert Meeting. Suzdal, Russia. |
| [67] | Zhang, M.D., Feng, X.Q., 2018a. Comprehensive evaluation on Chinese cities’ resilience. Urban Problems. (10), 27-36 (in Chinese). |
| [68] | Zhang, M.D., Feng, X.Q., 2018b. Resilient city: A new model for sustainable urban development. Journal of Zhengzhou University (Philosophy and Social Sciences Edition). 2, 59-63 (in Chinese). |
| [69] | Zhang, M.D., Feng, X.Q., 2019. A comparative study of urban resilience and economic development level of cities in Yangtze River Delta urban agglomeration. Urban Development Studies. 26(1), 82-91 (in Chinese). |
| [70] | Zhang, P., Yu, W., Zhang, Y.W., 2018. The temporal and spatial differentiation of urban resilience in Shandong Province and its influencing factors. Urban Problems. 278(9), 29-36 (in Chinese). |
| [71] | Zhang, Y.B., Yan, H.J., 2015. Analysis of influencing factor of air quality in Urumqi. Journal of Mathematics in Practice and Theory. 45(10), 149-154 (in Chinese). |
| [72] | Zhao, D.Y., Shi, B., Chen, Y.Q., et al., 2016. Effect of collaborative management on enhancement mechanism of urban resilience. Management Review. 28(8), 207-214 (in Chinese). |
| [73] | Zhao, K., Jiang, F.X., 2013. Economic agglomeration, urban location and urban land productivity—data from Jiangsu Province. East China Economic Management. 27(2), 1-6 (in Chinese). |
| [74] | Zheng, Z.D., 2016. The spillover effect of financial agglomeration in the context of the coordinated development of Beijing-Tianjin-Hebei: A comparative analysis based on the spatial panels of the Yangtze River Delta and the Pearl River Delta. Economic Management. 38(3), 33-44 (in Chinese). |
| [75] | Zhu, J.H., Sun, H.X., 2020. Research on spatial-temporal evolution and influencing factors of urban resilience of China’s three metropolitan agglomerations. Soft Science. 34(2), 72-79 (in Chinese). |
| No related articles found! |
| Viewed | ||||||
|
Full text |
|
|||||
|
Abstract |
|
|||||
 REGSUS Wechat
 新公网安备 65010402001202号