Regional Sustainability ›› 2026, Vol. 7 ›› Issue (2): 100336.doi: 10.1016/j.regsus.2026.100336
• Research article • Previous Articles
LI Peia,b, SHI Peijia,b, LIU Haimengc,d,*( ), LI Jiee, WANG Ziyanga,b
Received:2025-07-16
Revised:2026-01-15
Accepted:2026-03-04
Published:2026-04-30
Online:2026-03-17
Contact:
* E-mail address: liuhm@igsnrr.ac.cn (LIU Haimeng).
LI Pei, SHI Peiji, LIU Haimeng, LI Jie, WANG Ziyang. Multi-scenario simulation of land use spatial patterns in arid metropolitan regions of China with a coupled WESP-FLUS model[J]. Regional Sustainability, 2026, 7(2): 100336.
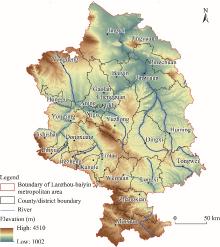
Fig. 1.
Overview of study area."
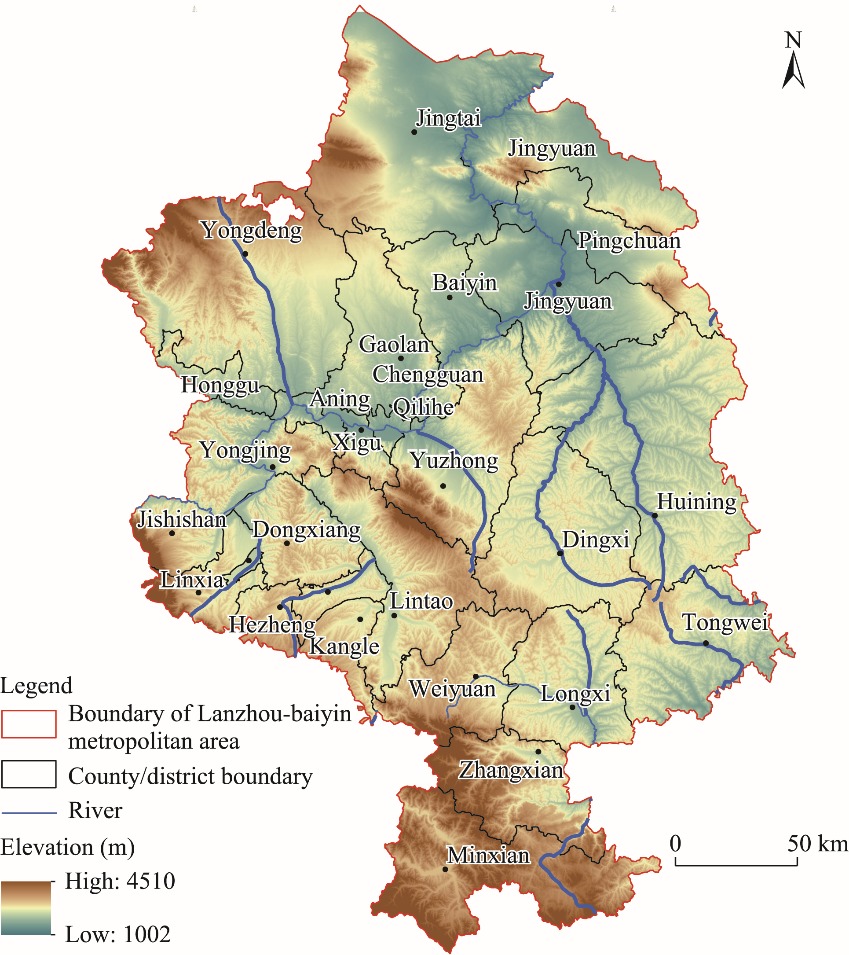
Table 1
Data type and sources."
| Data category | Data description | Sources |
|---|---|---|
| Base map | Administrative boundaries, major roads, and river network | Resource and Environment Science and Data Platform, Chinese Academy of Sciences ( |
| Land use type | Land use/cover maps (2000, 2010, and 2020) | Resource and Environment Science and Data Platform, Chinese Academy of Sciences ( |
| Water resource data | Gansu Water System Plan, Water Resources Bulletin, and Water Functional Zoning | Gansu Water Resources Department ( |
| Remote sensing image | Landsat 7 Enhanced Thematic Mapper Plus (ETM+) and Landsat 8 Operational Land Imager/Thermal Infrared Sensor (OLI/TIRS) | Geospatial Data Cloud ( |
| Topographic data | Digital elevation model (DEM) | Geospatial Data Cloud ( |
| Socioeconomic data | Population and gross domestic product (GDP) distribution | World Pop and Resource and Environment Science and Data Center, Chinese Academy of Sciences ( |
| Nighttime light data | Nighttime light imagery | Xu ( |
| Groundwater level data | Groundwater level data for the study area (2020) | Wang ( |
Table 2
Level and weight of selected indicators."
| Indicator | Sub-indicator | Class | Level | Weight |
|---|---|---|---|---|
| Topography | Elevation (m) | 1002-2100 | 5 | 0.016 |
| 2100-3250 | 3 | |||
| 3250-4510 | 1 | |||
| Slope (°) | <10.0 | 5 | 0.075 | |
| 10-20.0 | 4 | |||
| 20-30.0 | 3 | |||
| 30-40.0 | 2 | |||
| >40.0 | 1 | |||
| Land cover type | Water body | 5 | 0.537 | |
| Forest land | 4 | |||
| Grassland | 3 | |||
| Cropland | 2 | |||
| Urban built-up land and other land use types | 1 | |||
| Vegetation cover | Normalized Difference Vegetation Index (NDVI) | 0.8-1.0 | 5 | 0.157 |
| 0.6-0.8 | 4 | |||
| 0.4-0.6 | 3 | |||
| 0.2-0.4 | 2 | |||
| 0.0-0.2 | 1 | |||
| Transportation infrastructure | Distance to the road (m) | >1000.0 | 5 | 0.173 |
| 500.0-1000.0 | 4 | |||
| 200.0-500.0 | 3 | |||
| 100.0-200.0 | 2 | |||
| <100.0 | 1 | |||
| Distance to the railway (m) | >1000.0 | 5 | 0.042 | |
| 500.0-1000.0 | 4 | |||
| 200.0-500.0 | 3 | |||
| 100.0-200.0 | 2 | |||
| <100.0 | 1 | |||
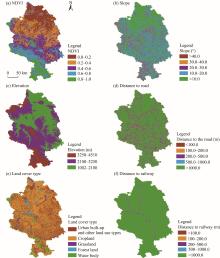
Fig. 2.
Spatial distribution of NDVI (a), slope (b), elevation (c), distance to road (d), land use type (e), and distance to railway (f). NDVI, Normalized Difference Vegetation Index."

Table 3
Neighborhood influence parameters in the Future Land Use Simulation (FLUS) model."
| Scenario | Cropland | Forest land | Grassland | Water body | Urban built-up land | Other land use types |
|---|---|---|---|---|---|---|
| Natural development | 0.01 | 0.47 | 0.44 | 0.60 | 0.91 | 0.49 |
| Urban economic optimization scenario | 0.01 | 0.45 | 0.37 | 0.58 | 0.89 | 0.48 |
| Ecological conservation priority | 0.01 | 0.47 | 0.55 | 0.63 | 1.00 | 0.48 |
| Urban-water coordinated development | 0.01 | 0.35 | 0.53 | 0.56 | 1.00 | 0.23 |
Table 4
Land use type transition matrix in the Lanzhou-Baiyin metropolitan area during 2010-2020 (unit: km2)."
| Cropland | Forest land | Grassland | Water body | Urban built-up land | Other land-use types | Total | |
|---|---|---|---|---|---|---|---|
| Cropland | 11,433.00 | 378.00 | 6571.00 | 107.00 | 487.00 | 114.00 | 19,090.00 |
| Forest land | 539.00 | 2491.00 | 1214.00 | 11.00 | 31.00 | 7.00 | 4293.00 |
| Grassland | 6817.00 | 1199.00 | 25,320.00 | 88.00 | 191.00 | 262.00 | 33,877.00 |
| Water body | 159.00 | 15.00 | 102.00 | 226.00 | 23.00 | 17.00 | 542.00 |
| Urban built-up land | 926.00 | 52.00 | 415.00 | 35.00 | 490.00 | 15.00 | 1933.00 |
| Other land use types | 141.00 | 13.00 | 274.00 | 4.00 | 5.00 | 375.00 | 812.00 |
| Total | 20,015.00 | 4148.00 | 33,896.00 | 471.00 | 1227.00 | 790.00 | 60,547.00 |

Fig. 3.
Technical framework for identifying urban spatial growth drivers using auto-logistic models. UCL, urban built-up land; NUCL, non-urban built-up land; 1, 2, …, N mean the quantitative indicators of potential drivers."
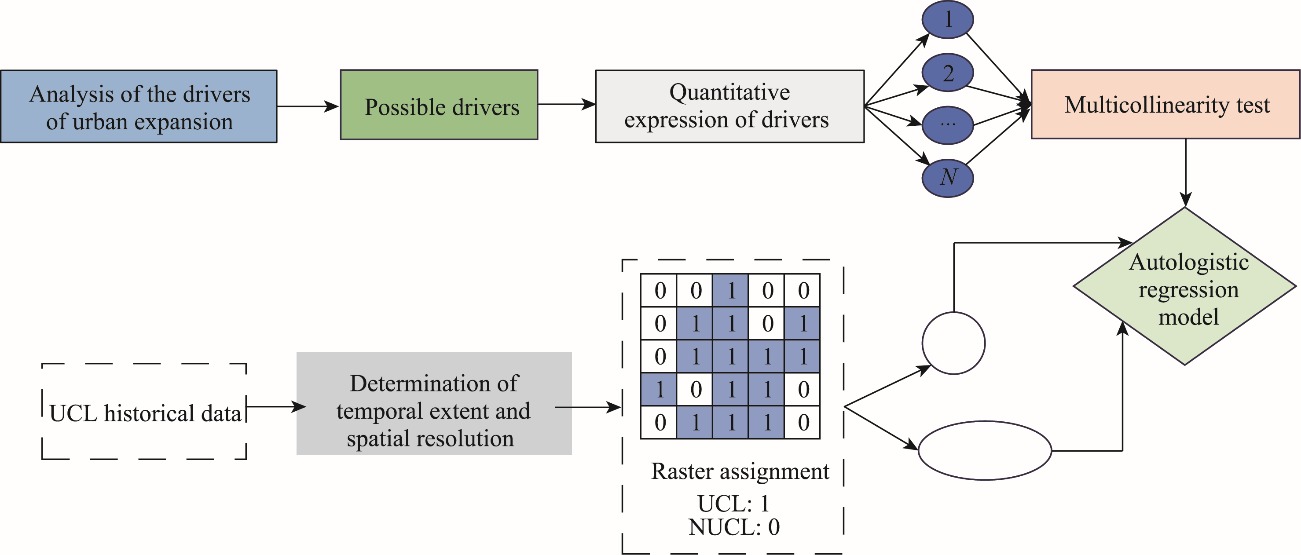
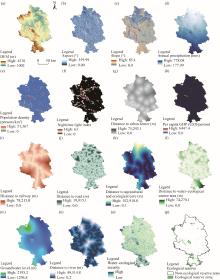
Fig. 4.
Spatial distribution of selected driving factors in the Water Ecological Security Pattern-Future Land Use Simulation (WESP-FLUS) model in the Lanzhou-Baiyin metropolitan area in 2020. (a), digital elevation model (DEM); (b), aspect; (c), slope; (d), annual precipitation; (e), population density; (f), nighttime light index; (g), distance to urban center; (h), per capita gross domestic product (GDP); (i), distance to railway; (j), distance to road; (k), distance to agricultural and ecological core; (l), distance to water-ecological source area; (m), groundwater level; (n), distance to river; (o), water-ecological security; (p), ecological reserve."

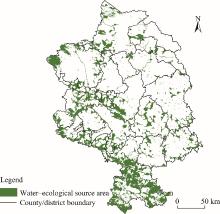
Fig. 5.
Spatial distribution of water-ecological source area in the Lanzhou-Baiyin metropolitan area in 2020."
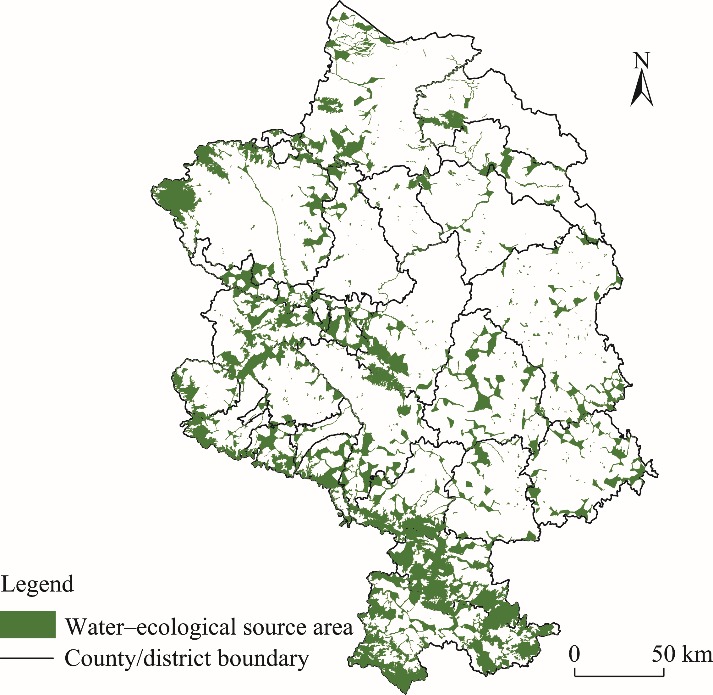
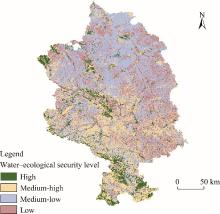
Fig. 6.
Spatial distribution of water-ecological security level in the Lanzhou-Baiyin metropolitan area in 2020."

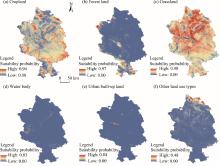
Fig. 7.
Spatial distribution of land use suitability probability in the Lanzhou-Baiyin metropolitan area in 2020. (a), crop land; (b), forest land; (c), grassland; (d), water body; (e), urban built-up land; (f), other land use types."

Table 5
Number of actual and simulated pixels of each land use type in the Lanzhou-Baiyin metropolitan area in 2020."
| Cropland | Forest land | Grassland | Water body | Urban built-up land | Other land use types | |
|---|---|---|---|---|---|---|
| Actual | 1,933,212 | 407,655 | 3,382,663 | 52,315 | 45,529 | 229,582 |
| Simulated | 1,903,677 | 439,377 | 3,398,205 | 49,992 | 33,894 | 225,811 |
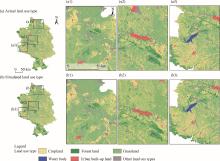
Fig. 8.
Comparison of actual and simulated land use type distribution patterns in the Lanzhou-Baiyin metropolitan area in 2020. (a), actual land use type; (b), simulated land use type."
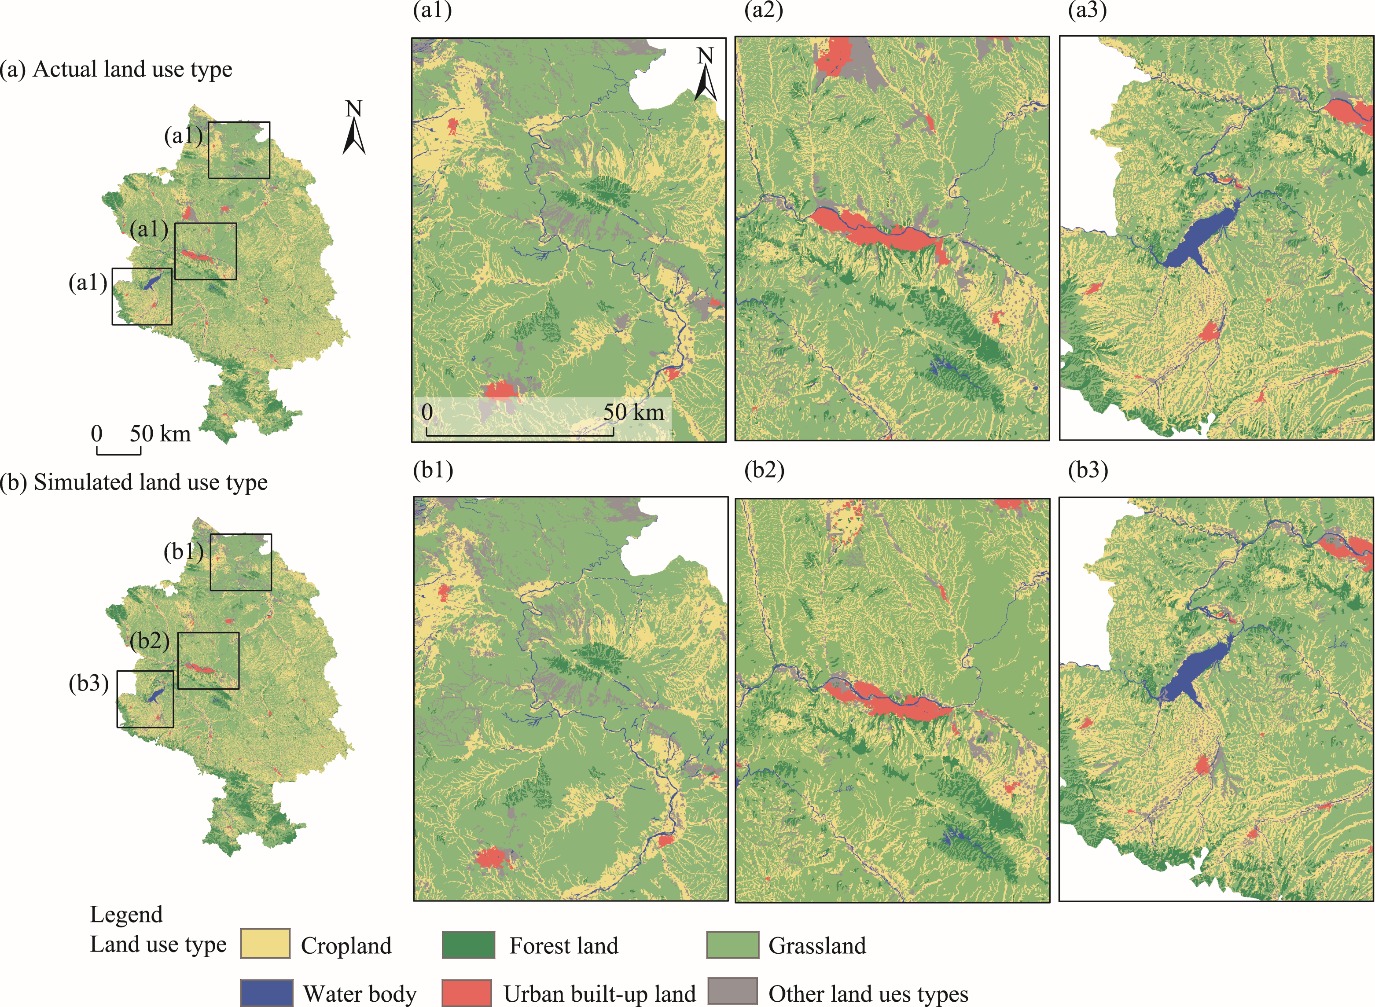
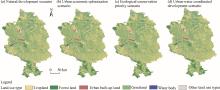
Fig. 9.
Spatial distribution of land use types under four scenario simulations in the Lanzhou-Baiyin metropolitan area in 2030. (a), natural development scenario; (b), urban economic optimization scenario; (c), ecological conservation priority scenario; (d), urban-water coordinated development scenario."
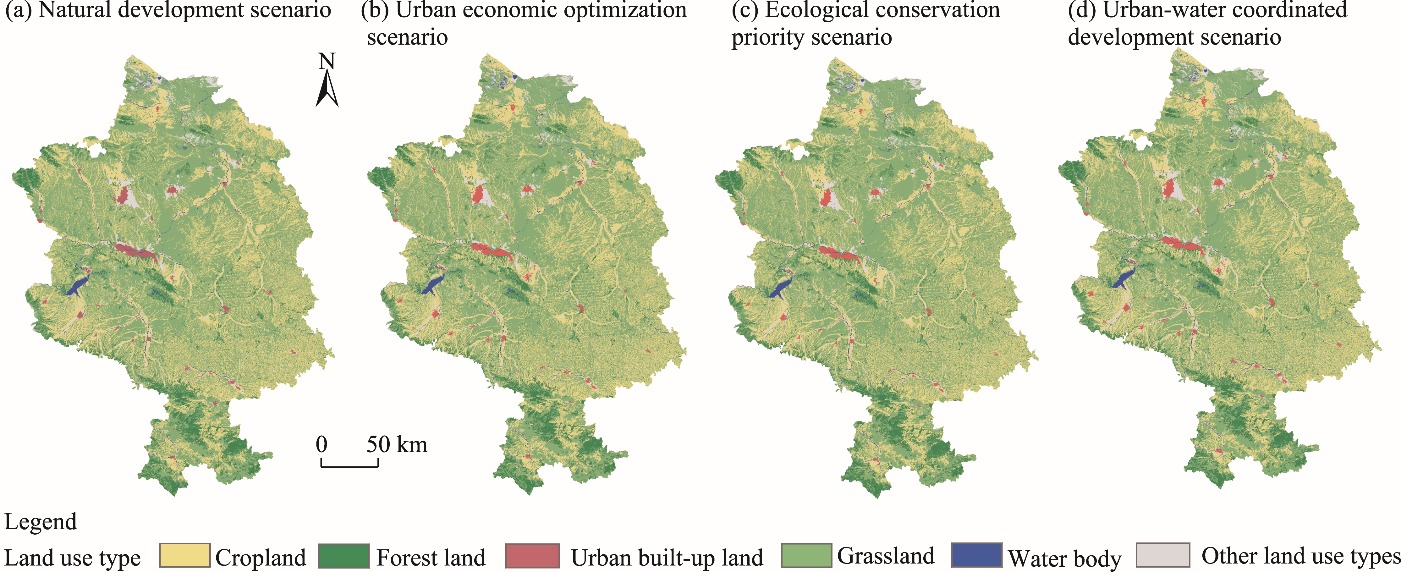
Table 6
Comparative selection of development scenarios."
| Indicator | Natural development scenario | Urban economic optimization scenario | Ecological conservation priority scenario | Urban-water coordinated development scenario |
|---|---|---|---|---|
| Urban development suitability | 0.725 | 0.764 | 0.790 | 0.831 |
| Ecological security | 4,398,732 | 3,310,894 | 4,966,832 | 4,690,137 |
| Spatial compactness | 51.089 | 48.713 | 57.904 | 63.197 |
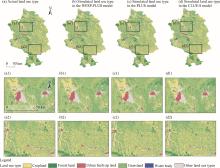
Fig. 10.
Assessment of actual land use types (a) with the simulated land use types in the WESP-FLUS (b), PLUS (c), and CLUE-S (d) models in the Lanzhou-Baiyin metropolitan area in 2020. PLUS, Patch-generating Land Use Simulation; CLUE-S, Conversion of Land Use and its Effects at Small regional extent."

Table 7
Comparison of actual and simulated pixels of each land use type in the Lanzhou-Baiyin metropolitan area in 2020."
| Land use type | Actual pixel | Simulated pixels of the WESP-FLUS | Simulated pixels of the PLUS | Simulated pixels of the CLUE-S |
|---|---|---|---|---|
| Cropland | 1,933,212 | 1,903,677 | 1,924,500 | 1,908,350 |
| Forest land | 407,655 | 439,377 | 395,100 | 408,900 |
| Grassland | 3,382,663 | 3,398,205 | 3,384,900 | 3,375,500 |
| Water body | 52,315 | 49,992 | 50,500 | 48,200 |
| Urban built-up land | 45,529 | 33,894 | 48,300 | 52,150 |
| Other land-use types | 229,582 | 225,811 | 233,656 | 240,856 |
| [1] | Asempah M., Sahwan W., Schütt B., 2021. Assessment of land cover dynamics and drivers of urban expansion using geospatial and logistic regression approach in Wa Municipality, Ghana. Land. 10(11), 1251, doi: 10.3390/land10111251. |
| [2] | Brueckner J.K., Fansler D.A., 1983. The economics of urban sprawl: Theory and evidence on the spatial sizes of cities. Review of Economics and Statistic. 65(3), 479-482. |
| [3] | Chakraborty S., Maity I., Dadashpoor H., et al., 2022. Building in or out? Examining urban expansion patterns and land use efficiency across the global sample of 466 cities with million+ inhabitants. Habitat International. 120, 102503, doi: 10.1016/j.habitatint.2021.102503. |
| [4] | Gao X.L., Lu C.P., Feng Q., et al., 2025. Adaptability investigation of water ecological security and socio-ecological resilience in arid inland river basins, China. Environmental and Sustainability Indicators. 27, 100859, doi: 10.1016/j.indic.2025.100859. |
| [5] | Gong D.H., Huang M., Ge Y., et al., 2025. Revolutionizing ecological security pattern with multi-source data and deep learning: An adaptive generation approach. Ecological Indicators. 173, 113315, doi: 10.1016/j.ecolind.2025.113315. |
| [6] | Gu Y.Y., Lin N.F., Ye X., et al., 2022. Assessing the impacts of human disturbance on ecosystem services under multiple scenarios in karst areas of China: Insight from ecological conservation red lines effectiveness. Ecological Indicators. 142, 109202, doi: 10.1016/j.ecolind.2022.109202. |
| [7] | Guo J., Feng P.F., Xue H., et al., 2025. A framework of ecological security patterns in arid and semi-arid regions considering differences socioeconomic scenarios in ecological risk: Case of Loess Plateau, China. Journal of Environmental Management. 373, 123923, doi: 10.1016/j.envman.2024.123923. |
| [8] | Han H.J., Yan X., Li X.H., et al., 2025. Significant differences in optimal riparian buffer zone on water quality between different segments within the same river. Journal of Environmental Management. 381, 125306, doi: 10.1016/j.jenvman.2025.125306. |
| [9] | Hu P., Zhou Y., Zhou J.H., et al., 2022. Uncovering the willingness to pay for ecological red lines protection: Evidence from China. Ecological Indicators. 134, 108458, doi: 10.1016/j.ecolind.2021.108458. |
| [10] | Jawarneh R.N., Abulibdeh A., Hashem N., et al., 2024. Assessing and predicting land cover dynamics for environmental sustainability in Jordan’s arid ecosystems using CA-Markov model. Remote Sensing Applications: Society and Environment. 35, 101262, doi: 10.1016/j.rsase.2024.101262. |
| [11] | Kamran J.G., Faizah C.R., Shuib R., 2024. Application of Cellular Automata and Markov Chain model for urban green infrastructure in Kuala Lumpur, Malaysia. Regional Sustainability. 5(4), 100179, doi: 10.1016/j.regsus.2024.100179. |
| [12] | Kong L.Q., Tian G.J., Ma B.R., et al., 2017. Embedding ecological sensitivity analysis and new satellite town construction in an agent-based model to simulate urban expansion in the Beijing metropolitan region, China. Ecological Indicators. 82, 233-249. |
| [13] | Li G.D., Sun S., Fang C.L., 2018. The varying driving forces of urban expansion in China: Insights from a spatial-temporal analysis. Landscape and Urban Planning. 174, 63-77. |
| [14] | Li P.X., Liu C.G., Yu C., et al., 2024. The delineation and effects of urban development boundaries under ecological constraints: The case of urban Nanjing, China. Ecological Indicators. 167, 112499, doi: 10.1016/j.ecolind.2024.112499. |
| [15] | Liang X., Liu X.P., Li X., et al., 2018. Delineating multi-scenario urban growth boundaries with a CA-based FLUS model and morphological method. Landscape and Urban Planning. 177, 47-63. |
| [16] | Lin W.B., Sun Y.M., Nijhuis S., et al., 2020. Scenario-based flood risk assessment for urbanizing deltas using future land-use simulation (FLUS): Guangzhou Metropolitan Area as a case study. Science of The Total Environment. 739, 139899, doi: 10.1016/j.scitotenv.2020.139899. |
| [17] | Liu H.M., Lu J.Y., Li X.C., et al., 2025. Evaluating human-nature relationships at a grid scale in China, 2000-2020. Habitat International. 156, 103282, doi: 10.1016/j.habitatint.2024.103282. |
| [18] | Liu X.P., Liang X., Li X., et al., 2017. A future land use simulation model (FLUS) for simulating multiple land use scenarios by coupling human and natural effects. Landscape and Urban Planning. 168, 94-116. |
| [19] | Liu X.Y., Wei M., Li Z.G., et al., 2022. Multi-scenario simulation of urban growth boundaries with an ESP-FLUS model: A case study of the Min Delta region, China. Ecological Indicators. 135, 108538, doi: 10.1016/j.ecolind.2022.108538. |
| [20] | Liu Y., Zuo R.G., Dong Y.N., 2021. Analysis of temporal and spatial characteristics of urban expansion in Xiaonan District from 1990 to 2020 using time series Landsat imagery. Remote Sensing. 13(21), 4299, doi: 10.3390/rs13214299. |
| [21] | Lu C.P., Ji W., Hou M.C., et al., 2022. Evaluation of efficiency and resilience of agricultural water resources system in the Yellow River Basin, China. Agricultural Water Management. 266, 107605, doi: 10.1016/j.agwat.2022.107605. |
| [22] | Luan C.X., Liu R.Z., 2025. Integrated ecological and environmental spatial soft constraint mechanism: Urban multi-objective land use optimization under multiple scenarios. Journal of Environmental Management. 385, 125661, doi: 10.1016/j.jenvman.2025.125661. |
| [23] |
Luo G.P., Yin C.Y., Chen X., et.al., 2010. Combining system dynamic model and CLUE-S model to improve land use scenario analyses at regional scale: A case study of Sangong watershed in Xinjiang, China. Ecological Complexity. 7(2), 198-207.
doi: 10.1016/j.ecocom.2010.02.001 |
| [24] | Mânica A.N., Rocha C., Silva Araújo L., et al., 2025. From forest to urban: Assessing the impact of land cover on water quality. Journal of Environmental Management. 386, 125739, doi: 10.1016/j.jenvman.2025.125739. |
| [25] |
Solaimani K., Darvishi S., 2024. Comparative analysis of land use changes modeling based-on new hybrid models and CA-Markov in the Urmia lake basin. Advances in Space Research. 74(8), 3749-3764.
doi: 10.1016/j.asr.2024.06.078 |
| [26] | Shu R., Ma G.Q., Zou Y.B., et al., 2024. Bibliometric analysis of ecological security pattern construction: Current status, evolution, and development trends. Ecological Indicators. 169, 112754, doi: 10.1016/j.ecolind.2024.112754. |
| [27] | Tan R.H., Liu P.C., Zhou K.H., et al., 2022. Evaluating the effectiveness of development-limiting boundary control policy: Spatial difference-in-difference analysis. Land Use Policy. 120, 106229, doi: 10.1016/j.landusepol.2022.106229. |
| [28] | Tian Y.S., Mao Q.H., 2022. The effect of regional integration on urban sprawl in urban agglomeration areas: A case study of the Yangtze River Delta, China. Habitat International. 130, 102695, doi: 10.1016/j.habitatint.2022.102695. |
| [29] | Wang G.Y., Wang L.Y., Jia M.Y., et al., 2025. Dynamic evolution and interaction mechanisms of socio-ecological systems and water constraints within an adaptive cycle framework: A case study of the Lower Yangtze River Basin. Environmental Impact Assessment Review. 114, 107937, doi: 10.1016/j.eiar.2025.107937. |
| [30] | Wang M., Yao J., Chang H., et al., 2024. Monthly groundwater level grid dataset of China region (2005-2022). [2025-05-04]. https://doi.org/10.11888/Terre.tpdc.301342. |
| [31] | Wei M., Huang T., 2025. Multi-scale transformation and evolutionary factors of ecological security patterns in the Yangtze River Economic Belt. Journal of Environmental Management. 390, 126308, doi: 10.1016/j.jenvman.2025.126308. |
| [32] |
Wu F., Liang Y.J., Liu L.J., et al., 2023. Identifying eco-functional zones on the Chinese Loess Plateau using ecosystem service bundles. Regional Sustainability. 4(4), 425-440.
doi: 10.1016/j.regsus.2023.11.005 |
| [33] | Xiao Y., Li Y., Tang X., et al., 2022. Assessing spatial-temporal evolution and key factors of urban livability in arid zone: The case study of the Loess Plateau, China. Ecological Indicators. 140, 108995, doi: 10.1016/j.ecolind.2022.108995. |
| [34] | Xiao Y., Shimada K., Shao S.D., et al., 2025. The diminishing incentive of ecological fiscal transfer on local government environmental expenditure —Evidence from National Key Ecological Function Zone in China. Ecological Economics. 235, 108634, doi: 10.1016/j.ecolecon.2025.108634. |
| [35] | Xin C.H., Guo F.Q., 2023. Quantitative simulation of ecological compensation approaches in transboundary watersheds of China: A scenario analysis based on a multi-regional CGE model. Ecological Indicators. 155, 111048, doi: 10.1016/j.ecolind.2023.111048. |
| [36] | Xu X.B., Yang G.S., Tan Y., 2019. Identifying ecological red lines in China’s Yangtze River Economic Belt: A regional approach. Ecological Indicators. 96, 635-646. |
| [37] | Xu X.L., 2022. Annual Data Set of Nighttime Lights in China. [2025-05-04]. https://www.resdc.cn/DOI/doi.aspx?DOIid=105. |
| [38] | Xu Y., Yang L., Sun K.Y., et al., 2025. Synergistic security relationships and risk measurement of water resources-social economy-ecological environment in Beijing-Tianjin-Hebei region. Ecological Indicators. 175, 113512, doi: 10.1016/j.ecolind.2025.113512. |
| [39] | Yang X.D., Bai Y.P., Che L., et al., 2021. Incorporating ecological constraints into urban growth boundaries: A case study of ecologically fragile areas in the Upper Yellow River. Ecological Indicators. 124, 107436, doi: 10.1016/j.ecolind.2021.107436. |
| [40] | Yao Y., Ma L.B., Che X.L., et al., 2021. Simulation study of urban expansion under ecological constraint—Taking Yuzhong County, China as an example. Urban Forestry & Urban Greening. 57, 129633, doi: 10.1016/j.ufug.2020.126933. |
| [41] | Yu T.H., Jia S.S., Zhang Y., et al., 2025. How can urban expansion and ecological preservation be balanced? A simulation of the spatial dynamics of production-living-ecological spaces in the Huaihe River Eco-Economic Belt. Ecological Indicators. 171, 113192, doi: 10.1016/j.ecolind.2025.113192. |
| [42] | Zhang D.C., Liu X.P., Lin Z.Y., et al., 2020. The delineation of urban growth boundaries in complex ecological environment areas by using cellular automata and a dual-environmental evaluation. Journal of Cleaner Production. 256, 120361, doi: 10.1016/j.jclepro.2020.120361. |
| [43] | Zhang L.J., Wang Y., Bian H.Y., et al., 2025. Understanding the ecological impacts of vertical urban growth in mountainous regions. Ecological Informatics. 87, 103079, doi: 10.1016/j.ecoinf.2025.103079. |
| [44] | Zhang Y.Y., Yang R.J., Sun M.Y., et al., 2024. Identification of spatial protection and restoration priorities for ecological security pattern in a rapidly urbanized region: A case study in the Chengdu—Chongqing economic Circle, China. Journal of Environmental Management. 366, 121789, doi: 10.1016/j.jenvman.2024.121789. |
| [45] | Zhou D.C., Sun S.L., Li Y., et al., 2023. A multi-perspective study of atmospheric urban heat island effect in China based on national meteorological observations: Facts and uncertainties. Science of The Total Environment. 854, 158638, doi: 10.1016/j.scitotenv.2022.158638. |
| [46] | Zhou H.M., Qiao X.N., Yang Y.J., et al., 2025. How to optimize ecological compensation to alleviate the ecosystem services supply and demand mismatch in the Luo River Basin? Ecological Indicators. 178, 114004, doi: 10.1016/j.ecolind.2025.114004. |
| No related articles found! |
| Viewed | ||||||
|
Full text |
|
|||||
|
Abstract |
|
|||||
 REGSUS Wechat
 新公网安备 65010402001202号