Regional Sustainability ›› 2025, Vol. 6 ›› Issue (5): 100263.doi: 10.1016/j.regsus.2025.100263
• Research article • Previous Articles Next Articles
WEI Menga,b, RU Lifeib,c, CAI Zhid,*( ), MA Mindae,f
Received:2024-10-24
Revised:2025-06-10
Accepted:2025-10-08
Published:2025-10-31
Online:2025-11-06
Contact:
* E-mail address: czhi0911@gmail.com (CAI Zhi).WEI Meng, RU Lifei, CAI Zhi, MA Minda. Dual impact of digitalization on the carbon emissions of Yangtze River Delta urban agglomerations in China: A spatiotemporal perspective[J]. Regional Sustainability, 2025, 6(5): 100263.

Fig. 1.
Overview of the study area. Note that the figure is based on the standard map (GS(2020)3189) of the Map Service System (http://bzdt.ch.mnr.gov.cn/download.html) marked by the Ministry of Natural Resources of the People’s Republic of China, and the boundary of the standard map has not been modified. 1, Shanghai Municipality; 2, Nanjing City; 3, Suzhou City (Jiangsu Province); 4, Wuxi City; 5, Changzhou City; 6, Hangzhou City; 7, Ningbo City; 8, Xuzhou City; 9, Hefei City; 10, Lianyungang City; 11, Suqian City; 12, Huai’an City; 13, Yancheng City; 14, Yangzhou City; 15, Taizhou City (Jiangsu Province); 16, Nantong City; 17, Zhenjiang City; 18, Huzhou City; 19, Jiaxing City; 20, Shaoxing City; 21, Quzhou City; 22, Jinhua City; 23, Taizhou City (Zhejiang Province); 24, Lishui City; 25, Wenzhou City; 26, Suzhou City (Anhui Province); 27, Huaibei City; 28, Bozhou City; 29, Fuyang City; 30, Bengbu City; 31, Lu’an City; 32, Huainan City; 33, Chuzhou City; 34, Maanshan City; 35, Anqing City; 36, Tongling City; 37, Wuhu City; 38, Chizhou City; 39, Xuancheng City; 40, Huangshan City; 41, Zhoushan City. The abbreviations are the same in the following figures."

Table 1
Selection and description of indicators and sub-indicators."
| Indicator | Sub-indicator | Description | Reference | Unit |
|---|---|---|---|---|
| Digitalization industry level | Telecommunications output | Total volume of telecommunications services per capita | Yang et al. ( | 104 CNY |
| Long-haul fiber optic cable line density | Ratio of the length of long-distance fiber optic cable line to the area of the administrative region | Yang et al. ( | km/km2 | |
| Digital industry talent | Percentage of employees in computer services and software | Yang et al. ( | % | |
| Digitalization application level | Internet application | Internet users per 100 persons | Yang et al. ( | % |
| Mobile Internet application | Cell phone subscribers per 100 persons | Zhang et al. ( | % | |
| Digital inclusive finance index | Digital finance digitization index | Liu et al. ( | - | |
| Urban green digitalization willingness | Environmental regulation | Percentage of investment in environmental pollution control in the gross domestic product (GDP) | Schnebelin et al. ( | % |
| Government digital awareness | Digital word frequency of government reports | Giest ( | - | |
| Science and technology focus | Percentage of science spending in the GDP | Tang et al. ( | % | |
| Level of green technology | Percentage of green inventions among the total annual inventions filed in the region | Yang et al. ( | % |

Fig. 2.
Analytical framework. CE, carbon emissions; YRD, Yangtze River Delta; SDM, spatial Durbin model; GIS, Geographic Information System."


Fig. 3.
Spatiotemporal distribution of CE in the YRD during 2006-2020 (a-o). Note that the figure is based on the standard map (GS(2020)3189) of the Map Service System (http://bzdt.ch.mnr.gov.cn/download.html) marked by the Ministry of Natural Resources of the People’s Republic of China, and the boundary of the standard map has not been modified."

Table 2
Moran’s I and Z values for carbon emissions (CE) in the Yangtze River Delta (YRD) during 2006-2020."
| Year | Moran’s I | Z value | Year | Moran’s I | Z value |
|---|---|---|---|---|---|
| 2006 | 0.181*** | 2.591 | 2014 | 0.142* | 1.855 |
| 2007 | 0.191*** | 2.686 | 2015 | 0.102 | 1.388 |
| 2008 | 0.195*** | 2.648 | 2016 | 0.157** | 2.039 |
| 2009 | 0.213*** | 2.663 | 2017 | 0.183*** | 2.328 |
| 2010 | 0.205** | 2.542 | 2018 | 0.231*** | 2.877 |
| 2011 | 0.192** | 2.424 | 2019 | 0.244*** | 2.980 |
| 2012 | 0.175** | 2.219 | 2020 | 0.192** | 3.357 |
| 2013 | 0.159** | 2.053 |

Fig. 4.
Digitalization industry level in 2006 (a), 2011 (b), 2016 (c), and 2020 (d); digitalization application level in 2006 (e), 2011 (f), 2016 (g), and 2020 (h); and urban green digitalization willingness in 2006 (i), 2011 (j), 2016 (k), and 2020 (l) in the YRD. Note that the figure is based on the standard map (GS(2020)3189) of the Map Service System (http://bzdt.ch.mnr.gov.cn/download.html) marked by the Ministry of Natural Resources of the People’s Republic of China, and the boundary of the standard map has not been modified."


Fig. 5.
Spatial cluster analysis of digitalization industry level in 2006 (a), 2011 (b), 2016 (c), and 2020 (d); spatial cluster analysis of digitalization application level in 2006 (e), 2011 (f), 2016 (g), and 2020 (h); and spatial cluster analysis of urban green digitalization willingness in 2006 (i), 2011 (j), 2016 (k), and 2020 (l) in the YRD. Note that the figure is based on the standard map (GS(2020)3189) of the Map Service System (http://bzdt.ch.mnr.gov.cn/download.html) marked by the Ministry of Natural Resources of the People’s Republic of China, and the boundary of the standard map has not been modified."
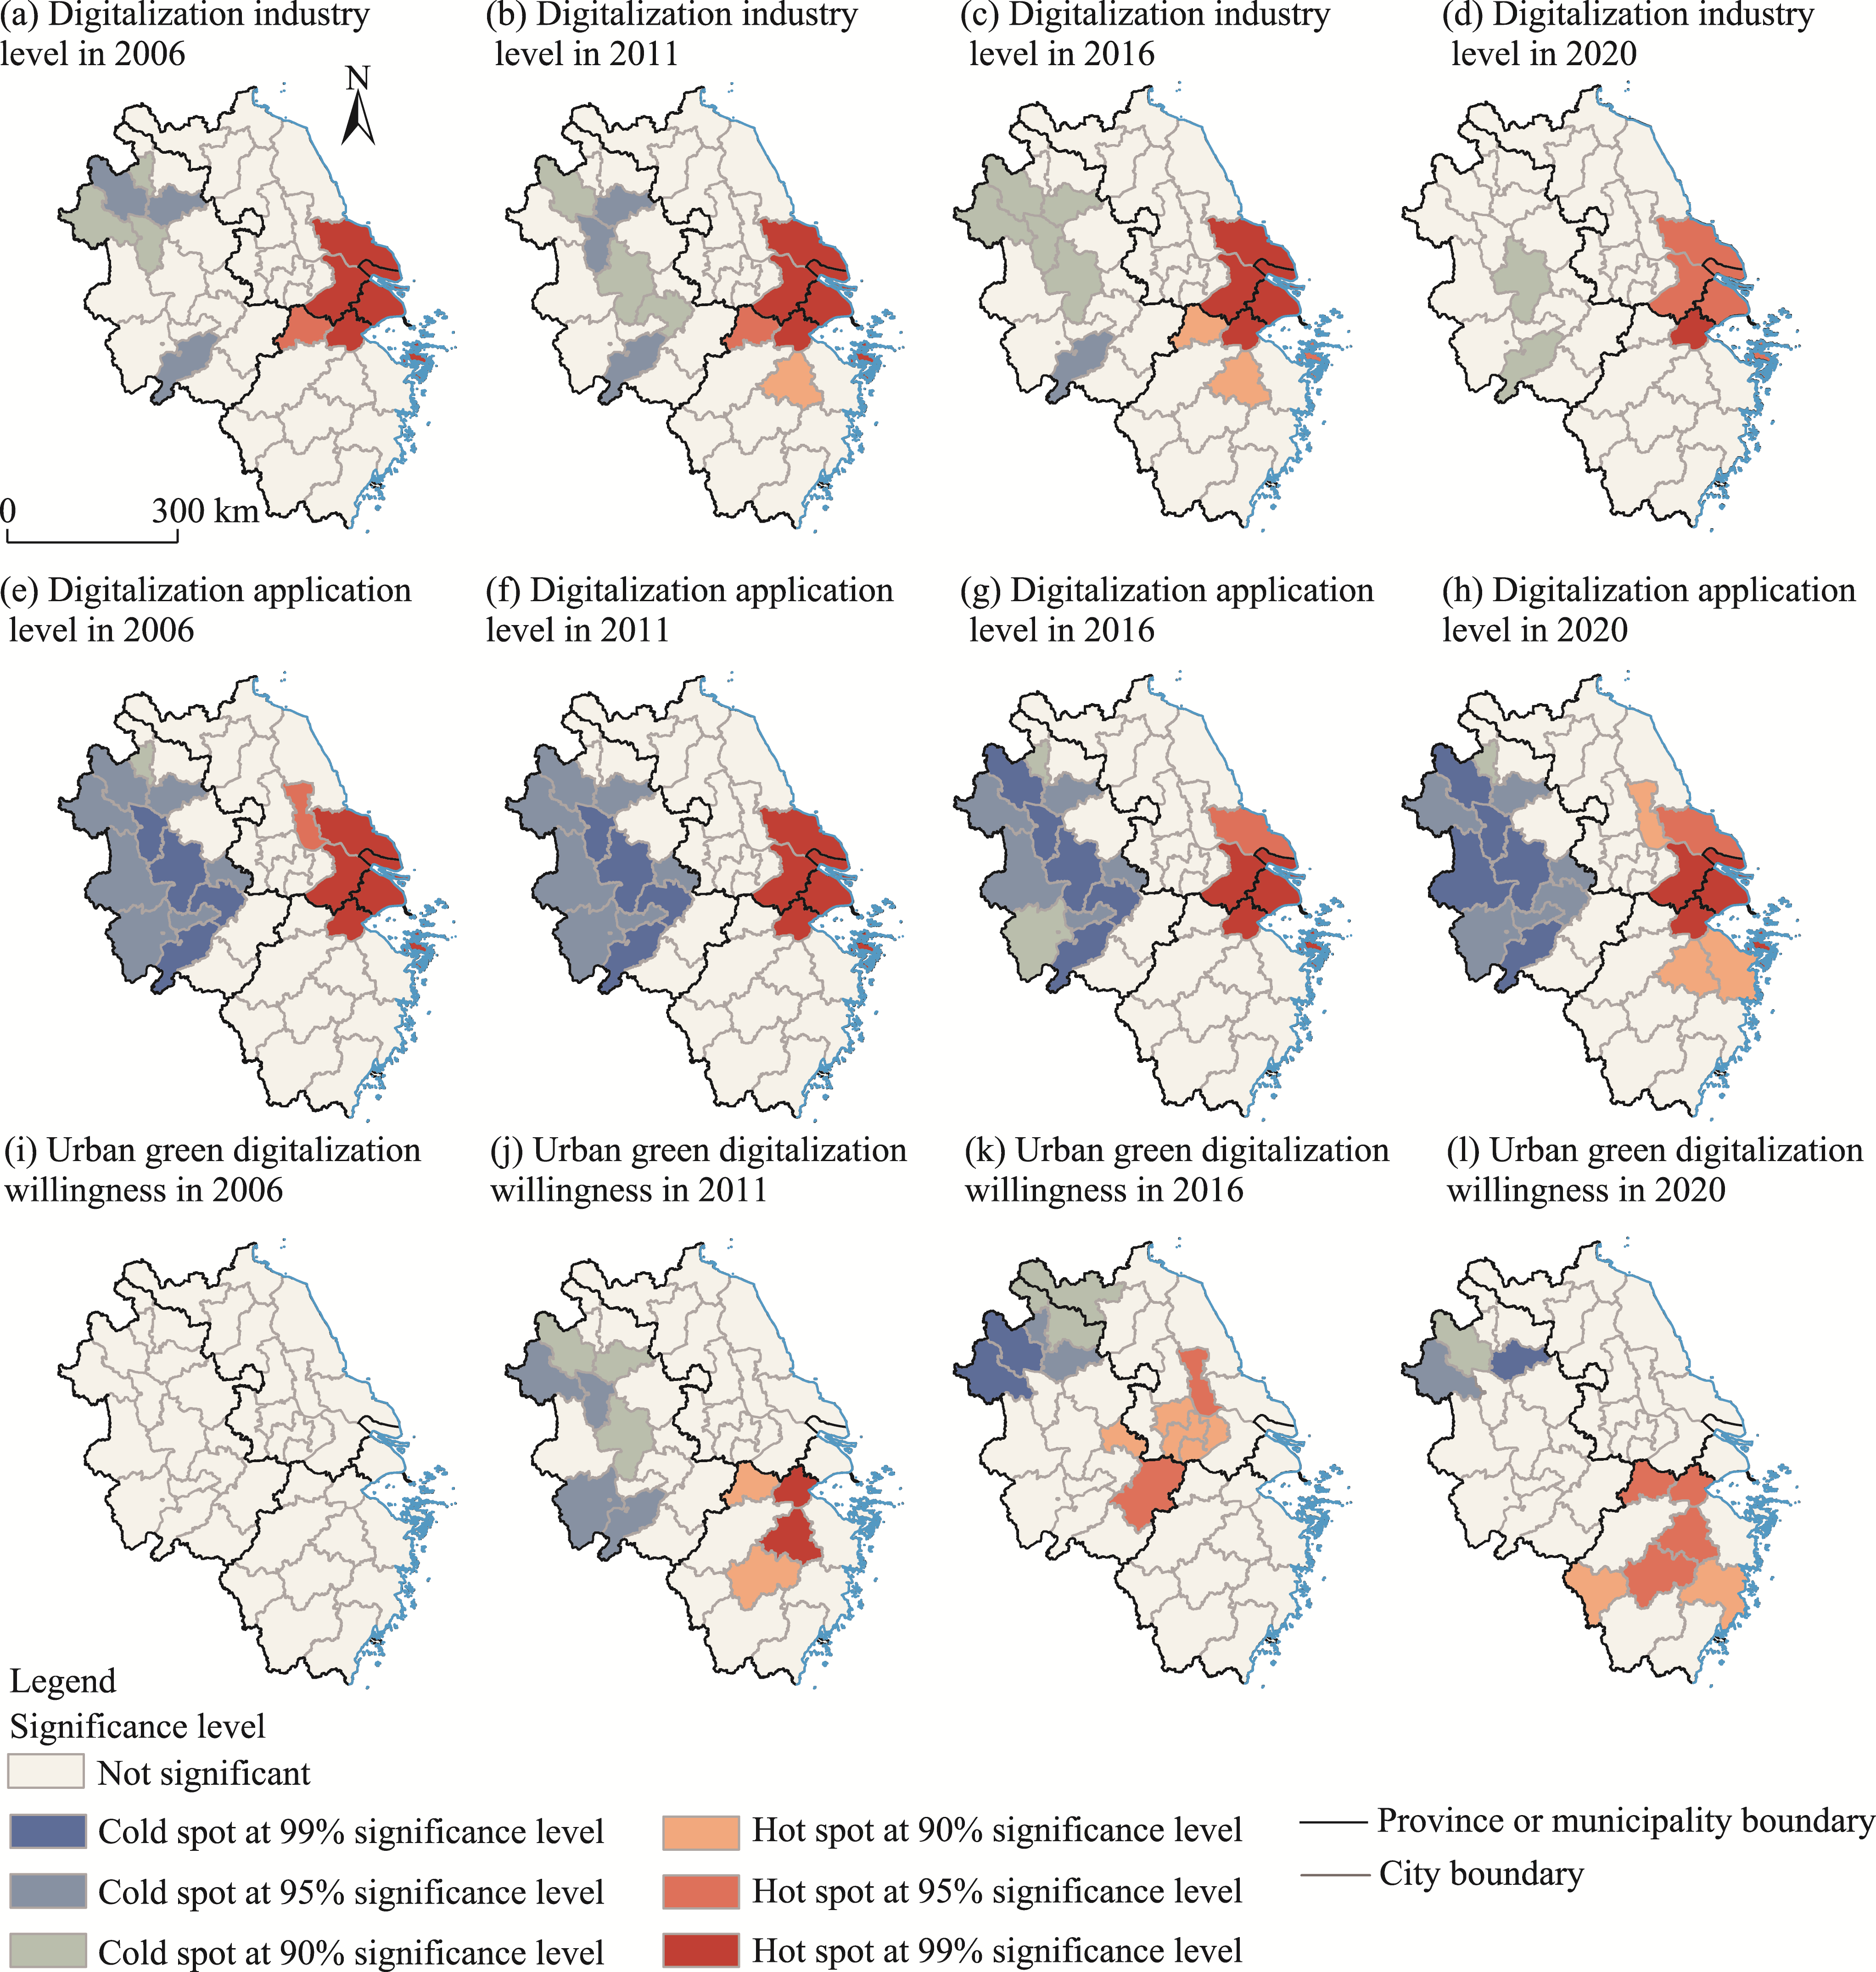
Table 3
Direct and indirect effects of digitalization indictors on CE in the YRD during different periods."
| Indicator | Direct effect | Indirect effect | ||||
|---|---|---|---|---|---|---|
| 2006-2010 | 2011-2015 | 2016-2020 | 2006-2010 | 2011-2015 | 2016-2020 | |
| Digitalization industry level | 0.0047 | 0.0197 | -0.1870 | -0.0589 | -0.0058 | -0.7600** |
| Digitalization application level | -0.0111 | -0.0039 | 0.3350** | -0.0005 | 0.0306 | 0.7580** |
| Urban green digitalization willingness | -0.0066 | -0.0198** | 0.0105 | 0.0184 | -0.0223 | 0.1230 |
Table 4
Direct effect of digitalization on CE in the YRD across different periods."
| Indicator | Sub-indicator | Weight value | ||
|---|---|---|---|---|
| 2006-2010 | 2011-2015 | 2016-2020 | ||
| Digitalization industry level | Telecommunications output | -0.0555* | 0.0050 | 0.2640** |
| Long-haul fiber optic cable line density | -0.0190 | 0.0481*** | -0.0159 | |
| Digital industry talent | 0.0130 | 0.0013 | -0.1350* | |
| Digitalization application level | Internet application | 0.1090 | -0.0189 | 0.2960 |
| Mobile Internet application | -0.0410 | 0.0116 | 0.1110 | |
| Digital inclusive finance index | -0.2120 | 0.0130 | -0.3200 | |
| Urban green digitalization willingness | Environmental regulation | -0.0046 | -0.0021 | 0.0571 |
| Government digital awareness | 0.0283 | -0.0097* | -0.0592 | |
| Science and technology focus | -0.0423* | -0.0287 | -0.0091 | |
| Level of green technology | -0.0134* | -0.0306** | -0.1210 | |
Table 5
Indirect effect of digitalization on CE in the YRD across different periods."
| Indicator | Sub-indicator | Weight value | ||
|---|---|---|---|---|
| 2006-2010 | 2011-2015 | 2016-2020 | ||
| Digitalization industry level | Telecommunications output | 0.0987 | 0.0248 | -0.0281 |
| Long-haul fiber optic cable line density | -0.0057 | 0.0368 | -0.4390*** | |
| Digital industry talent | -0.0418* | 0.0003 | -0.1120 | |
| Digitalization application level | Internet application | -0.0427 | -0.0489 | -2.5190** |
| Mobile Internet application | 0.1240 | -0.0076 | 0.2190 | |
| Digital inclusive finance index | -0.6750 | 0.0432 | 3.2840*** | |
| Urban green digitalization willingness | Environmental regulation | 0.0081 | -0.0082 | -0.0193 |
| Government digital awareness | -0.0186 | -0.0426** | 0.2620*** | |
| Science and technology focus | 0.0910* | -0.0364 | 0.1520 | |
| Level of green technology | 0.0219 | 0.0190 | 0.0443 | |

Fig. 6.
“Core-periphery” spatial pattern of digitalization industry level in the YRD in 2020 (a) and spatial subsystems formed by the “core-periphery” spatial pattern (b). Note that the Figure 6a is based on the standard map (GS(2020)3189) of the Map Service System (http://bzdt.ch.mnr.gov.cn/download.html) marked by the Ministry of Natural Resources of the People’s Republic of China, and the boundary of the standard map has not been modified."

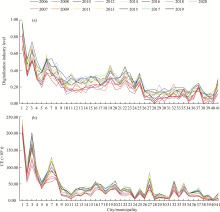
Fig. 7.
Distribution of digitalization industry level (a) and CE (b) in the YRD during 2006-2020."

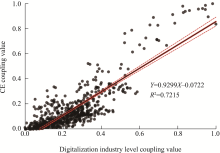
Fig. 8.
Distribution of digitalization industry level coupling value and CE coupling value in the YRD."

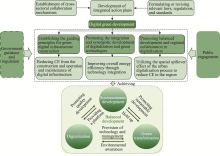
Fig. 9.
Logical framework of policy recommendation."

| [1] | Aranya, R., 2008. Location theory in reverse? Location for global production in the IT industry of Bangalore. Environ. Plan. A. 40, 446-463. |
| [2] | Bai, T.T., Qi, Y., Li, Z.H., et al., 2023. Digital economy, industrial transformation and upgrading, and spatial transfer of carbon emissions: The paths for low-carbon transformation of Chinese cities. J. Environ. Manage. 344, 118528, doi: 10.1016/j.jenvman.2023.118528. |
| [3] | Balogun, A.L., Marks, D., Sharma, R., et al., 2020. Assessing the potentials of digitalization as a tool for climate change adaptation and sustainable development in urban centres. Sust. Cities Soc. 53, 101888, doi: 10.1016/j.scs.2019.101888. |
| [4] | Brunsdon, C., Fotheringham, S., Charlton, M., 1998. Geographically weighted regression. J. R. Stat. Soc. Ser. D-Stat. 47, 431-443. |
| [5] | Bukht, R., Heeks, R., 2017. Defining, conceptualising and measuring the digital economy. SSRN Electronic Journal. 68, 1732, doi: 10.2139/ssrn.3431732. |
| [6] | Chang, H., Ding, Q.Y., Zhao, W.Z., et al., 2023. The digital economy, industrial structure upgrading, and carbon emission intensity—empirical evidence from China’s provinces. Energy Strategy Rev. 50, 101218, doi: 10.1016/j.esr.2023.101218. |
| [7] | Chen, L.J., 2022. How CO2 emissions respond to changes in government size and level of digitalization? Evidence from the BRICS countries. Environ. Sci. Pollut. Res. 29(1), 457-467. |
| [8] | Cui, P.X., Zhuang, K.J., 2025. Digital economy and industrial structure transformation and income distribution. Appl. Econ. 57(35), 5215-5231. |
| [9] | Dadashpoor, H., Yousefi, Z., 2018. Centralization or decentralization? A review on the effects of information and communication technology on urban spatial structure. Cities. 78, 194-205. |
| [10] | Dong, K.Y., Jiang, H.D., Sun, R.J., et al., 2019. Driving forces and mitigation potential of global CO2 emissions from 1980 through 2030: Evidence from countries with different income levels. Sci. Total Environ. 649, 335-343. |
| [11] | Du, C.J., Wang, C.J., 2024. Digitization and carbon emissions: how does the development of China’s digital economy affect carbon intensity? Environ. Sci. Pollut. Res. 31(18), 26895-26915. |
| [12] | ElMassah, S., Mohieldin, M., 2020. Digital transformation and localizing the sustainable development goals (SDGs). Ecol. Econ. 169, 106490, doi: 10.1016/j.ecolecon.2019.106490. |
| [13] | Gao, Y.J., Zhao, J.Y., Han, L., 2022. Exploring the spatial heterogeneity of urban heat island effect and its relationship to block morphology with the geographically weighted regression model. Sust. Cities Soc. 76, 103431, doi: 10.1016/j.scs.2021.103431. |
| [14] | Giest, S., 2017. Big data analytics for mitigating carbon emissions in smart cities: opportunities and challenges. Eur. Plan. Stud. 25(6), 941-957. |
| [15] | Hu, R.F., Xu, W.Q., Liu, L.F., et al., 2023. The impact of urban agglomerations on carbon emissions in China: Spatial scope and mechanism. J. Clean Prod. 419, 138250, doi: 10.1016/j.jclepro.2023.138250. |
| [16] | Huang, Y.X., Hu, M., Xu, J.J., et al., 2023. Digital transformation and carbon intensity reduction in transportation industry: Empirical evidence from a global perspective. J. Environ. Manage. 344, 118541, doi: 10.1016/j.jenvman.2023.118541. |
| [17] | Jin, Z.D., Wang, J.C., Yang, M., et al., 2022. The effects of participation in global value chains on energy intensity: Evidence from international industry-level decomposition. Energy Strateg. Rev. 39, 100780, doi: 10.1016/j.esr.2021.100780. |
| [18] | Kjaer, L.L., Pigosso, D.C., McAloone, T.C., et al., 2018. Guidelines for evaluating the environmental performance of Product/Service-Systems through life cycle assessment. J. Clean Prod. 190, 666-678. |
| [19] | Li, C.Y., Zhou, W.S., 2024. Can digital economy development contribute to urban carbon emission reduction? - Empirical evidence from China. J. Environ. Manage. 357, 120680, doi: 10.1016/j.jenvman.2024.120680. |
| [20] | Li, G.Q., Liao, F.Y., 2022. Input digitalization and green total factor productivity under the constraint of carbon emissions. J. Clean Prod. 377, 134403, doi: 10.1016/j.jclepro.2022.134403. |
| [21] | Li, L., Ma, S.J., Zheng, Y.L., et al., 2022a. Integrated regional development: Comparison of urban agglomeration policies in China. Land Use Pol. 114, 105939, doi: 10.1016/j.landusepol.2021.105939. |
| [22] | Li, Z., Luo, Z., Wang, Y., et al., 2022b. Suitability evaluation system for the shallow geothermal energy implementation in region by Entropy Weight Method and TOPSIS method. Renew. Energy. 184, 564-576. |
| [23] | Li, Z.G., Wang, J., 2022. The dynamic impact of digital economy on carbon emission reduction: Evidence city-level empirical data in China. J. Clean Prod. 351, 131570, doi: 10.1016/j.jclepro.2022.131570. |
| [24] | Liu, H.M., Wang, X.Y., Wang, Z.Y., et al., 2024. Does digitalization mitigate regional inequalities? Evidence from China. Geogr. Sustain. 5(1), 52-63. |
| [25] | Liu, J.L., Yu, Q.H., Chen, Y.Y., et al., 2022a. The impact of digital technology development on carbon emissions: A spatial effect analysis for China. Resour. Conserv. Recycl. 185, 106445, doi: 10.1016/j.resconrec.2022.106445. |
| [26] | Liu, H., Wang, L.L., Shen, Y., 2023. Can digital technology reduce carbon emissions? Evidence from Chinese cities. Front. Ecol. Evol. 11, 1205634, doi: 10.3389/fevo.2023.1205634. |
| [27] | Liu, K., Liu, X.Y., Long, H.Y., et al., 2022b. Spatial agglomeration and energy efficiency: Evidence from China’s manufacturing enterprises. J. Clean Prod. 380, 135109, doi: 10.1016/j.jclepro.2022.135109. |
| [28] | Long, Y., Chen, G.W., Wang, Y.F., 2023. Carbon footprint of residents’ online consumption in China. Environ. Impact Assess. Rev. 103, 107228, doi: 10.1016/j.eiar.2023.107228. |
| [29] | Ma, R.Y., Zhang, Z.P., Lin, B.Q., 2023. Evaluating the synergistic effect of digitalization and industrialization on total factor carbon emission performance. J. Environ. Manage. 348, 119281, doi: 10.1016/j.jenvman.2023.119281. |
| [30] | Ma, Z.Y., Xiao, H., Li, J., et al., 2025. Study on how the digital economy affects urban carbon emissions. Renew. Sust. Energ. Rev. 207, 114910, doi: 10.1016/j.rser.2024.114910. |
| [31] | National Bureau of Statistics, 2007- 2021a. China Statistical Yearbook. Beijing: China Statistics Press (in Chinese). |
| [32] | National Bureau of Statistics, 2007- 2021b. China Statistical Yearbook on Science and Technology. Beijing: China Statistics Press (in Chinese). |
| [33] | Niu, X.X., Ma, Z., Ma, W.J., et al., 2024. The spatial spillover effects and equity of carbon emissions of digital economy in China. J. Clean. Prod. 434, 139885, doi: 10.1016/j.jclepro.2023.139885. |
| [34] | Pan, W.R., Xie, T., Wang, Z.W., et al., 2022. Digital economy: An innovation driver for total factor productivity. J. Bus. Res. 139, 303-311. |
| [35] | Rong, P.J., Zhang, Y., Qin, Y.C., et al., 2020. Spatial differentiation of carbon emissions from residential energy consumption: A case study in Kaifeng, China. J. Environ. Manage. 271, 110895, doi: 10.1016/j.jenvman.2020.110895. |
| [36] | Salahuddin, M., Alam, K., 2015. Internet usage, electricity consumption and economic growth in Australia: A time series evidence. Telemat. Inform. 32(4), 862-878. |
| [37] | Schnebelin, É., Labarthe, P., Touzard, J.M., 2021. How digitalisation interacts with ecologisation? Perspectives from actors of the French agricultural innovation system. J. Rural Stud. 86, 599-610. |
| [38] | Shang, Y.P., Raza, S.A., Huo, Z., et al., 2023. Does enterprise digital transformation contribute to the carbon emission reduction? Micro-level evidence from China. Int. Rev. Econ. Financ. 86, 1-13 |
| [39] | Sharifi, A., Khavarian-Garmsir, A.R., Allam, Z., et al., 2023. Progress and prospects in planning: A bibliometric review of literature in urban studies and regional and urban planning, 1956-2022. Prog. Plan. 173, 100740, doi: 10.1016/j.progress.2023.100740. |
| [40] | Song, M., Wu, J., Song, M.R., et al., 2020. Spatiotemporal regularity and spillover effects of carbon emission intensity in China’s Bohai Economic Rim. Sci. Total Environ. 740, 140184, doi: 10.1016/j.scitotenv.2020.140184. |
| [41] | Sun, B., Chen, Y., 2025. Impact of digital economy on regional innovation efficiency from the perspective of spatial spillover. Appl. Econ. 1-17. |
| [42] | Su, Y., Yu, Y.N., Zhang, N., 2020. Carbon emissions and environmental management based on Big Data and Streaming Data: A bibliometric analysis. Sci. Total Environ. 733, 138984, doi: 10.1016/j.scitotenv.2020.138984. |
| [43] | Sun, Y., Hu, Z., 2021. Digital economy, industrial upgrading and improvement of urban environmental quality. Statistics & Decision. 37, 91-95. |
| [44] | Tang, C., Xu, Y.Y., Hao, Y., et al., 2021. What is the role of telecommunications infrastructure construction in green technology innovation? A firm-level analysis for China. Energy Econ. 103, 105576, doi: 10.1016/j.eneco.2021.105576. |
| [45] | Usman, A., Ozturk, I., Hassan, A., et al., 2021. The effect of ICT on energy consumption and economic growth in South Asian economies: An empirical analysis. Telemat. Inform. 58, 101537, doi: 10.1016/j.tele.2020.101537. |
| [46] | Wei, M., Cai, Z., Song, Y., et al., 2024. Spatiotemporal evolutionary characteristics and driving forces of carbon emissions in three Chinese urban agglomerations. Sust. Cities Soc. 104, 105320, doi: 10.1016/j.scs.2024.105320. |
| [47] | Wen, H.W., Wen, C.Y., Lee, C.C., 2022. Impact of digitalization and environmental regulation on total factor productivity. Inf. Econ. Policy. 61, 101007, doi: 10.1016/j.infoecopol.2022.101007. |
| [48] | Xiang, X.W., Zhou, N., Ma, M., et al., 2023. Global transition of operational carbon in residential buildings since the millennium. Adv. Appl. Energy. 11, 100145, doi: 10.1016/j.adapen.2023.100145. |
| [49] | Xiao, X., Liu, C., Li, S.X., 2024. How the digital infrastructure construction affects urban carbon emissions—A quasi-natural experiment from the “Broadband China” policy. Sci. Total Environ. 912, 169284, doi: 10.1016/j.scitotenv.2023.169284. |
| [50] | Xie, B., Liu, R., Dwivedi, R., 2024. Digital economy, structural deviation, and regional carbon emissions. J. Clean Prod. 434, 139890, doi: 10.1016/j.jclepro.2023.139890. |
| [51] | Xie, Y., Wu, D.S., 2024. How does competition policy affect enterprise digitization? Dual perspectives of digital commitment and digital innovation. J. Bus. Res. 178, 114651, doi: 10.1016/j.jbusres.2024.114651. |
| [52] | Yan, R., Ma, M.D., Zhou, N., et al., 2023. Towards COP27: Decarbonization patterns of residential building in China and India. Appl. Energy. 352, 122003, doi: 10.1016/j.apenergy.2023.122003. |
| [53] | Yan, R., Zhou, N., Ma, M.D., 2025. India’s residential space cooling transition: Decarbonization ambitions since the turn of millennium. Appl. Energy. 391, 125929, doi: 10.1016/j.apenergy.2025.125929. |
| [54] | Yang, Z., Gao, W.J., Han, Q., et al., 2022. Digitalization and carbon emissions: How does digital city construction affect China’s carbon emission reduction? Sust. Cities Soc. 87, 104201, doi: 10.1016/j.scs.2022.104201. |
| [55] | Yu, Y., Dai, Y.Q., Xu, L.Y., et al., 2023. A multi-level characteristic analysis of urban agglomeration energy-related carbon emission: A case study of the Pearl River Delta. Energy. 263, 125651, doi: 10.1016/j.energy.2022.125651. |
| [56] | Yuan, H., Ma, M.D., Zhou, N., et al., 2024. Battery electric vehicle charging in China: Energy demand and emissions trends in the 2020s. Appl. Energy. 365, 123153, doi: 10.1016/j.apenergy.2024.123153. |
| [57] | Zeng, J.T., Yang, M.R., 2023. Digital technology and carbon emissions: Evidence from China. J. Clean. Prod. 430, 139765, doi: 10.1016/j.jclepro.2023.139765. |
| [58] | Zhang, C., Fang, J.M., Ge, S.L., et al., 2024. Research on the impact of enterprise digital transformation on carbon emissions in the manufacturing industry. Int. Rev. Econ. Financ. 92, 211-227. |
| [59] | Zhang, G.J., Chen, Y., Wang, G.N., et al., 2023a. Spatial-temporal evolution and influencing factors of digital financial inclusion: County-level evidence from China. Chin. Geogr. Sci. 33(2), 221-232. |
| [60] | Zhang, H.S., Li, S.P., 2022. Carbon emissions’ spatial-temporal heterogeneity and identification from rural energy consumption in China. J. Environ. Manage. 304, 114286, doi: 10.1016/j.jenvman.2021.114286. |
| [61] | Zhang, J.N., Lyu, Y.W., Li, Y.T., et al., 2022a. Digital economy: An innovation driving factor for low-carbon development. Environ. Impact Assess. Rev. 96, 106821, doi: 10.1016/j.eiar.2022.106821. |
| [62] | Zhang, L., Mu, R.Y., Zhan, Y.F., et al., 2022b. Digital economy, energy efficiency, and carbon emissions: Evidence from provincial panel data in China. Sci. Total Environ. 852, 158403, doi: 10.1016/j.scitotenv.2022.158403. |
| [63] | Zhang, S.F., Zhou, N., Feng, W., et al., 2023b. Pathway for decarbonizing residential building operations in the US and China beyond the mid-century. Appl. Energy. 342, 121164, doi: 10.1016/j.apenergy.2023.121164. |
| [64] | Zhang, W., Liu, X.M., Wang, D., et al., 2022c. Digital economy and carbon emission performance: Evidence at China’s city level. Energy Policy. 165, 112927, doi: 10.1016/j.enpol.2022.112927. |
| [65] | Zhao, X.M., Lu, S.B., Yuan, S.C., 2023. How does the digitization of government environmental governance affect environmental pollution? spatial and threshold effects. J. Clean Prod. 415, 137670, doi: 10.1016/j.jclepro.2023.137670. |
| [66] | Zheng, R.J., Wu, G., Cheng, Y., et al., 2023. How does digitalization drive carbon emissions? The inverted U-shaped effect in China. Environ. Impact Assess. Rev. 102, 107203, doi: 10.1016/j.eiar.2023.107203. |
| [67] | Zhou, X.Y., Zhang, J., Li, J.P., 2013. Industrial structural transformation and carbon dioxide emissions in China. Energy Policy. 57, 43-51. |
| [68] | Zhu, B.Z., Zhang, M.F., Zhou, Y.H., et al., 2019. Exploring the effect of industrial structure adjustment on interprovincial green development efficiency in China: A novel integrated approach. Energy Policy. 134, 110946, doi: 10.1016/j.enpol.2019.110946. |
| [1] | Kwaku ADDAI, Berna SERENER, Dervis KIRIKKALELI. Can environmental sustainability be decoupled from economic growth? Empirical evidence from Eastern Europe using the common correlated effect mean group test [J]. Regional Sustainability, 2023, 4(1): 68-80. |
| [2] | HE Jianjian, ZHANG Pengyan. Evaluation of carbon emissions associated with land use and cover change in Zhengzhou City of China [J]. Regional Sustainability, 2022, 3(1): 1-11. |
| Viewed | ||||||
|
Full text |
|
|||||
|
Abstract |
|
|||||
 REGSUS Wechat
 新公网安备 65010402001202号