Regional Sustainability ›› 2026, Vol. 7 ›› Issue (3): 100350.doi: 10.1016/j.regsus.2026.100350
• Research article • Previous Articles Next Articles
LIAO Chaoliana, HE Xudongb, LONG Xiaominc, WAN Ailinga, ZHOU Rulianga, WANG Yanxiaa,*( )
)
Received:2025-05-06
Revised:2025-10-29
Accepted:2026-05-06
Published:2026-06-30
Online:2026-05-22
Contact:
*E-mail address: po_powyx1@163.com (WANG Yanxia).
LIAO Chaolian, HE Xudong, LONG Xiaomin, WAN Ailing, ZHOU Ruliang, WANG Yanxia. Spatiotemporal dynamics of land surface temperature in Yunnan, China: Interpreting multi-temporal drivers using eXtreme Gradient Boosting (XGBoost) and SHapley Additive exPlanations (SHAP)[J]. Regional Sustainability, 2026, 7(3): 100350.
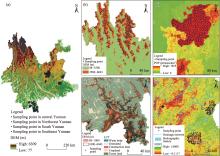
Fig. 1.
Location and elevation of the study area. (a), elevation map showing the study area and sampling point locations across four typical geographical units; (b), the northwest high mountain canyon area; (c), the central urban agglomeration warming area; (d), the south tropical rainforest area; (e), the southeast karst landform area. DEM, digital elevation model; POP, population density; LCT, land cover type; NDVI, Normalized Difference Vegetation Index."

Table 1
Data sources and spatial resolution."
| Data | Spatial resolution | Source |
|---|---|---|
| Land surface temperature (LST) | 1 km | https://search.earthdata.nasa.gov/ |
| Land cover types (LCTs) | 30 m | https://www.ncdc.ac.cn/portal/ |
| Normalized Difference Vegetation Index (DNVI) | 1 km | https://search.earthdata.nasa.gov/ |
| Normalized Difference Moisture Index (NDMI) | 1 km | https://search.earthdata.nasa.gov/ |
| Digital elevation model (DEM) | 30 m | https://www.usgs.gov/ |
| Precipitation (PRE) | 1 km | https://data.tpdc.ac.cn/ |
| Downward shortwave radiation (DSR) | 1 km | http://www.glass.umd.edu/ |
| Population density (POP) | 1 km | http://www.resdc.cn/ |
| Gross domestic product (GDP) | 1 km | http://www.resdc.cn/ |
| Particulate matter 2.5 (PM2.5) | 1 km | https://data.tpdc.ac.cn/ |
| Aerosol optical depth (AOD) | 1 km | https://modis.gsfc.nasa.gov |
Table 2
Classification standards and value ranges of interannual and seasonal LST."
| Dividing object | Extremely low temperature (°C) | Low temperature (°C) | Medium temperature (°C) | High temperature (°C) | Extremely high temperature (°C) |
|---|---|---|---|---|---|
| Annual mean | 12.130-9.590 | 9.590-14.000 | 14.000-18.410 | 18.410-22.820 | 22.820-25.740 |
| Daytime mean | 8.760-14.550 | 14.550-19.040 | 19.040-23.530 | 23.530-28.020 | 28.020-32.910 |
| Nighttime mean | 16.390-4.100 | 4.100-8.780 | 8.780-13.460 | 13.460-18.140 | 18.140-20.280 |
| Spring mean | 9.560-12.070 | 12.070-16.960 | 16.960-21.805 | 21.850-26.740 | 26.740-30.350 |
| Summer mean | 0.840-13.720 | 13.720-17.850 | 17.850-21.980 | 21.980-26.110 | 26.110-30.540 |
| Autumn mean | 8.380-10.000 | 10.000-13.900 | 13.900-17.800 | 17.800-21.700 | 21.700-25.180 |
| Winter mean | -17.170-4.780 | 4.780-9.520 | 9.520-14.260 | 14.260-19.000 | 19.000-20.350 |
Table 3
Model performance for LST prediction in 2005, 2010, 2015, and 2020."
| Year | Training set | Test set | ||||
|---|---|---|---|---|---|---|
| RMSE (°C) | MAE (°C) | R2 | RMSE (°C) | MAE (°C) | R2 | |
| 2005 | 0.515 | 0.392 | 0.987 | 0.847 | 0.629 | 0.966 |
| 2010 | 0.424 | 0.326 | 0.991 | 0.688 | 0.533 | 0.977 |
| 2015 | 0.459 | 0.348 | 0.989 | 0.743 | 0.577 | 0.970 |
| 2020 | 0.429 | 0.327 | 0.991 | 0.721 | 0.544 | 0.975 |
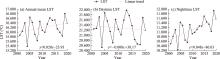
Fig. 2.
Temporal variation trends of land surface temperature (LST) during 2001-2020. (a), annual mean LST; (b), daytime LST; (c), nighttime LST."

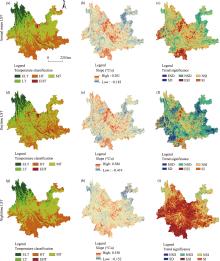
Fig. 3.
Spatial patterns and trends of LST from 2001 to 2020. (a-c), spatial distribution, trend magnitude, and statistical significance of the annual mean LST, respectively; (d-f), spatial distribution, trend magnitude, and statistical significance of the daytime LST, respectively; (g-i), spatial distribution, trend magnitude, and statistical significance of the nighttime LST, respectively. ELT, extremely low temperature; LT, low temperature; HT, high temperature; EHT, extremely high temperature; MT, medium temperature; ESD, extremely significant decrease; SD, significant decrease; NSD, non-significant decrease; ESI, extremely significant increase; NSI, non-significant increase; SI, significant increase."

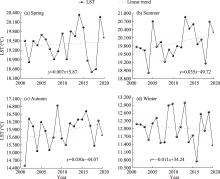
Fig. 4.
Temporal variation trends of seasonal LST from 2001 to 2020. (a), spring; (b), summer; (c), autumn; (d), winter."

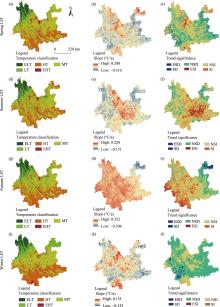
Fig. 5.
Spatial distribution and temporal trends of seasonal LST during 2001-2020. (a-c), spatial distribution, trend magnitude, and statistical significance of spring LST, respectively; (d-f), spatial distribution, trend magnitude, and statistical significance of summer LST, respectively; (g-i), spatial distribution, trend magnitude, and statistical significance of autumn LST, respectively; (j-l), spatial distribution, trend magnitude, and statistical significance of winter LST, respectively."

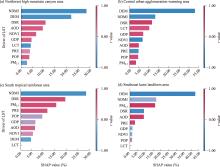
Fig. 6.
SHapley Additive exPlanations (SHAP) and correlation coefficient (r) values across typical geographical regions in Yunnan. (a), the northwest high mountain canyon area; (b), the central urban agglomeration warming area; (c), the south tropical rainforest area; (d), the southeast karst landform area. NDMI, Normalized Difference Moisture Index; DSR, downward shortwave radiation; GDP, gross domestic product; AOD, aerosol optical depth; PRE, precipitation; PM2.5, particulate matter 2.5."

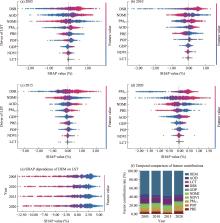
Fig. 7.
Total SHAP feature contribution comparison for LST from 2005 to 2020. (a-d), feature importance and impact of drivers on LST in 2005, 2010, 2015, and 2020, respectively; (e), SHAP dependence of DEM on LST; (f), temporal comparison of feature contributions to LST."

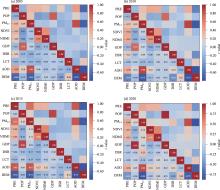
Fig. 8.
Pearson correlation heatmaps of driving factors on LST in 2005 (a), 2010 (b), 2015 (c), and 2020 (d)."

| [1] | China Meteorological Administration, 2025. China Climate Change Blue Book (2025). [2025-04-10]. https://www.cma.gov.cn/2011xwzx/2011xqxxw/2011xqxyw/202506/t20250630_7175137.html (in Chinese). |
| [2] | Ding, W.X., Wu, Q., Chen, Y.X., 2024. Trends of maximum annual sea surface temperature in the eastern China seas. Frontiers in Marine Science. 11, 1452125, doi: 10.3389/fmars.2024.1452125. |
| [3] | Du, J.Z., Wang, K.C., Cui, B.S., et al., 2020. Correction of inhomogeneities in observed land surface temperatures over China. Journal of Climate. 33(20), 8885-8902. |
| [4] | Fan, Z.Y., Zhang, Q.M., Liu, H.M., et al., 2019. Spatial-temporal distribution of urban heat island and the heating effect of impervious surface in summer in Wuhan. Journal of Geo-information Science. 21(2), 226-235 (in Chinese). |
| [5] | Grekousis, G., 2025. Geographical-XGBoost: a new ensemble model for spatially local regression based on gradient-boosted trees. Journal of Geographical Systems. 27, 169-195. |
| [6] | Hamed, K.H., 2008. Trend detection in hydrologic data: The Mann-Kendall trend test under the scaling hypothesis. Journal of Hydrology. 349(3-4), 350-363. |
| [7] | He, Z.W., Tang, B.H., 2023. Spatiotemporal change patterns and driving factors of land surface temperature in the Yunnan-Kweichow Plateau from 2000 to 2020. Science of The Total Environment. 896, 165288, doi: 10.1016/j.scitotenv.2023.165288. |
| [8] | Hu, D., Guo, F., Meng, Q., et al., 2024. A novel dual-layer composite framework for downscaling urban land surface temperature coupled with spatial autocorrelation and spatial heterogeneity. International Journal of Applied Earth Observation and Geoinformation. 130, 103900, doi: 10.1016/j.jag.2024.103900. |
| [9] | Huang, B.Z., He, B.J., 2025. Lawn and irrigation cooling from ground longwave radiation reduction: Understanding the climate-driven variability in cooling performance. Urban Climate. 60, 102360, doi: 10.1016/j.uclim.2024.102360. |
| [10] | IPCC (Intergovernmental Panel on Climate Change), 2023. Climate Change 2023: Synthesis Report. In:Contribution of Working Groups I, II and III to the Sixth Assessment Report of the Intergovernmental Panel on Climate Change. Geneva: IPCC. |
| [11] | Jia, R.Y., Liu, J.W., He, T., et al., 2024. Population heat exposure risk from the perspective of urban heat island spatial expansion in China during 2005-2020. Urban Climate. 56, 101987, doi: 10.1016/j.uclim.2024.101987. |
| [12] | Kang, L.G., Cao, S.Q., Cao, G.C., et al., 2023. Spatiotemporal variation characteristics of LST in the Qinghai Lake Basin. Arid Land Geography. 46(7), 1084-1097 (in Chinese). |
| [13] | Li, B., Wang, H.M., Qin, M.Z., et al., 2017a. Comparative study on the relationship between NDVI, NDMI, and LST. Progress in Geography. 36(5), 585-596 (in Chinese). |
| [14] | Li, Q.X., Sun, W.B., Huang, B.Y., et al., 2020. Consistency of global warming trends strengthened since 1880s. Science Bulletin. 65(20), 1709-1712. |
| [15] | Li, Q.X., Sun, W.B., Yun, X., et al., 2021. An updated evaluation of the global mean land surface air temperature and surface temperature trends based on CLSAT and CMST. Climate Dynamics. 56(1-2), 635-650. |
| [16] | Li, X.M., Zhou, Y.Y., Asrar, G.R., et al., 2017b. The surface urban heat island response to urban expansion: a panel analysis for the conterminous United States. Science of The Total Environment. 605-606, 426-435. |
| [17] | Li, Y.F., Yang, K., Yang, R., 2016. Land surface temperature estimation from remote sensing data—A case study in Kun Ming City. In:Proceedings of the 2015 23rd International Conference on Geoinformatics. Wuhan, China. |
| [18] | Liang, H.W., Alimujiang, K.S.M., Zhang, X.L., et al., 2023. Spatiotemporal changes in LST and their influencing factors in oasis urban agglomerations in arid regions: A case study of the urban agglomeration on the northern slope of the Tianshan Mountains. Acta Ecologica Sinica. 43(9), 3650-3664 (in Chinese). |
| [19] | Liao, C.L., Zhou, P.F., Ye, J.X., et al., 2025. Spatial and temporal distribution of land surface temperature and its driving factors in Central Yunnan. Journal of Guangxi Normal University (Natural Science Edition). 43(1), 185-200 (in Chinese). |
| [20] | Lin, Z.L., Xu, H.Q., Han, L.Y., et al., 2024. Day and night: impact of 2D/3D urban features on land surface temperature and their spatiotemporal non-stationary relationships in urban building spaces. Sustainable Cities and Society. 108, 103829, doi: 10.1016/j.scs.2024.103829. |
| [21] | Liu, B.Q., Wu, G.X., Mao, JY., et al., 2013. Genesis of the South Asian High and its impact on the Asian summer monsoon onset. Journal of Climate. 26(9), 2976-2991. |
| [22] | Liu, P., Wu, G.J., Cao, B., et al., 2024. Variation in glacier albedo on the Tibetan Plateau between 2001 and 2022 based on MODIS data. Remote Sensing. 16(18), 3472, doi: 10.3390/rs16183472. |
| [23] | Liu, X., He, J.T., Xiong, K., et al., 2022. Identification of factors affecting public willingness to pay for heat mitigation and adaptation: Evidence from Guangzhou, China. Urban Climate. 48, 101405, doi: 10.1016/j.uclim.2022.101405. |
| [24] | Lundberg, S., Lee, S., 2017. A unified approach to interpreting model predictions. In:Proceedings of the 31st International Conference on Neural Information Processing Systems (NIPS 2017). Red Hook: Curran Associates Inc., 4768-4777. |
| [25] | Luo, X., Yang, J., Sun, W., et al., 2021. Suitability of human settlements in mountainous areas from the perspective of ventilation: A case study of the main urban area of Chongqing. Journal of Cleaner Production. 310, 127467, doi: 10.1016/j.jclepro.2021.127467. |
| [26] | Ma, X.F., Huang, G., Cao, J.J., 2022. The significant roles of anthropogenic aerosols on surface temperature under carbon neutrality. Science Bulletin. 67(5), 470-473. |
| [27] | Mao, K.B., Ma, Y., Tan, X.L., et al., 2016. Global surface temperature change analysis based on MODIS data in recent twelve years. Advances in Space Research. 59(4), 503-512. |
| [28] | Mao, K.B., Yan, Y.B., Zhao, B., et al., 2023. Spatiotemporal variation and driving factors of land surface temperature in China. Journal of Catastrophology. 38(2), 60-73 (in Chinese). |
| [29] | Peng, S.Z.,2020. 1-km Monthly Precipitation Dataset for China (1901-2024). [2025-04-10]. https://www.tpdc.ac.cn/en/data/faae7605-a0f2-4d18-b28f-5cee413766a2 (in Chinese). |
| [30] | Ran, Y.J., Lei, D.M., Liu, L., et al., 2021. Impact of land use change on ecosystem service value in urban agglomeration of central Yunnan Province during 2000-2020. Bulletin of Soil and Water Conservation. 41(4), 310-322 (in Chinese). |
| [31] | Ren, J.Y., Yang, J., Yu, W.B., et al., 2024. Investigating the attribution of urban thermal environment changes under background climate and anthropogenic exploitation scenarios. Sustainable Cities and Society. 107, 105466, doi: 10.1016/j.scs.2024.105466. |
| [32] | Skiles, M.K., Painter, T.H., Deems, J.S., et al., 2013. Dust radiative forcing in snow of the upper Colorado River basin: 2. Interannual variability in radiative forcing and snowmelt rates. Water Resources Research. 48(7), WR011986, doi: 10.1029/2012WR011986. |
| [33] | Song, Z., Li, R., Qiu, R., et al., 2018. Global land surface temperature influenced by vegetation cover and PM2.5 from 2001 to 2016. Remote Sensing. 10(12), 2034, doi: 10.3390/rs10122034. |
| [34] | Taripanah, F., Ranjbar, A., 2021. Quantitative analysis of spatial distribution of land surface temperature (LST) in relation to ecohydrological, terrain and socio-economic factors based on Landsat data in mountainous area. Advances in Space Research. 68(9), 3622-3640. |
| [35] | Tian, H., Liu, L., Zhang, Z.Y., et al., 2024. Spatiotemporal differentiation and attribution of land surface temperature in China in 2001-2020. Journal of Geographical Sciences. 34(2), 375-396 (in Chinese). |
| [36] | Tian, Q., Prange, M., Merkel, U., 2016. Precipitation and temperature changes in the major Chinese river basins during 1957-2013 and links to sea surface temperature. Journal of Hydrology. 536, 208-221. |
| [37] | Tun, Z.K., Pramanik, M., Mallick, S.K., et al., 2025. Cooling the cities: A comprehensive review of urban heat island mitigation strategies in Southeast Asia. Human Settlements and Sustainability. 1(2), 91-102. |
| [38] | Wang, A., Dai, Y., Zhang, M.M., et al., 2025a. Exploring the cooling intensity of green cover on urban heat island: A case study of nine main urban districts in Chongqing. Sustainable Cities and Society. 124, 106299, doi: 10.1016/j.scs.2024.106299. |
| [39] | Wang, J.C., Dong, L.J., Ji, S.Y., 2025b. Rock mass instability early warning model: A case study of a high and steep annular slope mining areas using Sen’s slope trend analysis. Tunnelling and Underground Space Technology. 159, 106514, doi: 10.1016/j.tust.2025.106514. |
| [40] | Wang, X.Y., Yang, J., Yu, W.B., et al., 2024. Spatial effect of urban morphology on land surface temperature from the perspective of local climate zone. Remote Sensing Applications: Society and Environment. 36, 101324, doi: 10.1016/j.rsase.2024.101324. |
| [41] | Wang, Y.X., Ding, K., Huang, X.Y., et al., 2014. Study on the temperature lapse rate in Yunnan mountainous areas using remote sensing instantaneous temperature fields. Journal of Remote Sensing. 18(4), 912-922 (in Chinese). |
| [42] | Wei, J., Li, Z.Q., 2023. ChinaHighPM2.5: High-resolution and High-quality Ground-level PM2.5 Dataset for China (2000-2023). [2025-04-10]. https://data.tpdc.ac.cn/zh-hans/data/6168e75d-93ab-4e4a-b7ff-33152e49d0bf (in Chinese). |
| [43] | Wu, Z.F., Wang, Y., Ren, Y., 2025. Optimizing green space-building landscape characteristics of key urban functional zones for comprehensive thermal environment mitigation. Landscape and Urban Planning. 257, 105274, doi: 10.1016/j.landurbplan.2025.105314. |
| [44] | Xu, X.L., 2017a. China’s GDP Spatial Distribution Grid Data Set. [2025-04-10]. https://doi.org/10.12078/2017121102 (in Chinese). |
| [45] | Xu, X.L., 2017b. China’s Population Spatial Distribution Grid Data Set. [2025-04-10]. https://doi.org/10.12078/2017121101 (in Chinese). |
| [46] | Xue, B., Xiao, X., Li, J.Z., et al., 2023. Multi-source data-driven identification of urban functional areas: A case of Shenyang, China. Chinese Geographical Science. 33(1), 21-35. |
| [47] | Yang, J., Wang, Y.C., Xiu, C.L., et al., 2020. Optimizing local climate zones to mitigate urban heat island effect in human settlements. Journal of Cleaner Production. 275, 123767, doi: 10.1016/j.jclepro.2020.123767. |
| [48] | Yang, J., Huang, X., 2021. The 30 m annual land cover dataset and its dynamics in China from 1990 to 2019. Earth System Science Data. 13(8), 3907-3925. |
| [49] | Yang, J., Yu, W.B., Baklanov, A., et al., 2025. Mainstreaming the local climate zone framework for climate-resilient cities. Nature Communications. 16, 61394, doi: 10.1038/s41467-025-61394-w. |
| [50] | Yu, W.B., Yang, J., Ren, J.Y., et al., 2025. Identifying localized heat zones in urban heat islands from a hill and saddle perspective. Sustainable Cities and Society. 118, 106028, doi: 10.1016/j.scs.2024.106028. |
| [51] | Yunnan Provincial Bureau of Statistics, 2020. Yunnan Statistical Yearbook 2020 (No. 36). Beijing: China Statistics Press (in Chinese). |
| [52] | Zhai, R., Tao, F.L., 2021. Climate change in China affects runoff and terrestrial ecosystem water retention more than changes in leaf area index and land use/cover over the period 1982-2015. Journal of Geophysical Research-Biogeosciences. 126(4), e2020JG005902, doi: 10.1029/2020JG005902. |
| [53] | Zhang, M.M., Yigit, I., Adiguzel, F., et al., 2024. Impact of urban surfaces on microclimatic conditions and thermal comfort in Burdur, Türkiye. Atmosphere. 15(11), 1375, doi: 10.3390/atmos15111375. |
| [54] | Zhang, X.L., Kasimu, A., Liang, H.W., et al., 2024a. Mechanism analysis of vegetation phenology in an urban agglomeration in an arid zone driven by seasonal land surface temperatures. Urban Climate. 53, 101278, doi: 10.1016/j.uclim.2024.101278. |
| [55] | Zhang, X.T., Wang, D.D., Liu, Q., et al., 2019. An operational approach for generating the global land surface downward shortwave radiation product from MODIS data. IEEE Transactions on Geoscience and Remote Sensing. 57(7), 4636-4650. |
| [56] | Zhao, B.Y., Sun, Z.Q., Wang, M., et al., 2025. Tracking global large lake surface temperature variation from space using MODIS land surface temperature product. Ecological Informatics. 89, 103184, doi: 10.1016/j.ecoint.2025.103184. |
| [57] | Zhou, L., Hu, F.N., Wang, B., et al., 2022. Relationship between urban landscape structure and land surface temperature: spatial hierarchy and interaction effects. Sustainable Cities and Society. 80, 103795, doi: 10.1016/j.scs.2022.103795. |
| [58] | Zhu, H.J., Wang, A., Wang, P.T., et al., 2025. Spatiotemporal dynamics and response of land surface temperature and kernel normalized difference vegetation index in Yangtze River Economic Belt, China: Multi-method analysis. Land. 14(3), 598, doi: 10.3390/land14030598. |
| [1] | Subrata HALDAR, Somnath MANDAL, Subhasis BHATTACHARYA, Suman PAUL. Dynamicity of Land Use/Land Cover (LULC): An analysis from peri-urban and rural neighbourhoods of Durgapur Municipal Corporation (DMC) in India [J]. Regional Sustainability, 2023, 4(2): 150-172. |
| Viewed | ||||||
|
Full text |
|
|||||
|
Abstract |
|
|||||
 REGSUS Wechat
 新公网安备 65010402001202号