Regional Sustainability ›› 2025, Vol. 6 ›› Issue (1): 100199.doi: 10.1016/j.regsus.2025.100199cstr: 32279.14.REGSUS.2025007
• Full Length Article • Previous Articles
Mihail DEMIDIONOV*( )
)
Received:2024-07-19
Accepted:2024-12-25
Published:2025-02-28
Online:2025-03-13
Contact:
* E-mail address: Mihail DEMIDIONOV. Green hydrogen production from wind energy in Far Eastern Federal District (FEFD), the Russian Federation[J]. Regional Sustainability, 2025, 6(1): 100199.
Table 1
Description of the selected meteorological stations in the four regions."
| Region | Meteorological station | Number | Latitude (N) | Longitude (E) | Elevation (m) |
|---|---|---|---|---|---|
| Sakhalinskaya Oblast’ | Aleksandrovsk-Sakhalinskiy | 32061 | 50°54′ | 142°10′ | 31 |
| Ilyinskiy | 32121 | 47°59′ | 142°12′ | 18 | |
| Kholmsk | 32133 | 47°03′ | 142°03′ | 44 | |
| Nogliki | 32053 | 51°49′ | 143°09′ | 34 | |
| Okha | 32010 | 53°35′ | 142°57′ | 8 | |
| Pogibi | 32027 | 52°13′ | 141°38′ | 6 | |
| Poronaysk | 32098 | 49°13′ | 143°06′ | 4 | |
| Severo-Kuril’sk | 32215 | 50°41′ | 156°08′ | 23 | |
| Yuzhno-Kuril’sk | 32165 | 44°01′ | 145°51′ | 49 | |
| Yuzhno-Sakhalinsk | 32150 | 46°57′ | 142°43′ | 24 | |
| Primorskiy Krai | Anuchino | 31981 | 43°58′ | 133°04′ | 188 |
| Dal’nerechensk | 31873 | 45°56′ | 133°44′ | 101 | |
| Posiet | 31969 | 42°39′ | 130°48′ | 36 | |
| Preobrazheniye | 31989 | 42°54′ | 133°54′ | 43 | |
| Rudnaya Pristan’ | 31959 | 44°22′ | 135°51′ | 34 | |
| Sosunovo | 31866 | 46°32′ | 138°20′ | 4 | |
| Terney | 31909 | 45°03′ | 136°36′ | 68 | |
| Vladivostok | 31960 | 43°07′ | 131°56′ | 183 | |
| Khabarovskiy Kai | Sovetskaya Gavan’ | 31770 | 48°58′ | 140°18′ | 22 |
| Amurskaya Oblast’ | Belogorsk | 31513 | 50°55′ | 128°28′ | 178 |
Table 2
Annual wind speed statistics of 20 meteorological stations during 2014-2023."
| Meteorological station | Average wind speed (m/s) | Standard deviation (m/s) | Maximum wind speed (m/s) | Median wind speed (m/s) |
|---|---|---|---|---|
| Aleksandrovsk-Sakhalinskiy | 5.172 | 2.489 | 21.371 | 4.517 |
| Anuchino | 2.037 | 0.752 | 5.734 | 1.911 |
| Belogorsk | 2.415 | 1.186 | 10.946 | 2.259 |
| Dal’nerechensk | 3.049 | 1.377 | 10.251 | 2.954 |
| Ilyinskiy | 6.220 | 3.145 | 25.888 | 5.560 |
| Kholmsk | 5.045 | 2.831 | 19.112 | 4.517 |
| Nogliki | 4.289 | 1.749 | 15.984 | 3.996 |
| Okha | 5.360 | 2.557 | 21.371 | 4.865 |
| Pogibi | 6.468 | 3.690 | 25.019 | 5.560 |
| Poronaysk | 4.318 | 1.808 | 15.463 | 3.996 |
| Posiet | 4.588 | 2.446 | 19.459 | 3.822 |
| Preobrazheniye | 3.137 | 1.266 | 14.247 | 2.954 |
| Rudnaya Pristan’ | 3.358 | 1.773 | 15.637 | 2.954 |
| Severo-Kuril’sk | 5.145 | 3.133 | 21.197 | 4.517 |
| Sosunovo | 5.700 | 2.226 | 22.587 | 5.386 |
| Sovetskaya Gavan’ | 3.525 | 2.572 | 22.934 | 2.780 |
| Terney | 4.273 | 3.057 | 21.197 | 3.300 |
| Vladivostok | 7.843 | 3.120 | 23.455 | 7.297 |
| Yuzhno-Kuril’sk | 5.842 | 3.093 | 24.845 | 5.212 |
| Yuzhno-Sakhalinsk | 3.293 | 1.611 | 12.857 | 2.954 |
Table 3
Average monthly wind speed of 20 meteorological stations."
| Meteorological station | Average monthly wind speed (m/s) | |||||||||||
|---|---|---|---|---|---|---|---|---|---|---|---|---|
| January | February | March | April | May | June | July | August | September | October | November | December | |
| Aleksandrovsk-Sakhalinskiy | 5.308 | 5.369 | 5.318 | 5.299 | 4.721 | 3.897 | 3.794 | 4.033 | 5.128 | 6.099 | 6.709 | 6.419 |
| Anuchino | 1.853 | 2.104 | 2.369 | 2.708 | 2.403 | 1.823 | 1.693 | 1.545 | 1.779 | 2.236 | 1.996 | 1.905 |
| Belogorsk | 1.817 | 2.095 | 2.766 | 3.602 | 3.140 | 2.254 | 2.133 | 1.908 | 2.183 | 2.582 | 2.387 | 1.979 |
| Dal’nerechensk | 2.844 | 3.190 | 3.489 | 3.997 | 3.496 | 2.711 | 2.499 | 2.243 | 2.452 | 3.401 | 3.274 | 2.987 |
| Ilyinskiy | 6.150 | 6.104 | 6.295 | 6.709 | 6.004 | 5.470 | 5.115 | 5.343 | 5.693 | 6.821 | 7.429 | 7.492 |
| Kholmsk | 5.152 | 5.376 | 5.426 | 5.631 | 4.774 | 3.550 | 3.498 | 3.854 | 4.724 | 5.858 | 6.366 | 6.293 |
| Nogliki | 4.331 | 4.451 | 4.323 | 4.933 | 4.482 | 4.035 | 3.699 | 3.710 | 3.910 | 4.362 | 4.521 | 4.731 |
| Okha | 6.097 | 5.622 | 4.997 | 5.610 | 5.152 | 4.676 | 4.707 | 4.409 | 4.492 | 5.320 | 6.248 | 7.202 |
| Pogibi | 6.061 | 5.786 | 5.292 | 5.931 | 6.206 | 6.869 | 7.429 | 6.255 | 6.486 | 7.180 | 6.826 | 6.949 |
| Poronaysk | 4.334 | 4.333 | 4.383 | 4.572 | 4.505 | 3.912 | 3.744 | 4.090 | 4.319 | 4.653 | 4.454 | 4.508 |
| Posiet | 6.161 | 5.445 | 4.619 | 4.510 | 4.099 | 3.585 | 3.232 | 3.741 | 3.635 | 4.345 | 5.422 | 6.296 |
| Preobrazheniye | 3.628 | 3.190 | 2.981 | 3.082 | 2.941 | 2.710 | 2.513 | 3.101 | 3.489 | 3.298 | 3.320 | 3.388 |
| Rudnaya Pristan’ | 5.139 | 4.428 | 3.396 | 3.264 | 2.830 | 2.248 | 2.040 | 2.316 | 2.721 | 3.474 | 3.797 | 4.698 |
| Severo-Kuril’sk | 6.602 | 7.027 | 6.760 | 6.200 | 4.360 | 3.362 | 2.921 | 3.315 | 4.429 | 5.474 | 5.577 | 5.884 |
| Sosunovo | 6.634 | 6.259 | 5.654 | 5.753 | 5.655 | 5.314 | 4.537 | 5.008 | 5.436 | 5.688 | 5.849 | 6.667 |
| Sovetskaya Gavan’ | 3.937 | 3.536 | 3.524 | 3.804 | 3.192 | 2.380 | 2.002 | 2.309 | 3.139 | 4.578 | 4.870 | 5.029 |
| Terney | 7.696 | 6.410 | 4.497 | 3.947 | 2.961 | 1.695 | 1.439 | 1.851 | 2.504 | 4.547 | 6.057 | 7.738 |
| Vladivostok | 8.414 | 7.977 | 7.824 | 8.293 | 8.154 | 7.651 | 7.011 | 7.362 | 7.147 | 7.910 | 8.144 | 8.105 |
| Yuzhno-Kuril’sk | 7.098 | 6.903 | 6.356 | 5.977 | 4.822 | 4.641 | 3.646 | 4.167 | 4.551 | 6.371 | 7.031 | 7.271 |
| Yuzhno-Sakhalinsk | 3.152 | 3.176 | 3.419 | 3.841 | 4.100 | 4.003 | 3.340 | 3.038 | 2.741 | 3.074 | 2.829 | 2.811 |

Fig. 1.
Wind speed of meteorological stations in Sakhalinskaya oblast’ (a) and Primorskiy Krai, Amurskaya oblast’, and Khabarovskiy Krai (b)."

Table 4
Shape factor and scale factor values calculated using five methods at the 20 meteorological stations."
| Meteorological station | EMJ | EML | MLE | PDM | MQM | |||||
|---|---|---|---|---|---|---|---|---|---|---|
| Shape factor | Scale factor | Shape factor | Scale factor | Shape factor | Scale factor | Shape factor | Scale factor | Shape factor | Scale factor | |
| Aleksandrovsk-Sakhalinskiy | 2.210 | 5.840 | 2.210 | 5.842 | 2.192 | 5.857 | 2.045 | 5.582 | 2.676 | 5.180 |
| Anuchino | 2.951 | 2.283 | 2.951 | 2.282 | 2.862 | 2.283 | 2.776 | 2.299 | 3.560 | 2.118 |
| Belogorsk | 2.166 | 2.727 | 2.166 | 2.728 | 2.149 | 2.731 | 2.088 | 2.715 | 2.269 | 2.655 |
| Dal’nerechensk | 2.371 | 3.440 | 2.371 | 3.441 | 2.351 | 3.446 | 2.291 | 3.391 | 2.595 | 3.402 |
| Ilyinskiy | 2.097 | 7.022 | 2.097 | 7.026 | 2.109 | 7.050 | 2.023 | 6.646 | 2.132 | 6.602 |
| Kholmsk | 1.873 | 5.682 | 1.873 | 5.686 | 1.901 | 5.713 | 1.822 | 5.453 | 1.765 | 5.560 |
| Nogliki | 2.650 | 4.826 | 2.650 | 4.827 | 2.516 | 4.829 | 2.423 | 4.681 | 3.298 | 4.466 |
| Okha | 2.234 | 6.052 | 2.234 | 6.054 | 2.220 | 6.068 | 2.127 | 5.774 | 2.355 | 5.684 |
| Pogibi | 1.840 | 7.280 | 1.840 | 7.285 | 1.884 | 7.331 | 1.748 | 6.898 | 2.016 | 6.668 |
| Poronaysk | 2.573 | 4.863 | 2.573 | 4.863 | 2.477 | 4.870 | 2.376 | 4.710 | 3.114 | 4.496 |
| Posiet | 1.980 | 5.176 | 1.980 | 5.179 | 2.012 | 5.207 | 1.840 | 4.985 | 2.487 | 4.430 |
| Preobrazheniye | 2.679 | 3.528 | 2.679 | 3.529 | 2.572 | 3.529 | 2.505 | 3.485 | 2.990 | 3.339 |
| Rudnaya Pristan’ | 2.001 | 3.789 | 2.001 | 3.791 | 2.021 | 3.807 | 1.826 | 3.715 | 2.757 | 3.374 |
| Severo-Kuril’sk | 1.714 | 5.770 | 1.714 | 5.774 | 1.749 | 5.810 | 1.650 | 5.557 | 1.765 | 5.560 |
| Sosunovo | 2.776 | 6.404 | 2.776 | 6.404 | 2.612 | 6.403 | 2.538 | 6.122 | 3.240 | 6.031 |
| Sovetskaya Gavan’ | 1.409 | 3.872 | 1.409 | 3.875 | 1.538 | 3.954 | 1.301 | 3.892 | 1.916 | 3.366 |
| Terney | 1.438 | 4.707 | 1.438 | 4.711 | 1.491 | 4.761 | 1.416 | 4.667 | 1.394 | 4.294 |
| Vladivostok | 2.721 | 8.817 | 2.721 | 8.818 | 2.657 | 8.834 | 2.576 | 8.290 | 2.904 | 8.279 |
| Yuzhno-Kuril’sk | 1.995 | 6.591 | 1.995 | 6.595 | 2.014 | 6.621 | 1.879 | 6.263 | 2.269 | 6.126 |
| Yuzhno-Sakhalinsk | 2.170 | 3.718 | 2.170 | 3.720 | 2.163 | 3.730 | 2.029 | 3.647 | 2.418 | 3.437 |

Fig. 2.
Histogram of empirical wind speed data and the Weibull distribution of wind speed data calculated by the five methods (Empirical Method of Justus (EMJ), Empirical Method of Lysen (EML), Maximum Likelihood Method (MLE), Power Density Method (PDM), and Median and Quartiles Method (MQM)) at the 20 meteorological stations (a-t)."

Table 5
Goodness-of-fit test results of the five methods."
| Meteorological station | EMJ | EML | MLE | PDM | MQM | |||||
|---|---|---|---|---|---|---|---|---|---|---|
| R2 | RMSE | R2 | RMSE | R2 | RMSE | R2 | RMSE | R2 | RMSE | |
| Aleksandrovsk-Sakhalinskiy | 0.8479* | 0.0280* | 0.8477 | 0.0280 | 0.8454 | 0.0283 | 0.8476 | 0.0281 | 0.7597 | 0.0351 |
| Anuchino | 0.9857 | 0.0223 | 0.9857 | 0.0223 | 0.9876* | 0.0216* | 0.9858 | 0.0249 | 0.0821 | 0.2455 |
| Belogorsk | 0.9773* | 0.0202* | 0.9772 | 0.0202* | 0.9762 | 0.0208 | 0.9729 | 0.0225 | 0.5375 | 0.0919 |
| Dal’nerechensk | 0.9691 | 0.0203 | 0.9690 | 0.0204 | 0.9683 | 0.0208 | 0.9724* | 0.0198* | 0.6589 | 0.0680 |
| Ilyinskiy | 0.9408 | 0.0121 | 0.9406 | 0.0121 | 0.9391 | 0.0123 | 0.9487* | 0.0112* | 0.8401 | 0.0200 |
| Kholmsk | 0.9090 | 0.0176 | 0.9088 | 0.0177 | 0.9057 | 0.0179 | 0.9160* | 0.0168* | 0.7595 | 0.0286 |
| Nogliki | 0.8929 | 0.0313* | 0.8929 | 0.0313* | 0.8886 | 0.0326 | 0.8972* | 0.0316 | 0.7365 | 0.0499 |
| Okha | 0.9476 | 0.0143 | 0.9475 | 0.0143 | 0.9466 | 0.0145 | 0.9528* | 0.0136* | 0.8178 | 0.0263 |
| Pogibi | 0.8682 | 0.0180 | 0.8680 | 0.0180 | 0.8656 | 0.0181 | 0.8689* | 0.0177* | 0.7981 | 0.0220 |
| Poronaysk | 0.8614 | 0.0345 | 0.8613 | 0.0345 | 0.8603 | 0.0351 | 0.8742* | 0.0336* | 0.7416 | 0.0479 |
| Posiet | 0.7893* | 0.0358* | 0.7890 | 0.0358 | 0.7879 | 0.0358 | 0.7828 | 0.0363 | 0.6852 | 0.0443 |
| Preobrazheniye | 0.9724 | 0.0184* | 0.9724 | 0.0184* | 0.9719 | 0.0193 | 0.9743* | 0.0188 | 0.6065 | 0.0733 |
| Rudnaya Pristan’ | 0.8431* | 0.0412 | 0.8428 | 0.0412 | 0.8430 | 0.0411* | 0.8176 | 0.0444 | 0.6531 | 0.0627 |
| Severo-Kuril’sk | 0.9414* | 0.0126* | 0.9413 | 0.0127 | 0.9407 | 0.0126* | 0.9383 | 0.0128 | 0.8181 | 0.0220 |
| Sosunovo | 0.9288* | 0.0189* | 0.9288* | 0.0189* | 0.9183 | 0.0208 | 0.9243 | 0.0198 | 0.8277 | 0.0286 |
| Sovetskaya Gavan’ | 0.7853 | 0.0366 | 0.7853 | 0.0366 | 0.8319* | 0.0328* | 0.7280 | 0.0409 | 0.6796 | 0.0460 |
| Terney | 0.8469 | 0.0243 | 0.8468 | 0.0243 | 0.8474* | 0.0242* | 0.8451 | 0.0244 | 0.7229 | 0.0331 |
| Vladivostok | 0.9390 | 0.0122 | 0.9389 | 0.0122 | 0.9394 | 0.0123 | 0.9549* | 0.0105* | 0.8624 | 0.0176 |
| Yuzhno-Kuril’sk | 0.9187* | 0.0159* | 0.9185 | 0.0159* | 0.9180 | 0.0159* | 0.9137 | 0.0161 | 0.8457 | 0.0212 |
| Yuzhno-Sakhalinsk | 0.8970* | 0.0353* | 0.8968 | 0.0354 | 0.8950 | 0.0358 | 0.8923 | 0.0367 | 0.6049 | 0.0691 |
Table 6
Technical specifications of the three wind turbines."
| Wind turbine | Lifetime (a) | Rated power (×106 W) | Cut-in wind speed (m/s) | Rated wind speed (m/s) | Cut-off wind speed (m/s) | ||||
|---|---|---|---|---|---|---|---|---|---|
| Senvion 6150 onshore | 20 | 6.15 | 3.500 | 12.000 | 25.000 | ||||
| H165-4.0 MW | 20 | 4.00 | 3.000 | 9.100 | 20.000 | ||||
| Vestas V150-4.2 MW | 20 | 4.20 | 3.000 | 11.000 | 24.500 | ||||

Fig. 3.
Capacity factor of the three wind turbines at 20 meteorological stations. The calculated methods are specified in parentheses."


Fig. 4.
Annual electricity generation by the three wind turbines at 20 meteorological stations. The calculated methods are specified in parentheses."


Fig. 5.
Annual green hydrogen production by the three wind turbines at 20 meteorological stations. The calculated methods are specified in parentheses."


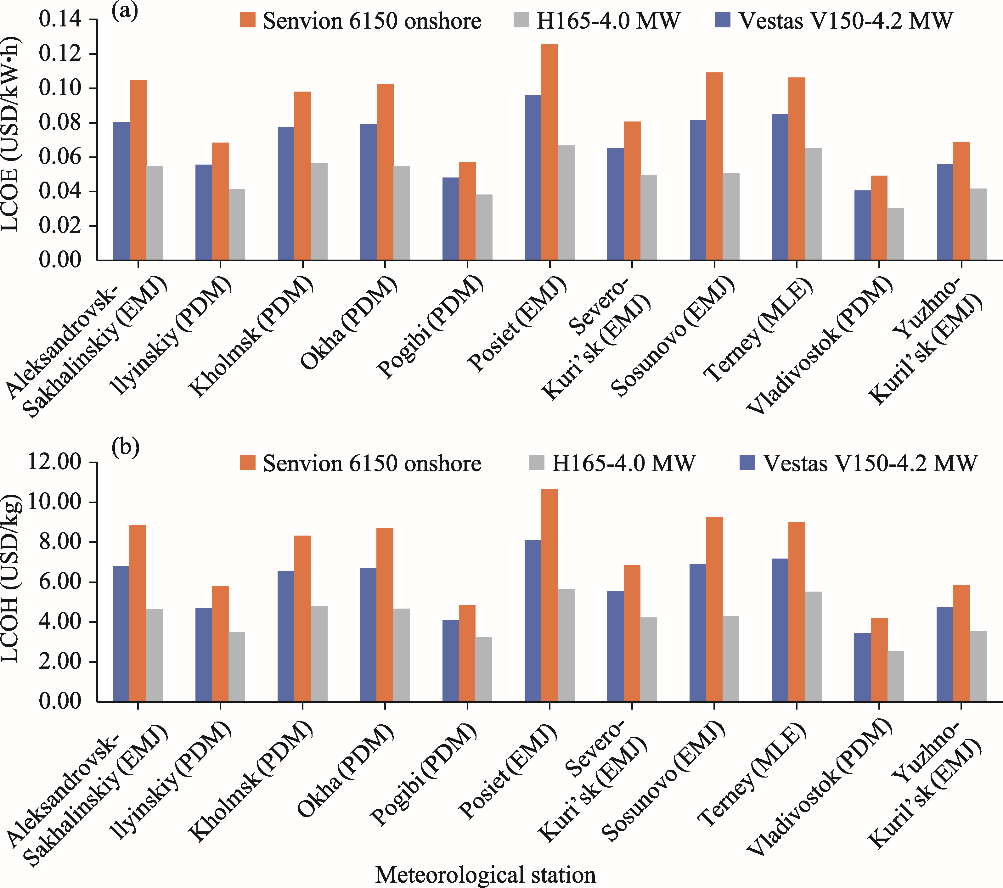
Fig. 6.
Levelized cost of electricity (LCOE) and levelized cost of hydrogen (LCOH) for the three wind turbines. Note that only meteorological stations where the LCOE was less than 0.10 USD/kW•h for at least one of the wind turbines are shown. The calculated methods are specified in parentheses."
| [1] | Adaramola M., Paul S., Oyedepo S.O., 2011. Assessment of electricity generation and energy cost of wind energy conversion systems in North-Central Nigeria. Energy Conv. Manag. 52, 3363-3368. |
| [2] | Adaramola M.S., Agelin-Chaab M., Paul S.S., 2014. Analysis of hybrid energy systems for application in southern Ghana. Energy Conv. Manag. 88, 284-295. |
| [3] | Aghaloo K., Ali T., Chiu, Y-R., et al., 2023. Optimal site selection for the solar-wind hybrid renewable energy systems in Bangladesh using an integrated GIS-based BWM-fuzzy logic method. Energy Conv. Manag. 283, 116899, doi: 10.1016/j.enconman.2023.116899. |
| [4] | Ahadi P., Fakhrabadi F., Pourshaghaghy A., et al., 2023. Optimal site selection for a solar power plant in Iran via the Analytic Hierarchy Process (AHP). Renew. Energy. 215, 118944, doi: 10.1016/j.renene.2023.118944. |
| [5] | Ahshan R., Onen A., Al-Badi A.H., 2022. Assessment of wind-to-hydrogen (wind-H2) generation prospects in the Sultanate of Oman. Renew. Energy. 200, 271-282. |
| [6] | Akdağ S.A., Dinler A., 2009. A new method to estimate Weibull parameters for wind energy applications. Energy Conv. Manag. 50(7), 1761-1766. |
| [7] | Akpinar S., Akpinar E.K., 2009. Estimation of wind energy potential using finite mixture distribution models. Energy Conv. Manag. 50(4), 877-884. |
| [8] | Alavi O., Mostafaeipour A., Qolipour M., 2016. Analysis of hydrogen production from wind energy in the southeast of Iran. Int. J. Hydrogen Energy. 41(34), 15158-15171. |
| [9] | Albraheem L., AlAwlaqi L., 2023. Geospatial analysis of wind energy plant in Saudi Arabia using a GIS-AHP technique. Energy Rep. 9, 5878-5898. |
| [10] | Aljeddani S.M.A., Mohammed M.A., 2023. A novel approach to Weibull distribution for the assessment of wind energy speed. Alex. Eng. J. 78, 56-64. |
| [11] | Ashrafi Z.N., Ghasemian M., Shahrestani M.I., et al., 2018. Evaluation of hydrogen production from harvesting wind energy at high altitudes in Iran by three extrapolating Weibull methods. Int. J. Hydrogen Energy. 43(6), 3110-3132. |
| [12] | Ayua T.J., Emetere M.E., 2023. Technical analysis of wind energy potentials using a modified Weibull and Raleigh distribution model parameters approach in the Gambia. Heliyon. 9(9), e20315, doi: 10.1016/j.heliyon.2023.e20315. |
| [13] | Berna C., Vargas-Salgado C., Alfonso-Solar D., et al., 2022. Hydrogen production from surplus electricity generated by an autonomous renewable system: Scenario 2040 on Grand Canary Island, Spain. Sustainability. 14(19), 11884, doi: 10.3390/su141911884. |
| [14] | Dabar O.A., Awaleh M.O., Waberi M.M., et al., 2024. Techno-economic and environmental assessment of green hydrogen and ammonia production from solar and wind energy in the republic of Djibouti: A geospatial modeling approach. Energy Rep. 12, 3671-3689. |
| [15] | David M., Ocampo-Martínez C., Sánchez-Peña R., 2019. Advances in alkaline water electrolyzers: A review. J. Energy Storage. 23, 392-403. |
| [16] | De Almeida J.O., Shadman M., Ramos J.S., et al., 2024. Techno-economic analysis of hydrogen production from offshore wind: The case of Brazil. Energy Conv. Manag. 322, 119109, doi: 10.1016/j.enconman.2024.119109. |
| [17] | Dehshiri S.S.H., Dehshiri S.J.H., Mostafaeipour A., et al., 2024. Techno-economic integrated multi-criteria analysis of wind to hydrogen systems: A comprehensive parametric study. Int. J. Hydrog. Energy. 88, 477-487. |
| [18] | Demidionov M.Y., 2023. Spatial modeling of the potential for alternative energy development on the example of Sakhalin Island. Pacific Geography. 4, 82-92. |
| [19] | Emeksiz C., Tan M., 2024. An innovative adaptive hybrid prediction model based on deep learning methods (CEEMDAN-GRU) for green hydrogen production, in case study: Turkey. Int. J. Hydrog. Energy. 52, 1266-1279. |
| [20] | Fetisova Y.A., Ermolenko B.V., Ermolenko G.V., et al., 2017. Determining the parameters of Weibull function to estimate the wind power potential in conditions of limited source meteorological data. Therm. Eng. 64(4), 251-257. |
| [21] | Hesty N.W., Aminuddin, Supriatna N.K., et al., 2024. Unlocking development of green hydrogen production through techno-economic assessment of wind energy by considering wind resource variability: A case study. Int. J. Hydrog. Energy. doi: 10.1016/j.ijhydene.2024.09.294. |
| [22] | Huo X.J., Yang L., Li D.H.W., 2024. Determining Weibull distribution patterns for wind conditions in building energy-efficient design across the different thermal design zones in China. Energy. 304, 132013, doi: 10.1016/j.energy.2024.132013. |
| [23] | Ikbal N.A.M., Halim S.A., Ali N., 2022. Estimating Weibull parameters using Maximum Likelihood Estimation and Ordinary Least Squares: Simulation study and application on meteorological data. Math. Stat. 10(2), 269-292. |
| [24] | Jahan S., Masseran N., Zin W., 2024. Wind speed analysis using Weibull and lower upper truncated Weibull distribution in Bangladesh. Energy Reports. 11, 5456-5465. |
| [25] | Juárez-Casildo V., Cervantes I., González-Huerta R., et al., 2024. Harnessing offshore wind for decarbonization: A geospatial study of hydrogen production and heavy industry utilization in Mexico. Int. J. Hydrogen Energy. 83, 701-716. |
| [26] | Justus C.G., Hargraves W.R., Mikhail A., et al., 1978. Methods for estimating wind speed frequency distribution. J. Appl. Meteorol. 17(3), 350-353. |
| [27] | Kang S., Khanjari A., You S., et al., 2021. Comparison of different statistical methods used to estimate Weibull parameters for wind speed contribution in nearby an offshore site, Republic of Korea. Energy Rep. 7, 7358-7373. |
| [28] | Koholé Y.W., Djiela R.H.T., Fohagui F.C.V., et al., 2023a. Comparative study of thirteen numerical methods for evaluating Weibull parameters for solar energy generation at ten selected locations in Cameroon. Cleaner Energy Systems. 4, 100047, doi: 10.1016/j.cles.2022.100047. |
| [29] | Koholé Y.W., Fohagui F.C.V., Djiela R.H.T., et al., 2023b. Wind energy potential assessment for co-generation of electricity and hydrogen in the far North region of Cameroon. Energy Conv. Manag. 279, 116765, doi: 10.1016/j.enconman.2023.116765. |
| [30] | Kutty S.S., Khan M.G.M., Ahmed M.R., 2024. Analysis of wind characteristics and wind energy resource assessment for Tonga using eleven methods of estimating Weibull parameters. Heliyon. 10(9), e30047, doi: 10.1016/j.heliyon.2024.e30047. |
| [31] | Li M.X., Bijvoet B., Wu K.J., et al., 2024a. Optimal chartering decisions for vessel fleet to support offshore wind farm maintenance operations. Ocean Eng. 298, 117202, doi: 10.1016/j.oceaneng.2024.117202. |
| [32] | Li M.X., Jiang X.L., Carroll J., et al., 2024b. Operation and maintenance management for offshore wind farms integrating inventory control and health information. Renew. Energy. 231, 120970, doi: 10.1016/j.renene.2024.120970. |
| [33] | Ly Y.T., Jia D., 2024. China Could Have a Million Hydrogen-Powered Vehicles on its Roads by 2035. [2024-06-14]. https://www.caixinglobal.com/2024-06-06/china-could-have-a-million-hydrogen-powered-vehicles-on-its-roads-by-2035-102203629.html. |
| [34] | Lysen E.H., 1983. Introduction to Wind Energy:Basic and Advanced Introduction to Wind Energy with Emphasis on Water Pumping Windmills (2nd Edition). Netherlands: Steering Committee Wind Energy Developing Countries, 40. |
| [35] | Nymphas E.F., Teliat R.O., 2024. Evaluation of the performance of five distribution functions for estimating Weibull parameters for wind energy potential in Nigeria. Scient. Afr. 23, e02037, doi: 10.1016/j.sciaf.2023.e02037. |
| [36] | Raza M.A., Yousif M., Numan M., et al., 2023. Geospatial analysis of wind energy plant in Saudi Arabia using a GIS-AHP technique. Renew. Energy. 206, 180-190. |
| [37] | Rehman K.M.K., Zayed M.E., Menesy A.S., et al., 2024. Techno-economic evaluation and improved sizing optimization of green hydrogen production and storage under higher wind penetration in Aqaba Gulf. J. Energy Storage. 99, 113368, doi: 10.1016/j.est.2024.113368. |
| [38] | Rezaei M., Naghdi-Khozani N., Jafari N., 2020. Wind energy utilization for hydrogen production in an underdeveloped country: An economic investigation. Renew. Energy. 147(1), 1044-1057. |
| [39] | Saleh H., Aly A.A.E., Abdel-Hady S., 2012. Assessment of different methods used to estimate Weibull distribution parameters for wind speed in Zafarana wind farm, Suez Gulf. Egypt. Energy. 44(1), 710-719. |
| [40] | Schmidhalter I., Mussati M.C., Mussati S.F., et al., 2024. Green hydrogen levelized cost assessment from wind energy in Argentina with dispatch constraints. Int. J. Hydrogen Energy. 53, 1083-1096. |
| [41] | Shu Z.R., Jesson M., 2021. Estimation of Weibull parameters for wind energy analysis across the UK. J. Renew. Sustain. Energy. 13(2), 023303, doi: 10.1063/5.0038001. |
| [42] | Soulouknga M.H., Doka S.Y., Revanna N., et al., 2018. Analysis of wind speed data and wind energy potential in Faya-Largeau, Chad, using Weibull distribution. Renew. Energy. 121, 1-8. |
| [43] | The Russian Government, 2021. Decree of the Government of the Russian Federation: Concept for the Development of Hydrogen Energy in the Russian Federation. [2024-05-21]. http://static.government.ru/media/files/5JFns1CDAKqYKzZ0mnRADAw2NqcVsexl.pdf. |
| [44] | The Wind Power, 2024a. V150/4000-4200. [2024-06-05]. https://www.thewindpower.net/turbine_en_1490_vestas_v150-4000-4200.php. |
| [45] | The Wind Power, 2024b. H165 4.0 MW. [2024-06-05]. https://www.thewindpower.net/turbine_en_1923_cssc%C2%A0haizhuang_h165-4.0mw.php. |
| [46] | Vestas, 2024. V150-4.2 MW. [2024-06-02]. https://www.vestas.com/en/energy-solutions/onshore-wind-turbines/4-mw-platform/V150-4-2-MW. |
| [47] | Wan Y.M., Li Y.F., Wang D., et al., 2024. International trade of green hydrogen, ammonia and methanol: Opportunities of China’s subregions. Renew. Energy. 235, 121294, doi: 10.1016/j.renene.2024.121294. |
| [48] | Yadav A.K., Malik H., Yadav V., et al., 2024. Comparative analysis of Weibull parameters estimation for wind power potential assessments. Results Eng. 23, 202300, doi: 10.1016/j.rineng.2024.102300. |
| [49] | Zhao X., 2023. Difficulties in implementing Russia’s new energy strategy and prospects for Sino-Russian Energy Cooperation. Chinese Journal of Slavic Studies. 3(2). 263-285. |
| [1] | Guzel SALIMOVA, Gulnara NIGMATULLINA, Gamir HABIROV, Alisa ABLEEVA, Rasul GUSMANOV. Employment and development levels in rural areas of the Russian Federation [J]. Regional Sustainability, 2024, 5(3): 100164-. |
| Viewed | ||||||
|
Full text |
|
|||||
|
Abstract |
|
|||||
 REGSUS Wechat
 新公网安备 65010402001202号